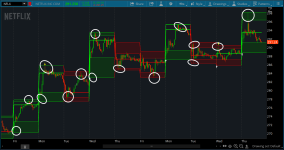
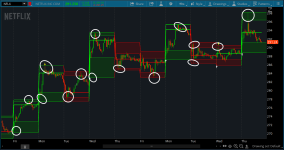
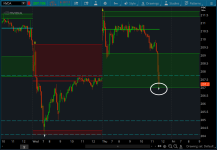
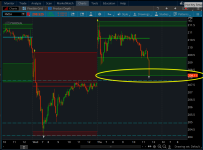
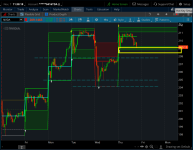
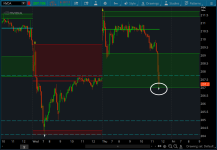
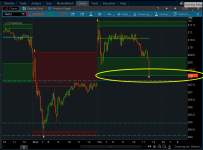
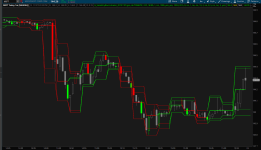
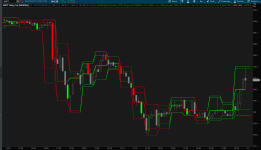
#VolumeProfile_IntradaySelection with Expanded Intraday Period Selections plus
#
#the Prior Day's Value Areas
#INPUTS
input showlines = yes;
input pricePerRowHeightMode = { AUTOMATIC, default TICKSIZE, CUSTOM};
input customRowHeight = .01;
input timePerProfile = {CHART, MINUTE, MIN2, MIN3, MIN4, MIN5, MIN10, default MIN15, MIN20, MIN30, HOUR, TWOHOUR, FOURHOUR, DAY , TWODAY, THREEDAY, FOURDAY, WEEK, MONTH, "OPT EXP", BAR};
input multiplier = 1;
input onExpansion = no;
input profiles = 1000;
input showPointOfControl = yes;
input showValueArea = yes;
input valueAreaPercent = 100.0;
input valueAreaPercent2 = 87.5;
input opacity            = 0;
def period;
def agg;
def yyyymmdd = GetYYYYMMDD();
def seconds = SecondsFromTime(0);
def month = GetYear() * 12 + GetMonth();
def day_number = DaysFromDate(First(yyyymmdd)) + GetDayOfWeek(First(yyyymmdd));
def dom = GetDayOfMonth(yyyymmdd);
def dow = GetDayOfWeek(yyyymmdd - dom + 1);
def expthismonth = (if dow > 5 then 27 else 20) - dow;
def exp_opt      = month + (dom > expthismonth);
switch (timePerProfile) {
case CHART:
period = 0;
agg = AggregationPeriod.DAY;
case MINUTE:
period = Floor(seconds / 60 + day_number * 24 * 60);
agg = AggregationPeriod.MIN;
case MIN2:
period = Floor(seconds / 120 + day_number * 24);
agg = AggregationPeriod.TWO_MIN;
case MIN3:
period = Floor(seconds / 180 + day_number * 24);
agg = AggregationPeriod.THREE_MIN;
case MIN4:
period = Floor(seconds / 240 + day_number * 24);
agg = AggregationPeriod.FOUR_MIN;
case MIN5:
period = Floor(seconds / 300 + day_number * 24);
agg = AggregationPeriod.FIVE_MIN;
case MIN10:
period = Floor(seconds / 600 + day_number * 24);
agg = AggregationPeriod.TEN_MIN;
case MIN15:
period = Floor(seconds / 900 + day_number * 24);
agg = AggregationPeriod.FIFTEEN_MIN;
case MIN20:
period = Floor(seconds / 1200 + day_number * 24);
agg = AggregationPeriod.TWENTY_MIN;
case MIN30:
period = Floor(seconds / 1800 + day_number * 24);
agg = AggregationPeriod.THIRTY_MIN;
case HOUR:
period = Floor(seconds / 3600 + day_number * 24);
agg = AggregationPeriod.HOUR;
case TWOHOUR:
period = Floor(seconds / 7200 + day_number * 24);
agg = AggregationPeriod.TWO_HOURS;
case FOURHOUR:
period = Floor(seconds / 14400 + day_number * 24);
agg = AggregationPeriod.FOUR_HOURS;
case DAY:
period = CountTradingDays(Min(First(yyyymmdd), yyyymmdd), yyyymmdd) - 1;
agg = AggregationPeriod.DAY;
case TWODAY:
period = CountTradingDays(Min(First(yyyymmdd), yyyymmdd), yyyymmdd) - 1;
agg = AggregationPeriod.TWO_DAYS;
case THREEDAY:
period = CountTradingDays(Min(First(yyyymmdd), yyyymmdd), yyyymmdd) - 1;
agg = AggregationPeriod.THREE_DAYS;
case FOURDAY:
period = CountTradingDays(Min(First(yyyymmdd), yyyymmdd), yyyymmdd) - 1;
agg = AggregationPeriod.FOUR_DAYS;
case WEEK:
period = Floor(day_number / 7);
agg = AggregationPeriod.WEEK;
case MONTH:
period = Floor(month - First(month));
agg = AggregationPeriod.MONTH;
case "OPT EXP":
period = exp_opt - First(exp_opt);
agg = AggregationPeriod.DAY;
case BAR:
period = BarNumber() - 1;
agg = AggregationPeriod.DAY;
}
def count = CompoundValue(1, if period != period[1] then (count[1] + period - period[1]) % (if timePerProfile == timePerProfile.TWODAY then 2 else if timePerProfile == timePerProfile.THREEDAY then 3 else if timePerProfile == timePerProfile.FOURDAY then 4 else multiplier) else count[1], 0);
def cond = count < count[1] + period - period[1];
def height;
switch (pricePerRowHeightMode) {
case AUTOMATIC:
height = PricePerRow.AUTOMATIC;
case TICKSIZE:
height = PricePerRow.TICKSIZE;
case CUSTOM:
height = customRowHeight;
}
profile vol     = VolumeProfile("startNewProfile" = cond, "onExpansion" = onExpansion, "numberOfProfiles" = profiles, "pricePerRow" = height, "value area percent" = valueAreaPercent);
def con = CompoundValue(1, onExpansion, no);
def pc = if IsNaN(vol.GetPointOfControl()) and con then pc[1] else vol.GetPointOfControl();
def hVA = if IsNaN(vol.GetHighestValueArea()) and con then hVA[1] else vol.GetHighestValueArea();
def lVA = if IsNaN(vol.GetLowestValueArea()) and con then lVA[1] else vol.GetLowestValueArea();
def hProfile = if IsNaN(vol.GetHighest()) and con then hProfile[1] else vol.GetHighest();
def lProfile = if IsNaN(vol.GetLowest()) and con then lProfile[1] else vol.GetLowest();
def plotsDomain = IsNaN(close) == onExpansion or showlines;
plot POC         = if plotsDomain then pc       else Double.NaN;
plot ProfileHigh = if plotsDomain then hProfile else Double.NaN;
plot ProfileLow  = if plotsDomain then lProfile else Double.NaN;
def VAHigh       = if plotsDomain then hVA      else Double.NaN;
def VALow        = if plotsDomain then lVA      else Double.NaN;
DefineGlobalColor("Profile", GetColor(1));
DefineGlobalColor("Point Of Control", Color.CYAN);
DefineGlobalColor("Value Area", GetColor(8));
vol.Show(color = Color.CURRENT, opacity = opacity, "poc color" = Color.CURRENT);
def pc1   = if pc  != pc[1]  then pc[1]  else pc1[1];
def pc2 = if pc1 != pc1[1] then pc1[1] else pc2[1];
rec uppoc = if pc1 > pc      then 1 else if uppoc[1] == 1 and pc1 >= pc then 1 else 0;
POC.AssignValueColor(if uppoc == 1 then Color.RED else Color.GREEN);
POC.SetLineWeight(2);
ProfileHigh.SetStyle(Curve.POINTS);
ProfileLow.SetPaintingStrategy(PaintingStrategy.HORIZONTAL);
ProfileHigh.SetDefaultColor(GetColor(3));
ProfileLow.SetDefaultColor(GetColor(3));
ProfileHigh.Hide();
ProfileLow.Hide();
input showarrows       = no;
input arrowsensitivity = 1;#Hint arrowsensitivity: number of ticks within 95% to create an arrow
def dn = if high >= VAHigh - TickSize() * arrowsensitivity
then 1
else if dn[1] == 1 and high >= VAHigh - TickSize() * arrowsensitivity
then 1
else 0;
plot dnarrow = if showarrows and dn[1] == 0 and dn == 1
then high + .02
else Double.NaN;
def up = if low <= VALow + TickSize() * arrowsensitivity
then 1
else if up[1] == 1 and low <= VALow + TickSize() * arrowsensitivity
then 1
else 0;
plot uparrow = if showarrows and up[1] == 0 and up == 1
then low - .02
else Double.NaN;
dnarrow.SetPaintingStrategy(PaintingStrategy.ARROW_DOWN);
uparrow.SetPaintingStrategy(PaintingStrategy.ARROW_UP);
dnarrow.SetDefaultColor(Color.YELLOW);
uparrow.SetDefaultColor(Color.WHITE);
profile vol1  = VolumeProfile("startNewProfile" = cond, "onExpansion" = onExpansion, "numberOfProfiles" = profiles, "pricePerRow" = height, "value area percent" = valueAreaPercent2);
def hVA1 = if IsNaN(vol1.GetHighestValueArea()) and con then hVA[1] else vol1.GetHighestValueArea();
def lVA1 = if IsNaN(vol1.GetLowestValueArea()) and con then lVA[1] else vol1.GetLowestValueArea();
def upvah1 = if hVA1[1] < hVA1 then 1 else if upvah1[1] == 1 and hVA1[1] <= hVA1 then 1 else 0;
def upval1 = if lVA1[1] < lVA1 then 1 else if upval1[1] == 1 and lVA1[1] <= lVA1 then 1 else 0;
plot VAHigh1 = if plotsDomain then hVA1 else Double.NaN;
plot VALow1 = if plotsDomain then lVA1 else Double.NaN;
VAHigh1.SetStyle(Curve.SHORT_DASH);
VALow1.SetStyle(Curve.SHORT_DASH);
#addcloud(vahigh,vahigh1,color.light_orange, color2 = Color.LIGHT_ORANGE);
#addcloud(valow1,valow,Color.LIGHT_GRAY, color2 = Color.LIGHT_GRAY);
def upvah = if hVA[1] < hVA then 1 else if upvah[1] == 1 and hVA[1] <= hVA then 1 else 0;
def upval = if lVA[1] < lVA then 1 else if upval[1] == 1 and lVA[1] <= lVA then 1 else 0;
def green = upvah1 == 1 and upval1 == 1;
def red = upvah1 == 0 and upval1 == 0;
def green1 = if green then 1 else if green1[1] == 1 and !red then 1 else 0;
def green1ext = if IsNaN(close) then green1ext[1] else green1;
def g1ext = green1ext;
def g1 = green1ext;
def red1 = if red then 1 else if red1[1] == 1 and !green then 1 else 0;
def red1ext = if IsNaN(close) then red1ext[1] else red1;
def r1ext = red1ext;
def r1        = red1;
VAHigh1.AssignValueColor(if green1 then Color.GREEN else Color.RED);
VALow1.AssignValueColor (if green1 then Color.GREEN else Color.RED);
plot vahplot = VAHigh;
vahplot.AssignValueColor(if green1 then Color.GREEN else Color.RED);
plot valplot = VALow;
valplot.AssignValueColor(if green1 then Color.GREEN else Color.RED);
def vahext = if IsNaN(close) then vahext[1] else VAHigh;
plot vahextp = vahext;
vahextp.AssignValueColor(if green1ext then Color.GREEN else Color.RED);
def valext = if IsNaN(close) then valext[1] else VALow;
plot valextp = valext;
valextp.AssignValueColor(if green1ext then Color.GREEN else Color.RED);
def vah1ext = if IsNaN(close) then vah1ext[1] else VAHigh1;
plot vah1extp = vah1ext;
vah1extp.AssignValueColor(if green1ext then Color.GREEN else Color.RED);
def val1ext = if IsNaN(close) then val1ext[1] else VALow1;
plot val1extp = val1ext;
val1extp.AssignValueColor(if green1ext then Color.GREEN else Color.RED);
input showclouds = no;
AddCloud(if showclouds and g1ext then vahextp else Double.NaN, vah1extp, Color.DARK_GREEN, Color.DARK_GREEN);
AddCloud(if showclouds and g1ext then val1extp else Double.NaN, valextp, Color.DARK_GREEN, Color.DARK_GREEN);
AddCloud(if showclouds and r1ext then vahextp else Double.NaN, vah1extp, Color.DARK_RED, Color.DARK_RED);
AddCloud(if showclouds and r1ext then val1extp else Double.NaN, valextp,  Color.DARK_RED, Color.DARK_RED);
POC.HideBubble();
VAHigh1.HideBubble();
VALow1.HideBubble();
vahplot.HideBubble();
valplot.HideBubble();
uparrow.HideBubble();
dnarrow.HideBubble();
vahextp.HideBubble();
vah1extp.HideBubble();
valextp.HideBubble();
val1extp.HideBubble();
input showbubbleperperiod = no;
input bubblemoverperperiodhorizontal = 10;
input bubblemoverperperiodvertical  = 2;
def bubble = if period[1] != period then BarNumber() + bubblemoverperperiodhorizontal else bubble[1];
AddChartBubble(showbubbleperperiod and BarNumber() == (bubble), Max(high, VAHigh) + bubblemoverperperiodvertical * TickSize(), (VAHigh - VALow) + "\n" + (VAHigh1 - VALow1) , if green then Color.GREEN else if red then Color.RED else Color.GRAY, yes);
input showcurrentperiodbubble = no;
input x = 8;
def x1  = x + 1;
AddChartBubble(showcurrentperiodbubble and !IsNaN(close[x1]) and IsNaN(close[x]), close[x1], (VAHigh[x1] - VALow[x1]) + " :\n" + volume(period = agg), if green[x1] then Color.GREEN else if red[x1] then Color.RED else Color.GRAY);
input n = 5;
def n1 = n + 1;
input showbubblesVAvalues = no;
AddChartBubble(showbubblesVAvalues and !IsNaN(close[n1]) and IsNaN(close[n]), Round(POC[n1], 2) , "POC: " + Round(POC[n1], 2), if uppoc[n1] == 1 then Color.RED else Color.GREEN, yes);
AddChartBubble(showbubblesVAvalues and !IsNaN(close[n1]) and IsNaN(close[n]), Round(VALow1[n1], 2) , "VL: " + Round(VALow1[n1], 2), if upval[n1] == 1 then Color.RED else Color.GREEN, yes);
AddChartBubble(showbubblesVAvalues and !IsNaN(close[n1]) and IsNaN(close[n]), Round(VALow[n1], 2) , "VL1: " + Round(VALow[n1], 2), if upval1[n1] == 1 then Color.RED else Color.GREEN, yes);
AddChartBubble(showbubblesVAvalues and !IsNaN(close[n1]) and IsNaN(close[n]), Round(VAHigh1[n1], 2) , "VH: " + Round(VAHigh1[n1], 2), if upvah1[n1] == 1 then Color.RED else Color.GREEN, yes);
AddChartBubble(showbubblesVAvalues and !IsNaN(close[n1]) and IsNaN(close[n]), Round(VAHigh[n1], 2) , "VH1: " + Round(VAHigh[n1], 2), if upvah[n1] == 1 then Color.RED else Color.GREEN, yes);
#Squeeze Added
input showsqueeze = no;
def bbupper = reference BollingerBands().UpperBand;
def kcupper = KeltnerChannels().Upper_Band;
def Squeeze = bbupper - kcupper < 0;
plot Squeezeplot = if showsqueeze and Squeeze then POC else Double.NaN;
Squeezeplot.SetDefaultColor(Color.WHITE);
Squeezeplot.SetPaintingStrategy(PaintingStrategy.POINTS);
Squeezeplot.SetLineWeight(3);
Squeezeplot.HideBubble();
#Count of Periods in consecutive squeeze
rec countsq = if Squeeze then countsq[1] + 1 else 0;
rec count1sq = if !Squeeze then count1sq[1] + 1 else 0;
#Expansion Bubbles
input q = 3;
def q1 = q + 1;
AddChartBubble(showsqueeze and !IsNaN(close[q1]) and IsNaN(close[q]), POC[q1] , if Squeeze[q1] then "S " + Round(countsq[q1], 2) else "NS " + count1sq[q1] , if DMI_Oscillator()[q1] < 0 then Color.RED else Color.GREEN, no);
#COLORBARS
input pricecolor = yes;
AssignPriceColor(
if PRICECOLOR then
if dn[1] == 0 and dn == 1 then COLOR.RED else
if up[1] == 0 and up == 1 then COLOR.GREEN else
COLOR.GRAY
else
COLOR.CURRENT
);

#END OF STUDY


