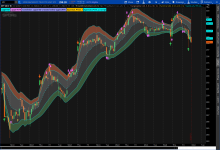
Volatility Box Indicator for ThinkorSwim

Srt4ever

New member
2019 Donor
Anyone seen or heard of this Volatility Box ? can anyone write the code for such indicator ? From the video I've seen this is not just for Futures but can be used for stock an option trading.

Video:

⚠ edited by moderator. Shared media blocked. Contained commercial content prohibited by Forum's terms & guidelines

Edit: Below are some versions of the Volatility Box indicator that our community members put together.
 
Last edited by a moderator:

Volatility Trading Range

VTR is a momentum indicator that shows if a stock is overbought or oversold based on its Weekly and Monthly average volatility trading range.

Download the indicator

horserider

Well-known member
VIP
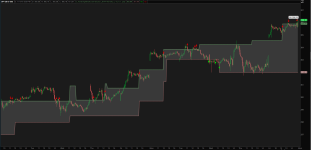
@Srt4ever Here is something I am playing with, might be similar. Who know. It looks like they are playing with deviations from hourly highs and lows. So this is a bit different using the average. I think it can give similar information. Ya'll can take a look and comment.

The idea is the deviations are 1.3 (65%)and 2(98%) of prices. Prices breaking into or above or below these zones (red and Green) are extended and may signal a reversal soon. There is a safe holding zone in light gray for buys and dark gray for sells. Can trade on breaks of 1.3 line or once you are in a move up or down you can hold till safe zones are exited. Threw in some arrows for all the arrow fans.

ofL6ISy.png


Just put it together this evening. Cannot answer your questions. Just was trying to help srt4ever. If there is an interest by people I will list it as a new indicator.
 

Srt4ever

New member
2019 Donor
Looks like you have your own little version of this volatility box going on, hows it working for you and can it be used on multiple time frames ? I’d be interested in giving it ago, seems just like the one I posted about but with your twist on it.
 

Huffmac90

Member
Found the Baseline for the VOL_Box while scanning through some international forums. Just need to translate it to Thinkscript. I've been watching their trading videos though and don't think that their strategy performs well without a lower indicator set. They are producing a Dynamic RSI video set to be released this evening which is kind of similar to the strategy I use but they def missed a key piece again!

Code:
//Cycle

StdDev = std[InpBandsPeriod](close)

highindex = highest[InpBandsPeriod](StdDev)[1]

lowindex = lowest[InpBandsPeriod](StdDev)[1]


if barindex>InpBandsPeriod then

VolDer = (StdDev-highindex)/(highindex-lowindex)

VolSmooth = average[Smooth](VolDer)


if VolSmooth>0 then

VolSmooth = 0

elsif VolSmooth<-1.0 then

VolSmooth = -1.0

endif

endif


//fractals

if high[cp] >= highest[2*cp+1](high) then

LH = 1

else

LH = 0

endif


if low[cp] <= lowest[2*cp+1](low) then

LL = -1

else

LL = 0

endif


if LH = 1 then

TOPy = high[cp]

endif


if LL = -1 then

BOTy = low[cp]

endif


//channel

if VolSmooth = -1.0 then //no volatility

if abs(TOPy-upperchannel)/close>change/100 then

upperchannel = TOPy

endif

if abs(BOTy-lowerchannel)/close>change/100 then

lowerchannel = BOTy

endif

endif


RETURN upperchannel coloured(100,150,100) style(dottedline) as "upper channel", lowerchannel coloured(150,100,100) style(dottedline) as "lower channel"
 

diazlaz

Well-known member
2019 Donor
VIP
The code doesn't seem to be complete (e.g.. vars for InpBandsPeriod, etc as missing). can you post the entire code or a link
 

diazlaz

Well-known member
2019 Donor
VIP
ok - so we took a pass at porting it. please give it a eye and run, if you can find ways to trade it, enhance it, or use it, in return please provide commentary and find some edge ;)

pfsUWIX.png


Ruby:
#TITLE
#PRC_Volatility Cycle Breakout | indicator

#DESCRIPTION
#The Volatility Cycle Breakout indicator draws range boxes overlaid on the price chart.
#The upper and lower side of the boxes are made from recent Fractals.
#New boxes will be drawn only if the volatility is weak and
#if the new fractals discovered are far enough from the current upper and lower ones.
#
#The volatility cycle is extracted from Bollinger Bands (InpBandsPeriod=18 is the bands period).
#Fractals lookback periods can be adapted to catch new fractals far in the history
#or near of the current price (cp=10).
#
#The change variable is the percent variation needed to change the support and resistance
#levels of the boxes (0.1% seems to work fine for intraday timeframes on forex pairs for instance).
#
#This setting is important because it will reduce the noises of moving boxes each
#time new Fractals are discovered, specially when price is ranging. It results
#erfect range boxes on price to play mean reversion strategy when price is not moving enough
#to make real breakout.

#CREDITS
#https://www.prorealcode.com/prorealtime-indicators/volatility-breakout-indicator/
#https://www.prorealcode.com/user/nicolas/

#CHANGELOG
#2019.11.03 @diazlaz Initial Port

declare upper;

#INPUTS
input InpBandsPeriod = 18; #Period
input Smooth = 2; #Smoothness
input cp = 10; #Fractals periods
input change = 0.1; #Percent change to modify the upper/lower channel
input showArrows = no; # price cross channels signals

#LOGIC
def StdDev = StDev(close, InpBandsPeriod);

def highindex = Highest(StdDev, InpBandsPeriod)[1];
def lowindex = Lowest(StdDev, InpBandsPeriod)[1];

def VolDer = (StdDev - highindex) / (highindex - lowindex);
def VolSmooth = Average(VolDer, Smooth);

def VolSmooth1 = if VolSmooth > 0 then 0 else
if VolSmooth < -1.0 then -1.0 else VolSmooth;

def LH = if high[cp] >= Highest(high, (2 * cp + 1)) then 1 else 0;
def LL = if low[cp] <= Lowest(low, (2 * cp + 1)) then -1 else 0;

def TOPy = if LH == 1 then high[cp] else TOPy[1];
def BOTy  = if LL == -1 then low[cp] else BOTy[1];

def upperchannel = if VolSmooth1 == -1.0 then
if AbsValue(TOPy - CompoundValue(1, upperchannel[1], 0)) / close > change / 100
then TOPy else upperchannel[1]
else upperchannel[1];

def lowerchannel  = if VolSmooth1 == -1.0 then
if AbsValue(BOTy - CompoundValue(1, lowerchannel[1], 0)) / close > change / 100
then BOTy else lowerchannel[1]
else lowerchannel[1];

#PLOTS
plot pUpperChannel = upperchannel;
pUpperChannel.SetLineWeight(2);
pUpperChannel.SetDefaultColor(CreateColor(100,150,100));

plot pLowerChannel = lowerchannel;
pLowerChannel.SetLineWeight(2);
pLowerChannel.SetDefaultColor(CreateColor(150,100,100));

#ARROWS
plot pUP = close crosses above lowerchannel;
pUP.SetPaintingStrategy(PaintingStrategy.BOOLEAN_ARROW_UP);
pUP.SetDefaultColor(Color.GREEN);
pUP.SetLineWeight(2);
pUP.SetHiding(!showArrows);

plot pDown = close crosses below upperchannel;
pDown.SetPaintingStrategy(PaintingStrategy.BOOLEAN_ARROW_DOWN);
pDown.SetDefaultColor(Color.RED);
pDown.SetLineWeight(2);
pDown.SetHiding(!showArrows);

#FILLS
AddCloud(pUpperChannel, pLowerChannel,COLOR.GRAY,COLOR.GRAY, yes);

#END OF PRC_Volatility Cycle Breakout | indicator

Any feedback or bugs, please reply.
 

Huffmac90

Member
It definitely is taking shape and is looking like the VBOX! I wonder if another deviation off from the BBand will give you the secondary zone, then a third for the cloud zone?
 

diazlaz

Well-known member
2019 Donor
VIP
It definitely is taking shape and is looking like the VBOX! I wonder if another deviation off from the BBand will give you the secondary zone, then a third for the cloud zone?
can you provide me some examples? to play with the idea, add multiple instances of the same indicator, then once you have some ideas, can expose different shading colors, etc so that you can add as many channels by just adding multiple instances of the same indicator and changing the parameters.
 

Huffmac90

Member
can you provide me some examples? to play with the idea, add multiple instances of the same indicator, then once you have some ideas, can expose different shading colors, etc so that you can add as many channels by just adding multiple instances of the same indicator and changing the parameters.

What if they used something like the above and combined it with mobius' Pivot_Points? Then to get the effect they would connect the Pivots. It is the best example I can give you right now because a double BBand with smoother doesn't make sense.

Code:
# Mobius
# Mobius on My Trade
# High_Low_Pivots(n value below 10) (Swing High Swing Low n value +21)
# V001.06.2012

input n = 3;
input ShowLines = yes;

   def h = high;
   def l = low;
   def bar1 = barNumber();
   def ph;
   def pl;
   def isH = fold i = 1 
             to n +1 
             with p = 1
             while p 
             do h > getValue(h,-i); 
       PH = if (bar1 > n 
            and h == highest(h, n) 
            and isH) 
            then h 
            else double.NaN;
   def isL= fold j = 1 
            to n + 1 
            with q = 1
            while q 
            do l < getValue(low, -j);
       PL = if (bar1 > n 
            and l == lowest(l, n) 
            and isL) 
            then l 
            else double.NaN;
   rec phl = if !isNaN(ph) 
             then PH 
             else phl[1];
   rec pll = if !isNaN(pl) 
             then pl 
             else pll[1];

  plot pivotHigh = Round(ph, 2);
       pivotHigh.setPaintingStrategy(PaintingStrategy.VALUES_ABOVE);

  plot pivotHighLine = if phl > 0 
                       then phl 
                       else double.NaN;
       pivotHighLine.setHiding(!showLines);
       pivotHighLine.SetPaintingStrategy(PaintingStrategy.DASHES);
       pivotHighLine.SetDefaultColor(color.green);

  plot pivotLow = Round(pl, 2);
       pivotLow.setPaintingStrategy(PaintingStrategy.VALUES_BELOW);

  plot pivotLowLine = if pll > 0 
                      then pll 
                      else double.NaN;
       pivotLowLine.setHiding(!showLines);
       pivotLowLine.SetPaintingStrategy(PaintingStrategy.DASHES);
       pivotLowLine.SetDefaultColor(color.red);
#
 
Last edited by a moderator:

Huffmac90

Member
Found it!! I knew I've seen something like the VBOX before.

Code:
#VolumeProfile_IntradaySelection with Expanded Intraday Period Selections plus the Prior Day's Value Areas

input showlines             = yes;

input pricePerRowHeightMode = { AUTOMATIC, default TICKSIZE, CUSTOM};

input customRowHeight       = .01;

input timePerProfile        = {CHART, MINUTE, MIN2, MIN3, MIN4, MIN5, MIN10,  default  MIN15, MIN20,  MIN30, HOUR, TWOHOUR, FOURHOUR, DAY , TWODAY, THREEDAY, FOURDAY, WEEK, MONTH, "OPT EXP", BAR};

input multiplier         = 1;

input onExpansion        = no;

input profiles           = 1000;

input showPointOfControl = yes;

input showValueArea      = yes;

input valueAreaPercent   = 100.0;

input valueAreaPercent2  = 87.5;

input opacity            = 0;


def period;

def agg;

def yyyymmdd   = GetYYYYMMDD();

def seconds    = SecondsFromTime(0);

def month      = GetYear() * 12 + GetMonth();

def day_number = DaysFromDate(First(yyyymmdd)) + GetDayOfWeek(First(yyyymmdd));

def dom        = GetDayOfMonth(yyyymmdd);

def dow        = GetDayOfWeek(yyyymmdd - dom + 1);

def expthismonth = (if dow > 5 then 27 else 20) - dow;

def exp_opt      = month + (dom > expthismonth);

switch (timePerProfile) {

case CHART:

    period = 0;

    agg = AggregationPeriod.DAY;

case MINUTE:

    period = Floor(seconds / 60 + day_number * 24 * 60);

    agg = AggregationPeriod.MIN;

case MIN2:

    period = Floor(seconds / 120 + day_number * 24);

    agg = AggregationPeriod.TWO_MIN;

case MIN3:

    period = Floor(seconds / 180 + day_number * 24);

    agg = AggregationPeriod.THREE_MIN;

case MIN4:

    period = Floor(seconds / 240 + day_number * 24);

    agg = AggregationPeriod.FOUR_MIN;

case MIN5:

    period = Floor(seconds / 300 + day_number * 24);

    agg = AggregationPeriod.FIVE_MIN;

case MIN10:

    period = Floor(seconds / 600 + day_number * 24);

    agg = AggregationPeriod.TEN_MIN;

case MIN15:

    period = Floor(seconds / 900 + day_number * 24);

    agg = AggregationPeriod.FIFTEEN_MIN;

case MIN20:

    period = Floor(seconds / 1200 + day_number * 24);

    agg = AggregationPeriod.TWENTY_MIN;

case MIN30:

    period = Floor(seconds / 1800 + day_number * 24);

    agg = AggregationPeriod.THIRTY_MIN;

case HOUR:

    period = Floor(seconds / 3600 + day_number * 24);

    agg = AggregationPeriod.HOUR;

case TWOHOUR:

    period = Floor(seconds / 7200 + day_number * 24);

    agg = AggregationPeriod.TWO_HOURS;

case FOURHOUR:

    period = Floor(seconds / 14400 + day_number * 24);

    agg = AggregationPeriod.FOUR_HOURS;

case DAY:

    period = CountTradingDays(Min(First(yyyymmdd), yyyymmdd), yyyymmdd) - 1;

    agg = AggregationPeriod.DAY;

case TWODAY:

    period = CountTradingDays(Min(First(yyyymmdd), yyyymmdd), yyyymmdd) - 1;

    agg = AggregationPeriod.TWO_DAYS;

case THREEDAY:

    period = CountTradingDays(Min(First(yyyymmdd), yyyymmdd), yyyymmdd) - 1;

    agg = AggregationPeriod.THREE_DAYS;

case FOURDAY:

    period = CountTradingDays(Min(First(yyyymmdd), yyyymmdd), yyyymmdd) - 1;

    agg = AggregationPeriod.FOUR_DAYS;

case WEEK:

    period = Floor(day_number / 7);

    agg = AggregationPeriod.WEEK;

case MONTH:

    period = Floor(month - First(month));

    agg = AggregationPeriod.MONTH;

case "OPT EXP":

    period = exp_opt - First(exp_opt);

    agg = AggregationPeriod.DAY;

case BAR:

    period = BarNumber() - 1;

    agg = AggregationPeriod.DAY;

}


def count = CompoundValue(1, if period != period[1] then (count[1] + period - period[1]) % (if timePerProfile == timePerProfile.TWODAY then 2 else if timePerProfile == timePerProfile.THREEDAY then 3 else if timePerProfile == timePerProfile.FOURDAY then 4 else multiplier) else count[1], 0);


def cond = count < count[1] + period - period[1];

def height;

switch (pricePerRowHeightMode) {

case AUTOMATIC:

    height = PricePerRow.AUTOMATIC;

case TICKSIZE:

    height = PricePerRow.TICKSIZE;

case CUSTOM:

    height = customRowHeight;

}


profile vol     = VolumeProfile("startNewProfile" = cond, "onExpansion" = onExpansion, "numberOfProfiles" = profiles, "pricePerRow" = height, "value area percent" = valueAreaPercent);

def con         = CompoundValue(1, onExpansion, no);

def pc          = if IsNaN(vol.GetPointOfControl())   and con then pc[1]  else vol.GetPointOfControl();

def hVA         = if IsNaN(vol.GetHighestValueArea()) and con then hVA[1] else vol.GetHighestValueArea();

def lVA         = if IsNaN(vol.GetLowestValueArea())  and con then lVA[1] else vol.GetLowestValueArea();

def hProfile    = if IsNaN(vol.GetHighest()) and con then hProfile[1] else vol.GetHighest();

def lProfile    = if IsNaN(vol.GetLowest())  and con then lProfile[1] else vol.GetLowest();

def plotsDomain = IsNaN(close) == onExpansion or showlines;


plot POC         = if plotsDomain then pc       else Double.NaN;

plot ProfileHigh = if plotsDomain then hProfile else Double.NaN;

plot ProfileLow  = if plotsDomain then lProfile else Double.NaN;

def VAHigh       = if plotsDomain then hVA      else Double.NaN;

def VALow        = if plotsDomain then lVA      else Double.NaN;


DefineGlobalColor("Profile", GetColor(1));

DefineGlobalColor("Point Of Control", Color.CYAN);

DefineGlobalColor("Value Area", GetColor(8));


vol.Show(color = Color.CURRENT, opacity = opacity, "poc color" = Color.CURRENT);

def pc1   = if pc  != pc[1]  then pc[1]  else pc1[1];

def pc2   = if pc1 != pc1[1] then pc1[1] else pc2[1];

rec uppoc = if pc1 > pc      then 1 else if uppoc[1] == 1 and pc1 >= pc then 1 else 0;


POC.AssignValueColor(if uppoc == 1 then Color.RED else Color.GREEN);

POC.SetLineWeight(2);

ProfileHigh.SetStyle(Curve.POINTS);

ProfileLow.SetPaintingStrategy(PaintingStrategy.HORIZONTAL);

ProfileHigh.SetDefaultColor(GetColor(3));

ProfileLow.SetDefaultColor(GetColor(3));

ProfileHigh.Hide();

ProfileLow.Hide();


input showarrows       = no;

input arrowsensitivity = 1;#Hint arrowsensitivity: number of ticks within 95% to create an arrow

def dn = if high >= VAHigh -  TickSize() * arrowsensitivity

         then 1

         else if dn[1] == 1 and high >= VAHigh - TickSize() * arrowsensitivity

         then 1

         else 0;

plot dnarrow = if showarrows and dn[1] == 0 and dn == 1

               then high + .02 

               else Double.NaN;

def up = if low  <= VALow +  TickSize() * arrowsensitivity 

         then 1

         else if up[1] == 1 and low  <= VALow + TickSize() * arrowsensitivity

         then 1

         else 0;

plot uparrow = if showarrows and up[1] == 0 and up == 1

               then low - .02

               else Double.NaN;

dnarrow.SetPaintingStrategy(PaintingStrategy.ARROW_DOWN);

uparrow.SetPaintingStrategy(PaintingStrategy.ARROW_UP);

dnarrow.SetDefaultColor(Color.YELLOW);

uparrow.SetDefaultColor(Color.WHITE);


profile vol1  = VolumeProfile("startNewProfile" = cond, "onExpansion" = onExpansion, "numberOfProfiles" = profiles, "pricePerRow" = height, "value area percent" = valueAreaPercent2);

def hVA1      = if IsNaN(vol1.GetHighestValueArea()) and con then hVA[1] else vol1.GetHighestValueArea();

def lVA1      = if IsNaN(vol1.GetLowestValueArea())  and con then lVA[1] else vol1.GetLowestValueArea();


def upvah1   = if hVA1[1] < hVA1 then 1 else if upvah1[1] == 1 and hVA1[1] <= hVA1 then 1 else 0;

def upval1   = if lVA1[1] < lVA1 then 1 else if upval1[1] == 1 and lVA1[1] <= lVA1 then 1 else 0;

plot VAHigh1 = if plotsDomain then hVA1 else Double.NaN;

plot VALow1  = if plotsDomain then lVA1 else Double.NaN;

VAHigh1.SetStyle(Curve.SHORT_DASH);

VALow1.SetStyle(Curve.SHORT_DASH);

#addcloud(vahigh,vahigh1,color.light_orange, color2 = Color.LIGHT_ORANGE);

#addcloud(valow1,valow,Color.LIGHT_GRAY, color2 = Color.LIGHT_GRAY);


def upvah = if hVA[1] < hVA then 1 else if upvah[1] == 1 and hVA[1] <= hVA then 1 else 0;

def upval = if lVA[1] < lVA then 1 else if upval[1] == 1 and lVA[1] <= lVA then 1 else 0;

def green  = upvah1 == 1 and upval1 == 1;

def red    = upvah1 == 0 and upval1 == 0;

def green1 = if green then 1 else if green1[1] == 1 and !red then 1 else 0;

def green1ext = if IsNaN(close) then green1ext[1] else green1;

def g1ext     = green1ext;

def g1        = green1ext;

def red1      = if red then 1 else if red1[1] == 1 and !green then 1 else 0;

def red1ext   = if IsNaN(close) then red1ext[1] else red1;

def r1ext     = red1ext;

def r1        = red1;


VAHigh1.AssignValueColor(if green1 then Color.GREEN else Color.RED);

VALow1.AssignValueColor (if green1 then Color.GREEN else Color.RED);

plot vahplot = VAHigh;

vahplot.AssignValueColor(if green1 then Color.GREEN else Color.RED);

plot valplot = VALow;

valplot.AssignValueColor(if green1 then Color.GREEN else Color.RED);

def   vahext = if IsNaN(close) then vahext[1] else VAHigh;

plot vahextp = vahext;

vahextp.AssignValueColor(if green1ext then Color.GREEN else Color.RED);

def   valext = if IsNaN(close) then valext[1] else VALow;

plot valextp = valext;

valextp.AssignValueColor(if green1ext then Color.GREEN else Color.RED);

def   vah1ext = if IsNaN(close) then vah1ext[1] else VAHigh1;

plot vah1extp = vah1ext;

vah1extp.AssignValueColor(if green1ext then Color.GREEN else Color.RED);

def   val1ext = if IsNaN(close) then val1ext[1] else VALow1;

plot val1extp = val1ext;

val1extp.AssignValueColor(if green1ext then Color.GREEN else Color.RED);


input showclouds = no;

AddCloud(if showclouds and g1ext then vahextp  else Double.NaN, vah1extp, Color.DARK_GREEN, Color.DARK_GREEN);

AddCloud(if showclouds and g1ext then val1extp else Double.NaN, valextp,  Color.DARK_GREEN, Color.DARK_GREEN);

AddCloud(if showclouds and r1ext then vahextp  else Double.NaN, vah1extp, Color.DARK_RED, Color.DARK_RED);

AddCloud(if showclouds and r1ext then val1extp else Double.NaN, valextp,  Color.DARK_RED, Color.DARK_RED);


input pricecolor = no;

AssignPriceColor(if pricecolor 

                 then if !green 

                      then Color.RED

                      else Color.GREEN

                 else Color.CURRENT);


POC.HideBubble();

VAHigh1.HideBubble();

VALow1.HideBubble();

vahplot.HideBubble();

valplot.HideBubble();

uparrow.HideBubble();

dnarrow.HideBubble();

vahextp.HideBubble();

vah1extp.HideBubble();

valextp.HideBubble();

val1extp.HideBubble();


input showbubbleperperiod = no;

input bubblemoverperperiodhorizontal = 10;

input bubblemoverperperiodvertical  = 2;

def bubble = if period[1] != period then BarNumber() + bubblemoverperperiodhorizontal else bubble[1];


AddChartBubble(showbubbleperperiod and BarNumber() == (bubble), Max(high, VAHigh) + bubblemoverperperiodvertical * TickSize(), (VAHigh - VALow) + "\n" + (VAHigh1 - VALow1) , if green then Color.GREEN else if red then Color.RED else Color.GRAY, yes);


input showcurrentperiodbubble = no;

input x = 8;

def x1  = x + 1;

AddChartBubble(showcurrentperiodbubble and !IsNaN(close[x1]) and IsNaN(close[x]), close[x1], (VAHigh[x1] - VALow[x1]) + " :\n" + volume(period = agg), if green[x1] then Color.GREEN else if red[x1] then Color.RED else Color.GRAY);


input n = 5;

def n1  = n + 1;

input showbubblesVAvalues = no;

AddChartBubble(showbubblesVAvalues and !IsNaN(close[n1]) and IsNaN(close[n]), Round(POC[n1], 2) , "POC: " + Round(POC[n1], 2), if uppoc[n1] == 1 then Color.RED else Color.GREEN, yes);

AddChartBubble(showbubblesVAvalues and !IsNaN(close[n1]) and IsNaN(close[n]), Round(VALow1[n1], 2) , "VL:   " + Round(VALow1[n1], 2), if upval[n1] == 1 then Color.RED else Color.GREEN, yes);

AddChartBubble(showbubblesVAvalues and !IsNaN(close[n1]) and IsNaN(close[n]), Round(VALow[n1], 2) , "VL1: " + Round(VALow[n1], 2), if upval1[n1] == 1 then Color.RED else Color.GREEN, yes);

AddChartBubble(showbubblesVAvalues and !IsNaN(close[n1]) and IsNaN(close[n]), Round(VAHigh1[n1], 2) , "VH:   " + Round(VAHigh1[n1], 2), if upvah1[n1] == 1 then Color.RED else Color.GREEN, yes);

AddChartBubble(showbubblesVAvalues and !IsNaN(close[n1]) and IsNaN(close[n]), Round(VAHigh[n1], 2) , "VH1: " + Round(VAHigh[n1], 2), if upvah[n1] == 1 then Color.RED else Color.GREEN, yes);


#Squeeze Added 

input showsqueeze = no;

def bbupper       = reference BollingerBands().UpperBand;

def kcupper       = KeltnerChannels().Upper_Band;

def Squeeze       = bbupper - kcupper < 0;

plot Squeezeplot  = if showsqueeze and Squeeze then POC else Double.NaN;

Squeezeplot.SetDefaultColor(Color.WHITE);

Squeezeplot.SetPaintingStrategy(PaintingStrategy.POINTS);

Squeezeplot.SetLineWeight(3);

Squeezeplot.HideBubble();


#Count of Periods in consecutive squeeze

rec countsq  = if Squeeze  then countsq[1] + 1  else 0;

rec count1sq = if !Squeeze then count1sq[1] + 1 else 0;


#Expansion Bubbles

input q = 3;

def q1  = q + 1;


AddChartBubble(showsqueeze and !IsNaN(close[q1]) and IsNaN(close[q]), POC[q1] , if Squeeze[q1] then "S " + Round(countsq[q1], 2) else "NS " + count1sq[q1] , if DMI_Oscillator()[q1] < 0 then Color.RED else Color.GREEN, no);

https://onedrive.live.com/redir?res...lus th|41f44a85-ec27-4d87-8bed-8d572de0a190/)
 
Last edited by a moderator:

diazlaz

Well-known member
2019 Donor
VIP

Huffmac90

Member
Hi @Huffmac90 are you referring to the VBOX indicators or top and bottom candle?

Please post a screenshot and will see if we can help solve.

I solved the painter issue and got the VBOX script to function. The issue is I would like to merge the VBOX candle painting script with this single candle top bottom callout portion. I'll post a picture soon, still messing with it. This has the possibility to be really powerful!
 

New Indicator: Buy the Dip

Check out our Buy the Dip indicator and see how it can help you find profitable swing trading ideas. Scanner, watchlist columns, and add-ons are included.

Download the indicator

Similar threads

Not the exact question you're looking for?

Start a new thread and receive assistance from our community.

87k+ Posts
121 Online
Create Post

Similar threads

Similar threads

The Market Trading Game Changer

Join 2,500+ subscribers inside the useThinkScript VIP Membership Club
  • Exclusive indicators
  • Proven strategies & setups
  • Private Discord community
  • ‘Buy The Dip’ signal alerts
  • Exclusive members-only content
  • Add-ons and resources
  • 1 full year of unlimited support

Frequently Asked Questions

What is useThinkScript?

useThinkScript is the #1 community of stock market investors using indicators and other tools to power their trading strategies. Traders of all skill levels use our forums to learn about scripting and indicators, help each other, and discover new ways to gain an edge in the markets.

How do I get started?

We get it. Our forum can be intimidating, if not overwhelming. With thousands of topics, tens of thousands of posts, our community has created an incredibly deep knowledge base for stock traders. No one can ever exhaust every resource provided on our site.

If you are new, or just looking for guidance, here are some helpful links to get you started.

What are the benefits of VIP Membership?
VIP members get exclusive access to these proven and tested premium indicators: Buy the Dip, Advanced Market Moves 2.0, Take Profit, and Volatility Trading Range. In addition, VIP members get access to over 50 VIP-only custom indicators, add-ons, and strategies, private VIP-only forums, private Discord channel to discuss trades and strategies in real-time, customer support, trade alerts, and much more. Learn all about VIP membership here.
How can I access the premium indicators?
To access the premium indicators, which are plug and play ready, sign up for VIP membership here.
Top