
This thread is locked. For the most up-to-date information abut the Trend Reversal Indicator:This thread is still available for reading.To navigate this thread, here is a great hack for searching many-paged threads.
Someone shared this indicator via a thread on Futures forum. I don't know the original name so I called it the reversal indicator. It uses moving averages, ZigZag pattern, and Fibonacci to generate reversal signals on your chart.
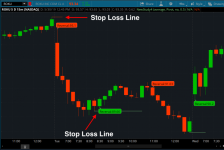
One thing to note is that this indicator will repaint. The Buy and Sell signal will disappear if the candlestick closed above or below the stop loss line. You can use that as a trigger point to cut losses early if that happens.
- Green = Buy Signal Bars
- Purple = Neutral
- Red = Sell Signal Bars
thinkScript Code
Rich (BB code):
def price = close;
def superfast_length = 9;
def fast_length = 14;
def slow_length = 21;
def displace = 0;

def mov_avg9 = ExpAverage(price[-displace], superfast_length);
def mov_avg14 = ExpAverage(price[-displace], fast_length);
def mov_avg21 = ExpAverage(price[-displace], slow_length);

#moving averages
def Superfast = mov_avg9;
def Fast = mov_avg14;
def Slow = mov_avg21;

def buy = mov_avg9 > mov_avg14 and mov_avg14 > mov_avg21 and low > mov_avg9;
def stopbuy = mov_avg9 <= mov_avg14;
def buynow = !buy[1] and buy;
def buysignal = CompoundValue(1, if buynow and !stopbuy then 1 else if buysignal[1] == 1 and stopbuy then 0 else buysignal[1], 0);

def Buy_Signal = buysignal[1] == 0 and buysignal == 1;

#Alert(condition = buysignal[1] == 0 and buysignal == 1, text = "Buy Signal", sound = Sound.Bell, "alert type" = Alert.BAR);

def Momentum_Down = buysignal[1] == 1 and buysignal == 0;

#Alert(condition = buysignal[1] == 1 and buysignal == 0, text = "Momentum_Down", sound = Sound.Bell, "alert type" = Alert.BAR);

def sell = mov_avg9 < mov_avg14 and mov_avg14 < mov_avg21 and high < mov_avg9;
def stopsell = mov_avg9 >= mov_avg14;
def sellnow = !sell[1] and sell;
def sellsignal = CompoundValue(1, if sellnow and !stopsell then 1 else if sellsignal[1] == 1 and stopsell then 0 else sellsignal[1], 0);

def Sell_Signal = sellsignal[1] == 0 and sellsignal;

#Alert(condition = sellsignal[1] == 0 and sellsignal == 1, text = "Sell Signal", sound = Sound.Bell, "alert type" = Alert.BAR);

def Momentum_Up = sellsignal[1] == 1 and sellsignal == 0;

#Alert(condition = sellsignal[1] == 1 and sellSignal == 0, text = "Momentum_Up", sound = Sound.Bell, "alert type" = Alert.BAR);

plot Colorbars = if buysignal == 1 then 1 else if sellsignal == 1 then 2 else if buysignal == 0 or sellsignal == 0 then 3 else 0;
Colorbars.Hide();
Colorbars.DefineColor("Buy_Signal_Bars", Color.GREEN);
Colorbars.DefineColor("Sell_Signal_Bars", Color.RED);
Colorbars.DefineColor("Neutral", Color.PLUM);
#___________________________________________________________________________

input method = {default average, high_low};
def bubbleoffset = .0005;
def percentamount = .01;
def revAmount = .05;
def atrreversal = 2.0;
def atrlength = 5;
def pricehigh = high;
def pricelow = low;
def averagelength = 5;
def averagetype = AverageType.EXPONENTIAL;
def mah = MovingAverage(averagetype, pricehigh, averagelength);
def mal = MovingAverage(averagetype, pricelow, averagelength);
def priceh = if method == method.high_low then pricehigh else mah;
def pricel = if method == method.high_low then pricelow else mal;
def EI = ZigZagHighLow("price h" = priceh, "price l" = pricel, "percentage reversal" = percentamount, "absolute reversal" = revAmount, "atr length" = atrlength, "atr reversal" = atrreversal);
def reversalAmount = if (close * percentamount / 100) > Max(revAmount < atrreversal * reference ATR(atrlength), revAmount) then (close * percentamount / 100) else if revAmount < atrreversal * reference ATR(atrlength) then atrreversal * reference ATR(atrlength) else revAmount;
rec EISave = if !IsNaN(EI) then EI else GetValue(EISave, 1);
def chg = (if EISave == priceh then priceh else pricel) - GetValue(EISave, 1);
def isUp = chg >= 0;
rec isConf = AbsValue(chg) >= reversalAmount or (IsNaN(GetValue(EI, 1)) and GetValue(isConf, 1));
def EId = if isUp then 1 else 0;
#plot EnhancedLines = if EId <= 1 then EI else Double.NaN;
#EnhancedLines.AssignValueColor(if EId == 1 then Color.GREEN else if EId == 0 then Color.RED else Color.DARK_ORANGE);
#EnhancedLines.SetStyle(Curve.FIRM);
#EnhancedLines.EnableApproximation();
#EnhancedLines.HideBubble();
#Price Change between Enhanceds
def xxhigh = if EISave == priceh then priceh else xxhigh[1];
def chghigh = priceh - xxhigh[1];
def xxlow = if EISave == pricel then pricel else xxlow[1];
def chglow = pricel - xxlow[1];
def showBubbleschange = no;
AddChartBubble(showBubbleschange and !IsNaN(EI) and BarNumber() != 1, if isUp then priceh * (1 + bubbleoffset) else pricel * (1 - bubbleoffset) , "$" + chg , if isUp and chghigh > 0 then Color.GREEN else if isUp and chghigh < 0 then Color.RED else if isUp then Color.YELLOW else if !isUp and chglow > 0 then Color.GREEN else if !isUp and chglow < 0 then Color.RED else Color.YELLOW, isUp);
#Price at High/Low
def showBubblesprice = no;
AddChartBubble(showBubblesprice and !IsNaN(EI) and BarNumber() != 1, if isUp then priceh * (1 + bubbleoffset) else pricel * (1 - bubbleoffset) , if isUp then "$" + priceh else "$" + pricel , if isUp and chghigh > 0 then Color.GREEN else if isUp and chghigh < 0 then Color.RED else if isUp then Color.YELLOW else if !isUp and chglow > 0 then Color.GREEN else if !isUp and chglow < 0 then Color.RED else Color.YELLOW, isUp);
#Label for Confirmed/Unconfirmed Status of Current Enhanced

#Bar Count between Enhanceds
rec EIcount = if EISave[1] != EISave then 1 else if EISave[1] == EISave then EIcount[1] + 1 else 0;
def EIcounthilo = if EIcounthilo[1] == 0 and (EISave == priceh or EISave == pricel) then 1 else if EISave == priceh or EISave == pricel then EIcounthilo[1] + 1 else EIcounthilo[1];
def EIhilo = if EISave == priceh or EISave == pricel then EIcounthilo else EIcounthilo + 1;
def EIcounthigh = if EISave == priceh then EIcount[1] else Double.NaN;
def EIcountlow = if EISave == pricel then EIcount[1] else Double.NaN;
def showBubblesbarcount = no;
AddChartBubble(showBubblesbarcount and !IsNaN(EI) and BarNumber() != 1, if isUp then priceh * (1 + bubbleoffset) else pricel * (1 - bubbleoffset) , if EISave == priceh then EIcounthigh else EIcountlow, if isUp and chghigh > 0 then Color.GREEN else if isUp and chghigh < 0 then Color.RED else if isUp then Color.YELLOW else if !isUp and chglow > 0 then Color.GREEN else if !isUp and chglow < 0 then Color.RED else Color.YELLOW, if isUp then yes else no );
#Arrows
def EIL = if !IsNaN(EI) and !isUp then pricel else GetValue(EIL, 1);
def EIH = if !IsNaN(EI) and isUp then priceh else GetValue(EIH, 1);
def dir = CompoundValue(1, if EIL != EIL[1] or pricel == EIL[1] and pricel == EISave then 1 else if EIH != EIH[1] or priceh == EIH[1] and priceh == EISave then -1 else dir[1], 0);
def signal = CompoundValue(1, if dir > 0 and pricel > EIL then if signal[1] <= 0 then 1 else signal[1] else if dir < 0 and priceh < EIH then if signal[1] >= 0 then -1 else signal[1] else signal[1], 0);
def showarrows = yes;
def U1 = showarrows and signal > 0 and signal[1] <= 0;
#U1.SetPaintingStrategy(PaintingStrategy.BOOLEAN_ARROW_UP);
#U1.SetDefaultColor(Color.GREEN);
#U1.SetLineWeight(4);
def D1 = showarrows and signal < 0 and signal[1] >= 0;
#D1.SetPaintingStrategy(PaintingStrategy.BOOLEAN_ARROW_DOWN);
#D1.SetDefaultColor(Color.RED);
#D1.SetLineWeight(4);
def barnumber = BarNumber()[10];

AddChartBubble((barnumber and U1), if isUp then low else high, if showarrows and signal > 0 and signal[1] <= 0 then "Reversal:" + low else "" , if Colorbars == 3 then Color.PLUM else Color.UPTICK, no);
AddChartBubble((barnumber and D1), if isUp then low else high, if showarrows and signal < 0 and signal[1] >= 0 then "Reversal:" + high else "" , if Colorbars == 3 then Color.PLUM else Color.DOWNTICK, yes);

def revLineTop;
def revLineBot;

if barnumber and D1 {
revLineBot = Double.NaN;
revLineTop = high[1];
} else if barnumber and U1 {
revLineTop = Double.NaN;
revLineBot = low[1];
} else if !IsNaN(revLineBot[1]) and (Colorbars[2] == 2 or Colorbars[1] == 2) {
revLineBot = revLineBot[1];
revLineTop = Double.NaN;
} else if !IsNaN(revLineTop[1]) and (Colorbars[2] == 1 or Colorbars[1] == 1) {
revLineTop = revLineTop[1];
revLineBot = Double.NaN;
} else {
revLineTop = Double.NaN;
revLineBot = Double.NaN;
}

plot botLine = revLineBot[-1];
botLine.SetDefaultColor(Color.LIGHT_GREEN);
plot topLine = revLineTop[-1];
topLine.SetDefaultColor(Color.LIGHT_RED);

#Alerts
def usealerts = no;
#Alert(usealerts and U1, "EI-UP", Alert.BAR, Sound.Bell);
#Alert(usealerts and D1, "EI-DOWN", Alert.BAR, Sound.Chimes);
#Supply Demand Areas
rec data1 = CompoundValue(1, if (EISave == priceh or EISave == pricel) then data1[1] + 1 else data1[1], 0);
def datacount1 = (HighestAll(data1) - data1[1]);
def numbersuppdemandtoshow = 0;
input showSupplyDemand = {default Pivot, Arrow, None};
def idx = if showSupplyDemand == showSupplyDemand.Pivot then 1 else 0;
def rLow;
def rHigh;
if signal crosses 0 {
rLow = pricel[idx];
rHigh = priceh[idx];
} else {
rLow = rLow[1];
rHigh = rHigh[1];
}
def HighLine = if datacount1 <= numbersuppdemandtoshow and showSupplyDemand != showSupplyDemand.None and !IsNaN(close) and rHigh != 0 then rHigh else Double.NaN;

def LowLine = if datacount1 <= numbersuppdemandtoshow and showSupplyDemand != showSupplyDemand.None and !IsNaN(close) and rLow != 0 then rLow else Double.NaN;

def hlUp = if signal > 0 then HighLine else Double.NaN;
def hlDn = if signal < 0 then HighLine else Double.NaN;

def showsupplydemandcloud = no;
AddCloud(if showsupplydemandcloud then hlUp else Double.NaN, LowLine, Color.LIGHT_GREEN, Color.LIGHT_GREEN);
AddCloud(if showsupplydemandcloud then hlDn else Double.NaN, LowLine, Color.LIGHT_RED, Color.LIGHT_RED);
#Store Previous Data
def EIsave1 = if !IsNaN(EISave) then EISave else EIsave1[1];
def EIsave2 = EIsave1;
rec priorEI1 = if EIsave2 != EIsave2[1] then EIsave2[1] else priorEI1[1];
rec priorEI2 = if priorEI1 != priorEI1[1] then priorEI1[1] else priorEI2[1];
rec priorEI3 = if priorEI2 != priorEI2[1] then priorEI2[1] else priorEI3[1];
#Fibonacci Extensions
rec data = CompoundValue(1, if (EISave == priceh or EISave == pricel) then data[1] + 1 else data[1], 0);
def datacount = (HighestAll(data) - data[1]);
def numberextfibstoshow = 2;
rec cpo = if dir[1] != dir then 0 else 1;
def showFibExtLines = no;
def showtodayonly = no;
def today = if showtodayonly == yes then GetDay() == GetLastDay() else GetDay();
def extfib1 = if EISave == priceh then priceh - AbsValue(priorEI2 - priorEI1) * 1
else extfib1[1];
def extfib100 = if datacount <= numberextfibstoshow and today and showFibExtLines and !IsNaN(extfib1) and dir < 0 and cpo != 0 then extfib1[1] else Double.NaN;

def extfib1a = if EISave == priceh then priceh - AbsValue(priorEI2 - priorEI1) * 0.382
else extfib1a[1];
def extfib382 = if datacount <= numberextfibstoshow and today and showFibExtLines and !IsNaN(extfib1a) and dir < 0 and cpo != 0 then extfib1a[1] else Double.NaN;

def extfib2 = if EISave == priceh then priceh - AbsValue(priorEI2 - priorEI1) *
0.618 else extfib2[1];
def extfib618 = if datacount <= numberextfibstoshow and today and showFibExtLines and !IsNaN(extfib2) and dir < 0 and cpo != 0 then extfib2[1] else Double.NaN;

def extfib3 = if EISave == priceh then priceh - AbsValue(priorEI2 - priorEI1) *
1.618 else extfib3[1];
def extfib1618 = if datacount <= numberextfibstoshow and today and showFibExtLines and !IsNaN(extfib3) and dir < 0 and cpo != 0 then extfib3[1] else Double.NaN;

def extfib3a = if EISave == priceh then priceh - AbsValue(priorEI2 - priorEI1) *
2.000 else extfib3a[1];
def extfib2000 = if datacount <= numberextfibstoshow and today and showFibExtLines and !IsNaN(extfib3a) and dir < 0 and cpo != 0 then extfib3a[1] else Double.NaN;

def extfib4 = if EISave == priceh then priceh - AbsValue(priorEI2 - priorEI1) *
2.618 else extfib4[1];
def extfib2618 = if datacount <= numberextfibstoshow and today and showFibExtLines and !IsNaN(extfib4) and dir < 0 and cpo != 0 then extfib4[1] else Double.NaN;

def extfib5 = if EISave == priceh then priceh - AbsValue(priorEI2 - priorEI1) *
3.618 else extfib5[1];
def extfib3618 = if datacount <= numberextfibstoshow and today and showFibExtLines and !IsNaN(extfib5) and dir < 0 and cpo != 0 then extfib5[1] else Double.NaN;

def extfib1_ = if EISave == pricel then pricel + AbsValue(priorEI2 - priorEI1) * 1
else extfib1_[1];
def extfib100_ = if datacount <= numberextfibstoshow and today and showFibExtLines and !IsNaN(extfib1_) and dir > 0 and cpo != 0 then extfib1_[1] else Double.NaN;

def extfib1a_ = if EISave == pricel then pricel + AbsValue(priorEI2 - priorEI1) * 0.382
else extfib1a_[1];
def extfib382_ = if datacount <= numberextfibstoshow and today and showFibExtLines and !IsNaN(extfib1a_) and dir > 0 and cpo != 0 then extfib1a_[1] else Double.NaN;

def extfib2_ = if EISave == pricel then pricel + AbsValue(priorEI2 - priorEI1) *
0.618 else extfib2_[1];
def extfib618_ = if datacount <= numberextfibstoshow and today and showFibExtLines and !IsNaN(extfib2_) and dir > 0 and cpo != 0 then extfib2_[1] else Double.NaN;

def extfib3_ = if EISave == pricel then pricel + AbsValue(priorEI2 - priorEI1) *
1.618 else extfib3_[1];
def extfib1618_ = if datacount <= numberextfibstoshow and today and showFibExtLines and !IsNaN(extfib3_) and dir > 0 and cpo != 0 then extfib3_[1] else Double.NaN;

def extfib3a_ = if EISave == pricel then pricel + AbsValue(priorEI2 - priorEI1) *
2.000 else extfib3a_[1];
def extfib2000_ = if datacount <= numberextfibstoshow and today and showFibExtLines and !IsNaN(extfib3a_) and dir > 0 and cpo != 0 then extfib3a_[1] else Double.NaN;

def extfib4_ = if EISave == pricel then pricel + AbsValue(priorEI2 - priorEI1) *
2.618 else extfib4_[1];
def extfib2618_ = if datacount <= numberextfibstoshow and today and showFibExtLines and !IsNaN(extfib4_) and dir > 0 and cpo != 0 then extfib4_[1] else Double.NaN;

def extfib5_ = if EISave == pricel then pricel + AbsValue(priorEI2 - priorEI1) *
3.618 else extfib5_[1];
def extfib3618_ = if datacount <= numberextfibstoshow and today and showFibExtLines and !IsNaN(extfib5_) and dir > 0 and cpo != 0 then extfib5_[1] else Double.NaN;

def fibextbubblespacesinexpansion = 8;
def b = fibextbubblespacesinexpansion;
def direction = if !isUp then 1 else 0;
AddChartBubble( direction[b + 1] == 1 and showFibExtLines and !IsNaN(close[b + 1]) and IsNaN(close), extfib1[b + 2], "100%", Color.RED, no);
AddChartBubble( direction[b + 1] == 1 and showFibExtLines and !IsNaN(close[b + 1]) and IsNaN(close), extfib1a[b + 2], "38.2%", Color.RED, no);
AddChartBubble( direction[b + 1] == 1 and showFibExtLines and !IsNaN(close[b + 1]) and IsNaN(close), extfib2[b + 2], "61.8%", Color.RED, no);
AddChartBubble( direction[b + 1] == 1 and showFibExtLines and !IsNaN(close[b + 1]) and IsNaN(close), extfib3[b + 2], "161.8%", Color.RED, no);
AddChartBubble( direction[b + 1] == 1 and showFibExtLines and !IsNaN(close[b + 1]) and IsNaN(close), extfib3a[b + 2], "200%", Color.RED, no);
AddChartBubble( direction[b + 1] == 1 and showFibExtLines and !IsNaN(close[b + 1]) and IsNaN(close), extfib4[b + 2], "261.8%", Color.RED, no);
AddChartBubble( direction[b + 1] == 1 and showFibExtLines and !IsNaN(close[b + 1]) and IsNaN(close), extfib5[b + 2], "361.8%", Color.RED, no);
AddChartBubble( direction[b + 1] == 0 and showFibExtLines and !IsNaN(close[b + 1]) and IsNaN(close), extfib1_[b + 2], "100%", Color.GREEN, yes);
AddChartBubble( direction[b + 1] == 0 and showFibExtLines and !IsNaN(close[b + 1]) and IsNaN(close), extfib1a_[b + 2], "38.2%", Color.GREEN, yes);
AddChartBubble( direction[b + 1] == 0 and showFibExtLines and !IsNaN(close[b + 1]) and IsNaN(close), extfib2_[b + 2], "61.8%", Color.GREEN, yes);
AddChartBubble( direction[b + 1] == 0 and showFibExtLines and !IsNaN(close[b + 1]) and IsNaN(close), extfib3_[b + 2], "161.8%", Color.GREEN, yes);
AddChartBubble( direction[b + 1] == 0 and showFibExtLines and !IsNaN(close[b + 1]) and IsNaN(close), extfib3a_[b + 2], "200%", Color.GREEN, yes);
AddChartBubble( direction[b + 1] == 0 and showFibExtLines and !IsNaN(close[b + 1]) and IsNaN(close), extfib4_[b + 2], "261.8%", Color.GREEN, yes);
AddChartBubble( direction[b + 1] == 0 and showFibExtLines and !IsNaN(close[b + 1]) and IsNaN(close), extfib5_[b + 2], "361.8%", Color.GREEN, yes);
#Volume at Reversals
def vol = if BarNumber() == 0 then 0 else volume + vol[1];
def vol1 = if BarNumber() == 1 then volume else vol1[1];
def xxvol = if EISave == priceh or EISave == pricel then TotalSum(volume) else xxvol[1];
def chgvol = if xxvol - xxvol[1] + vol1 == vol then vol else xxvol - xxvol[1];
def showBubblesVolume = no;
AddChartBubble(showBubblesVolume and !IsNaN(EI) and BarNumber() != 1, if isUp then priceh * (1 + bubbleoffset) else pricel * (1 - bubbleoffset), chgvol, if isUp and chghigh > 0 then Color.GREEN else if isUp and chghigh < 0 then Color.RED else if isUp then Color.YELLOW else if !isUp and chglow > 0 then Color.GREEN else if !isUp and chglow < 0 then Color.RED else Color.YELLOW, if isUp then yes else no );

input usemanualfibskip = no;#Hint usemanualfibskip: Select no to use preprogrammed fibskip amounts. Select no, to use the amount entered at input fibskip.
input fibskip = .50;#Hint fibskip: Set input usemanualfibskip == yes to use this amount versus preprogrammed amounts. Standard is 1.0. This is percentage difference between fib high and low before a new fib grid created.
def showBubblesfibratio = no;
def showFibLabel = no;#Hint showfibLabel: Select yes to show label of current fib level as of last price
def showfiblines = no;
def fib1level = .236;
def fib2level = .382;
def fibMlevel = .500;
def fib3level = .618;
def fib4level = .786;
#Fibs
def datacount2 = (HighestAll(data1) - data1[1]);
def numberfibretracementstoshow = 2;
def fibskipit = if usemanualfibskip == no then if close > 800 then .25 else .5 else fibskip;
def EIfibh = if EISave == priceh and AbsValue(EISave - EISave[1]) > priceh * fibskipit * .01 then priceh else EIfibh[1];
def EIfibl = if EISave == pricel and AbsValue(EISave - EISave[1]) > priceh * fibskipit * .01 then pricel else EIfibl[1];
def range = EIfibh - EIfibl;
def fibH = if showfiblines == no then Double.NaN else if datacount2 <= numberfibretracementstoshow then EIfibh else Double.NaN;
def fibL = if showfiblines == no then Double.NaN else if datacount2 <= numberfibretracementstoshow then EIfibl else Double.NaN;
def fibM = if showfiblines == no then Double.NaN else if datacount2 <= numberfibretracementstoshow then EIfibl + range * fibMlevel else Double.NaN;
def fib1 = if showfiblines == no then Double.NaN else if datacount2 <= numberfibretracementstoshow then EIfibl + range * fib1level else Double.NaN;
def fib2 = if showfiblines == no then Double.NaN else if datacount2 <= numberfibretracementstoshow then EIfibl + range * fib2level else Double.NaN;
def fib3 = if showfiblines == no then Double.NaN else if datacount2 <= numberfibretracementstoshow then EIfibl + range * fib3level else Double.NaN;
def fib4 = if showfiblines == no then Double.NaN else if datacount2 <= numberfibretracementstoshow then EIfibl + range * fib4level else Double.NaN;

AddLabel(showFibLabel, Concat( "Current Fib Level ", AsPercent((close - EIfibl) / (range))), if close > EIfibl then Color.GREEN else if EIfibh == close then Color.WHITE else Color.RED);

AddChartBubble(showBubblesfibratio and !IsNaN(EI) and BarNumber() != 1, if isUp then priceh * (1 + bubbleoffset) else pricel * (1 - bubbleoffset) , if isUp then AsPercent((priceh - EIfibl) / (range)) else AsPercent((pricel - EIfibl) / range), if isUp and chghigh > 0 then Color.GREEN else if isUp and chghigh < 0 then Color.RED else if isUp then Color.GREEN else if !isUp and chglow > 0 then Color.GREEN else if !isUp and chglow < 0 then Color.RED else Color.RED, isUp);
Shareable Link
https://tos.mx/aGoeQ4Credit:
- SkinnyFry
- Bayside of Enhanced Investor
Scanner
If you would like to scan for new signals, be it on the daily, hourly, or 15m chart, here is the scanner for it. Made by @theelderwandThe Enhanced Version
Added some additional features to the default script above. You can check out the enhanced trend reversal indicator here.Video Tutorial
Attachments
Last edited by a moderator:

