Trend Trader Buy/Sell Signals For ThinkOrSwim

DigitsM

New member
VIP
The code in this thread is for the upper chart indicator.
The author states: The signals look for the MACD cross that occurs when the ADX is above a customizable threshold. Additionally, the MA ribbon is used for visualizing trend and provides dynamic support/resistance. Candle colors change in relation to where price is according to the 50-day MA.

The OP states:
I found this upper chart indicator very useful. It gives a buy/sell signal that has worked very well for me when used together with the lower chart indicator: Bull v Bears: https://usethinkscript.com/threads/bulls-v-bears-for-thinkorswim.18277/

RpTLCOI.png


Hello,
I would really love if someone capable @BenTen @horserider @BonBon @MerryDay and other coders help in converting this script from tradingview to ToS.
I would prefer to have it in ToS so I can create a scan from it.
https://www.tradingview.com/script/dCdvOJy7-Trend-Trader-Buy-Sell-Signals/
 
Last edited by a moderator:
Hello,
I would really love if someone capable @BenTen @horserider @BonBon @MerryDay and other coders help in converting this script from tradingview to ToS. I found it very useful and would prefer to have it in ToS so I can create a scan from it.

It is a free script in TradingView created by UnknownUnicorn1946597. It gives a buy/sell signal that has worked very well for me.

View attachment 21398

Release Notes
Dec 15, 2020
Trend Trader

The code is open source, what it uses to print signals is MACD cross and ADX. Bar colors change in relation to where price is according to the 50 day MA. The MA ribbon is used for visualizing trend and using it for dynamic support/resistance. The ribbon is comprised of the 50 day and 100 day MAs.

Main reason to publish this script is because some like to jumble up scripts together slap some moving averages on it to "follow trend" and then label it an algorithm, market it and sell it to people online. No single system will work 100% of the time, do you due diligence in anything you are interested in buying. Plenty of free scripts in the TV library that can do you justice when trading.
Dec 30, 2020
Release Notes:
Logic calculation change


Code:
++++++++
///version=4
study("Trend Trader", shorttitle = "TT", overlay = true)
// Inputs
showBuySell = input(defval = true, title="Show Buy/Sell Labels")
//
// Logic ///
fast_length = 12
slow_length = 26
src = close
signal_length = 9
// adx inputs
adxlen = 14
dilen = 14
dirmov(len) =>
up = change(close)
down = -change(close)
plusDM = na(up) ? na : (up > down and up > 0 ? up : 0)
minusDM = na(down) ? na : (down > up and down > 0 ? down : 0)
truerange = rma(tr, len)
plus = fixnan(100 * rma(plusDM, len) / truerange)
minus = fixnan(100 * rma(minusDM, len) / truerange)
[plus, minus]
adx(dilen, adxlen) =>
[plus, minus] = dirmov(dilen)
sum = plus + minus
adx = 100 * rma(abs(plus - minus) / (sum == 0 ? 1 : sum), adxlen)
sig = adx(dilen, adxlen)

// Plot colors
col_grow_above = #26A69A
col_grow_below = #FFCDD2
col_fall_above = #B2DFDB
col_fall_below = #EF5350
col_macd = #0094ff
col_signal = #ff6a00

// Calculating
fast_ma = ema(src, fast_length)
slow_ma = ema(src, slow_length)
macd = fast_ma - slow_ma
signal = ema(macd, signal_length)
hist = macd - signal

// Check adx
macd_crossup=macd < 0 and crossover(macd, signal)
macd_crossdown=macd > 0 and crossover(signal, macd)
bullish = sig > 25 and macd_crossup
bearish = sig > 25 and macd_crossdown
plotshape(bullish and showBuySell, title="Buy", text="Buy", color=#00FF00, style=shape.labelup, location=location.belowbar, size=size.small, textcolor=#000000, transp = 0) //plot for buy icon
plotshape(bearish and showBuySell, title="Sell", text="Sell", color=#FF0000, style=shape.labeldown, location=location.abovebar, size=size.small, textcolor=#000000, transp = 0) //plot for sell icon
/// Bar color ///
ema1 = 50
shema = true
usedEma = ema(close, ema1)
emaUpColor() => hlc3 >= usedEma
emaDownColor() => hlc3 < usedEma
col = hlc3 >= usedEma ? lime : hlc3 < usedEma ? red : white
barcolor(emaUpColor() ? lime: emaDownColor() ? red : na)
///
/// MA Ribbon ///
pricetype = close
useCurrentRes = true
resC = "W"
res = useCurrentRes ? period : resC
price = security(tickerid, res, pricetype)
// MA period input
shortperiod = 50
longperiod = 100
// MA calculation
smoothinput = 2
short = smoothinput == 1 ? sma(price, shortperiod) :
smoothinput == 2 ? ema(price, shortperiod) :
smoothinput == 3 ? wma(price, shortperiod) :
smoothinput == 4 ? linreg(price, shortperiod,0) :
na
long = smoothinput == 1 ? sma(price, longperiod) :
smoothinput == 2 ? ema(price, longperiod) :
smoothinput == 3 ? wma(price, longperiod) :
smoothinput == 4 ? linreg(price, longperiod,0) :
na
// MA trend direction color
shortcolor = short > short[1] ? lime : short < short[1] ? red : blue
longcolor = long > long[1] ? lime : long < long[1] ? red : blue
// MA output
MA1 = plot(short, title="Short Period", style=linebr, linewidth=2, color=shortcolor)
MA2 = plot(long, title="Long Period", style=linebr, linewidth=4, color=longcolor)
fill(MA1, MA2, color=silver, transp=50)
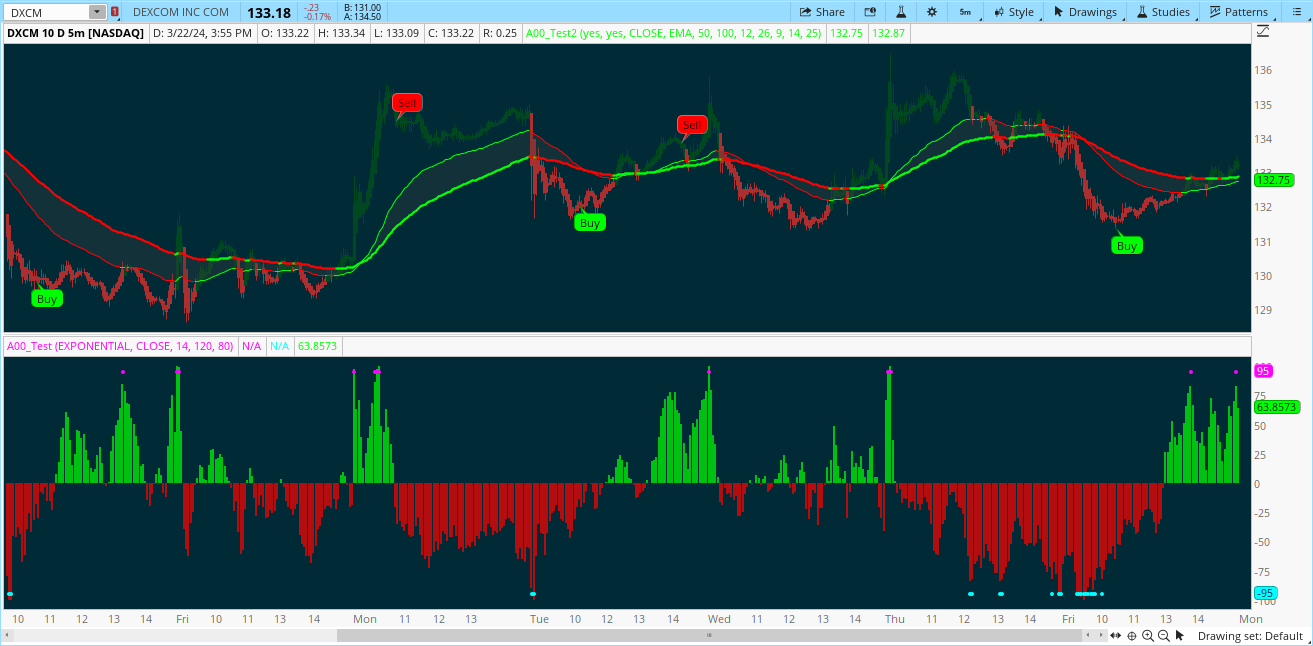
check the below:

CSS:
#///version=4
#study("Trend Trader", shorttitle = "TT", overlay = true)
# Converted by Sam4Cok@Samer800    - 03/2024 - request from useThinkScript.com member
input colorBars = yes;
input showBuySell = yes; #defval = true, title="Show Buy/Sell Labels")
input src = close;
input movAvgType = {Default EMA, SMA, WMA, LSMA};
input movAvgShortPeriod = 50;
input movAvgLongPeriod = 100;
input macdFastLength = 12;
input macdSlowLength = 26;
input macdSignalLength = 9;
input adxLength = 14;
input adxThreshold = 25;

def na = Double.NaN;
def up = (close - close[1]);
def down = -(close - close[1]);
def plusDM = if isNaN(up) then 0 else (if up > down and up > 0 then up else 0);
def minusDM = if isNAN(down) then 0 else (if down > up and down > 0 then down else 0);
def truerange = ATR(Length = adxLength);
def plus1 = (100 * WildersAverage(plusDM, adxLength) / truerange);
def minus1 = (100 * WildersAverage(minusDM, adxLength) / truerange);
def plus = if plus1==0 then plus[1] else plus1;
def minus = if minus1==0 then minus[1] else minus1;
def sum = plus + minus;
def adx = 100 * WildersAverage(AbsValue(plus - minus) / (if sum == 0 then 1 else sum), adxLength);
def sig = adx;

#// Calculating
def fast_ma = ExpAverage(src, macdFastLength);
def slow_ma = ExpAverage(src, macdSlowLength);
def macd = fast_ma - slow_ma;
def signal = ExpAverage(macd, macdSignalLength);

#// Check adx
def macd_crossup = macd < 0 and (macd Crosses above signal);
def macd_crossdown = macd > 0 and (signal Crosses above macd);
def bullish = sig > adxThreshold and macd_crossup;
def bearish = sig > adxThreshold and macd_crossdown;

AddChartBubble(bullish and showBuySell, low, "Buy", Color.GREEN, no);
AddChartBubble(bearish and showBuySell, high, "Sell", Color.RED);

#// MA calculation
def short; def long;
Switch (movAvgType) {
Case SMA :
    short = Average(src, movAvgShortPeriod);
    long  = Average(src, movAvgLongPeriod);
Case WMA :
    short = WMA(src, movAvgShortPeriod);
    long  = WMA(src, movAvgLongPeriod);
Case LSMA :
    short = Inertia(src, movAvgShortPeriod);
    long  = Inertia(src, movAvgLongPeriod);
Default :
    short = ExpAverage(src, movAvgShortPeriod);
    long  = ExpAverage(src, movAvgLongPeriod);
}
#// MA trend direction color
def shortcol = if short > short[1] then 1 else if short < short[1] then -1 else 0;
def longcol = if long > long[1] then 1 else if long < long[1] then -1 else 0;

#// MA output
plot MA1 = short; #, title="Short Period", style=linebr, linewidth=2, color=shortcolor)
plot MA2 = long; #, title="Long Period", style=linebr, linewidth=4, color=longcolor)
MA2.SetLineWeight(2);
MA1.AssignValueColor(if shortcol>0 then Color.GREEN else
                     if shortcol<0 then Color.RED else Color.GRAY);
MA2.AssignValueColor(if longcol>0 then Color.GREEN else
                     if longcol<0 then Color.RED else Color.GRAY);

AddCloud(MA1, MA2, Color.DARK_GRAY, Color.DARK_GRAY);

#/// Bar color ///
def usedEma = MA1; #ExpAverage(close, emaLength);

AssignPriceColor(if !colorBars then Color.CURRENT else
                 if hlc3 > usedEma then Color.UPTICK else
                 if hlc3 < usedEma then Color.DOWNTICK else Color.GRAY);

#-- END of CODE
 

Join useThinkScript to post your question to a community of 21,000+ developers and traders.

Similar threads

Not the exact question you're looking for?

Start a new thread and receive assistance from our community.

87k+ Posts
535 Online
Create Post

Similar threads

Similar threads

The Market Trading Game Changer

Join 2,500+ subscribers inside the useThinkScript VIP Membership Club
  • Exclusive indicators
  • Proven strategies & setups
  • Private Discord community
  • ‘Buy The Dip’ signal alerts
  • Exclusive members-only content
  • Add-ons and resources
  • 1 full year of unlimited support

Frequently Asked Questions

What is useThinkScript?

useThinkScript is the #1 community of stock market investors using indicators and other tools to power their trading strategies. Traders of all skill levels use our forums to learn about scripting and indicators, help each other, and discover new ways to gain an edge in the markets.

How do I get started?

We get it. Our forum can be intimidating, if not overwhelming. With thousands of topics, tens of thousands of posts, our community has created an incredibly deep knowledge base for stock traders. No one can ever exhaust every resource provided on our site.

If you are new, or just looking for guidance, here are some helpful links to get you started.

What are the benefits of VIP Membership?
VIP members get exclusive access to these proven and tested premium indicators: Buy the Dip, Advanced Market Moves 2.0, Take Profit, and Volatility Trading Range. In addition, VIP members get access to over 50 VIP-only custom indicators, add-ons, and strategies, private VIP-only forums, private Discord channel to discuss trades and strategies in real-time, customer support, trade alerts, and much more. Learn all about VIP membership here.
How can I access the premium indicators?
To access the premium indicators, which are plug and play ready, sign up for VIP membership here.
Back
Top