Hello,
I would really love if someone capable
@BenTen @horserider @BonBon @MerryDay and other coders help in converting this script from tradingview to ToS. I found it very useful and would prefer to have it in ToS so I can create a scan from it.
It is a free script in TradingView created by UnknownUnicorn1946597. It gives a buy/sell signal that has worked very well for me.
View attachment 21398
Release Notes
Dec 15, 2020
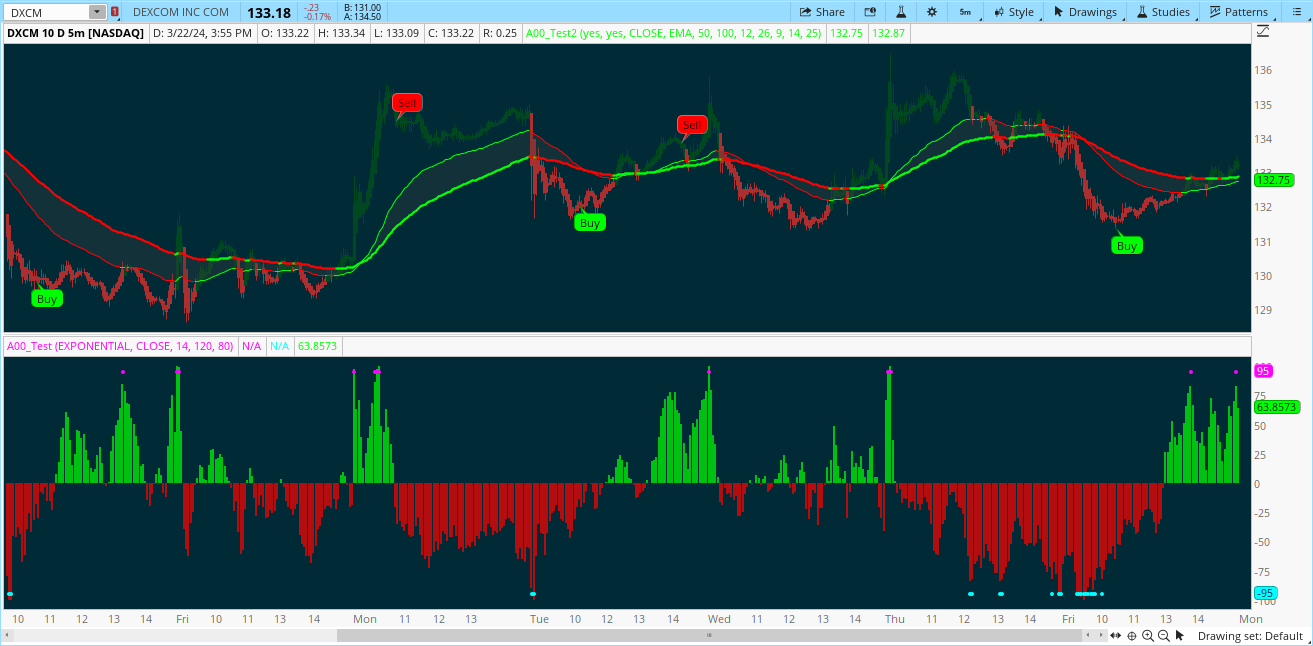
Trend Trader
The code is open source, what it uses to print signals is MACD cross and ADX. Bar colors change in relation to where price is according to the 50 day MA. The MA ribbon is used for visualizing trend and using it for dynamic support/resistance. The ribbon is comprised of the 50 day and 100 day MAs.
Main reason to publish this script is because some like to jumble up scripts together slap some moving averages on it to "follow trend" and then label it an algorithm, market it and sell it to people online. No single system will work 100% of the time, do you due diligence in anything you are interested in buying. Plenty of free scripts in the TV library that can do you justice when trading.
Dec 30, 2020
Release Notes:
Logic calculation change
Code:
++++++++
///version=4
study("Trend Trader", shorttitle = "TT", overlay = true)
// Inputs
showBuySell = input(defval = true, title="Show Buy/Sell Labels")
//
// Logic ///
fast_length = 12
slow_length = 26
src = close
signal_length = 9
// adx inputs
adxlen = 14
dilen = 14
dirmov(len) =>
up = change(close)
down = -change(close)
plusDM = na(up) ? na : (up > down and up > 0 ? up : 0)
minusDM = na(down) ? na : (down > up and down > 0 ? down : 0)
truerange = rma(tr, len)
plus = fixnan(100 * rma(plusDM, len) / truerange)
minus = fixnan(100 * rma(minusDM, len) / truerange)
[plus, minus]
adx(dilen, adxlen) =>
[plus, minus] = dirmov(dilen)
sum = plus + minus
adx = 100 * rma(abs(plus - minus) / (sum == 0 ? 1 : sum), adxlen)
sig = adx(dilen, adxlen)
// Plot colors
col_grow_above = #26A69A
col_grow_below = #FFCDD2
col_fall_above = #B2DFDB
col_fall_below = #EF5350
col_macd = #0094ff
col_signal = #ff6a00
// Calculating
fast_ma = ema(src, fast_length)
slow_ma = ema(src, slow_length)
macd = fast_ma - slow_ma
signal = ema(macd, signal_length)
hist = macd - signal
// Check adx
macd_crossup=macd < 0 and crossover(macd, signal)
macd_crossdown=macd > 0 and crossover(signal, macd)
bullish = sig > 25 and macd_crossup
bearish = sig > 25 and macd_crossdown
plotshape(bullish and showBuySell, title="Buy", text="Buy", color=#00FF00, style=shape.labelup, location=location.belowbar, size=size.small, textcolor=#000000, transp = 0) //plot for buy icon
plotshape(bearish and showBuySell, title="Sell", text="Sell", color=#FF0000, style=shape.labeldown, location=location.abovebar, size=size.small, textcolor=#000000, transp = 0) //plot for sell icon
/// Bar color ///
ema1 = 50
shema = true
usedEma = ema(close, ema1)
emaUpColor() => hlc3 >= usedEma
emaDownColor() => hlc3 < usedEma
col = hlc3 >= usedEma ? lime : hlc3 < usedEma ? red : white
barcolor(emaUpColor() ? lime: emaDownColor() ? red : na)
///
/// MA Ribbon ///
pricetype = close
useCurrentRes = true
resC = "W"
res = useCurrentRes ? period : resC
price = security(tickerid, res, pricetype)
// MA period input
shortperiod = 50
longperiod = 100
// MA calculation
smoothinput = 2
short = smoothinput == 1 ? sma(price, shortperiod) :
smoothinput == 2 ? ema(price, shortperiod) :
smoothinput == 3 ? wma(price, shortperiod) :
smoothinput == 4 ? linreg(price, shortperiod,0) :
na
long = smoothinput == 1 ? sma(price, longperiod) :
smoothinput == 2 ? ema(price, longperiod) :
smoothinput == 3 ? wma(price, longperiod) :
smoothinput == 4 ? linreg(price, longperiod,0) :
na
// MA trend direction color
shortcolor = short > short[1] ? lime : short < short[1] ? red : blue
longcolor = long > long[1] ? lime : long < long[1] ? red : blue
// MA output
MA1 = plot(short, title="Short Period", style=linebr, linewidth=2, color=shortcolor)
MA2 = plot(long, title="Long Period", style=linebr, linewidth=4, color=longcolor)
fill(MA1, MA2, color=silver, transp=50)