ATR Volatility Based System Indicator for ThinkorSwim

BenTen

Administrative
Staff member
Staff
VIP
Lifetime
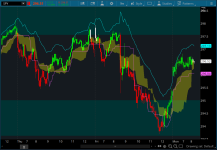
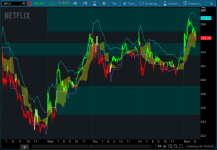
Found this interesting script on TradingView. I think it's based on Jim Berg's ATR Volatility Based System.

cxGHUrq.png

gQ7TRQ9.png


thinkScript Code

Code:
# ATR Volatility Based System Jim Berg
# Assembled by BenTen at useThinkScript.com
# Converted from https://www.tradingview.com/script/UxWO2H5P/

input length = 10;

def EntrySignal = close > (lowest(low, 20) + 2 * atr(Length));
def ExitSignal = close < (highest(high, 20) - 2 * atr(Length));
def TrailStop = highest(close - 2 * atr(Length), 15);
def ProfitTaker = expAverage(high, 13) + 2 * atr(Length);

assignPriceColor(if EntrySignal then Color.GREEN else if ExitSignal then Color.RED else Color.WHITE);

def entry = ((lowest(low, 20)) + 2 * atr(Length));
def exit = ((highest(high, 20)) - 2 * atr(Length));
plot trail = TrailStop;
plot profit_taker = ProfitTaker;

trail.SetDefaultColor(GetColor(0));
profit_taker.SetDefaultColor(GetColor(1));

AddCloud(entry, exit, color.yellow, color.yellow);
 

Attachments

  • cxGHUrq.png
    cxGHUrq.png
    107.4 KB · Views: 305
  • gQ7TRQ9.png
    gQ7TRQ9.png
    124.5 KB · Views: 353
Last edited:
cool thanks Ben for the port and awareness. so, if the price is above the cloud long, if in the cloud neutral, outside (below) the cloud short?
 
@diazlaz Yes, the color of the candles can also help too. If it switches from red to green or green to red then that's the reversal in trend.
 
I took liberty to improve it a bit. I really like scan results so far. I am gonna play FDP from for daily swing low
Code:
# ATR Volatility Based System Jim Berg
# Assembled by BenTen at useThinkScript.com
# Converted from https://www.tradingview.com/script/UxWO2H5P/
#https://trade29.com/jim-bergs-truth-about-volatility-trading-system/
#fixes for trail and profit taker .+ scan ready signal

input length = 10;
input fast=13;
input HHLLlength=20;
def TrailStop = highest(close - 2 * atr(Length), fast+2);
def EntrySignal = close > (lowest(low, HHLLlength) + 2 * atr(Length)) and close>trailstop ;
def ExitSignal = close < (highest(high, HHLLlength) - 2 * atr(Length)) and close<trailstop;
def ProfitTaker = expAverage(if entrysignal then high else low, fast)
                + 2 * atr(Length)*(if entrysignal then 1 else -1);

def neutral=!entrysignal and !exitsignal;
assignPriceColor( if  EntrySignal then Color.GREEN else if ExitSignal then Color.RED else Color.gray);

def entry = ((lowest(low,  HHLLlength)) + 2 * atr(Length));
def exit = ((highest(high,  HHLLlength)) - 2 * atr(Length));
plot trail = TrailStop;
plot profit_taker = ProfitTaker;

trail.SetDefaultColor(GetColor(0));
profit_taker.SetDefaultColor(GetColor(1));

AddCloud(entry, exit, color.orange, color.orange);
plot scan=if  !entrysignal[1] and entrysignal  then 1
        else if  !exitsignal[1] and exitsignal then -1
        else 0;

here is scan I am using https://tos.mx/HdogcGE

So excited for this scanner, entered 3 testing position - really like setups. Will update on them
 
Last edited:
@BenTen - Why was the cloud added? I do not recall a cloud being used? I'm guessing it is used instead of the 34 week MA?
 
@mc01439 I believe it was in the original code. Cloud = distance between exit and entry. Let me know if you see something else.
 
I love this study on daily so much. This is latest version . There is a lot of stuff to add and build on but as it is very very good for daily trend changes .
https://tos.mx/OJGiDuU
I have a theory why its so good and it fits in line with my thinking. - There is a lot which can be improve but its uncanny how such ATR volatility reflects market structure even in a simple study like this
 
@
I love this study on daily so much. This is latest version . There is a lot of stuff to add and build on but as it is very very good for daily trend changes .
https://tos.mx/OJGiDuU
I have a theory why its so good and it fits in line with my thinking. - There is a lot which can be improve but its uncanny how such ATR volatility reflects market structure even in a simple study like this

Can you explain how you're using the new version?
 
I love this study on daily so much. This is latest version . There is a lot of stuff to add and build on but as it is very very good for daily trend changes .
https://tos.mx/OJGiDuU
I have a theory why its so good and it fits in line with my thinking. - There is a lot which can be improve but its uncanny how such ATR volatility reflects market structure even in a simple study like this

@skynetgen - What is your theory?
 
@skynetgen - What is your theory?
Ill try to summarize:
1) Market structure is this: 1) zones of consolidation (sqz triangles, expanding triangles and boxes) 2) shakeouts 3) Trends
2) We want to catch trends while avoiding 1) and 2)
3) ATR volatility character change is basically a proxy indicator for a transition from consolidation to shakeout and/or trend

Goal is to build something more accurate, but this one is very very good as starting point
@skynetgen curious, what is your take on the 2 points below. Thanks.
1. Please go into a little detail on how you use the Cloud between the bands.
2. What does this show that Keltner Channels do not?
 
@skynetgen curious, what is your take on the 2 points below. Thanks.
1. Please go into a little detail on how you use the Cloud between the bands.
2. What does this show that Keltner Channels do not?
1) I dont use cloud - removed
2) it combines HHLL over period . I mean this with coloration and fixes I added is a different signal than Keltner. Keltner just gives you bands. This gives you signal when character of volatility changes. I added this to my main daily chart and signal it gives is amazing accuracy ( I use other things too, but for main trend direction this is now my main thing)

p.s. - Only testing it for daily. I use different approach for different intraday timeframe as price action there behave differently ( gaps , time of day etc ). - It might work there I dunno - not tested yet
 
Last edited:
So closing the swing I tested today. I ran scan on monday morning and chose 3 names : FDP, ULTA, TOT. I entered them in AM
I should have chosen more short names but whatever (maybe even makes for better test) :

FDP closed today near target for nice profit .
TOT closed on alert on crossing under trailstop on Tuesday (minor loss)
ULTA closed this morning on reversing below yest close ( and market -well you seen the market). good profit .

Will work more on analysis this weekend but so far pretty promising
 
@skynetgen I'm really enjoying this indicator on the daily and hourly as well. Needs more testing but so far so good. I look forward to reading your analysis.
 
I really like this indicator so simple and clean on my daily chart.. Ive added a few things to the chart the advanced mm, volume reversal and Demark support and resistance as well the magic fib. Very excited to see where it goes from here,
 
Well I added it to every timeframe except weekly and monthly and went through my week analysis (all trades and setups done during the week). Its effing amazing. Will be using it in trades next week as core of my setup. The only thing it is a bit laggy with new trend setups on 30m for intraday plays. So when I see a gray bar on 30m and everything else is good (daily/5m) its good enough for entry
 

Join useThinkScript to post your question to a community of 21,000+ developers and traders.

Similar threads

Not the exact question you're looking for?

Start a new thread and receive assistance from our community.

87k+ Posts
418 Online
Create Post

Similar threads

Similar threads

The Market Trading Game Changer

Join 2,500+ subscribers inside the useThinkScript VIP Membership Club
  • Exclusive indicators
  • Proven strategies & setups
  • Private Discord community
  • ‘Buy The Dip’ signal alerts
  • Exclusive members-only content
  • Add-ons and resources
  • 1 full year of unlimited support

Frequently Asked Questions

What is useThinkScript?

useThinkScript is the #1 community of stock market investors using indicators and other tools to power their trading strategies. Traders of all skill levels use our forums to learn about scripting and indicators, help each other, and discover new ways to gain an edge in the markets.

How do I get started?

We get it. Our forum can be intimidating, if not overwhelming. With thousands of topics, tens of thousands of posts, our community has created an incredibly deep knowledge base for stock traders. No one can ever exhaust every resource provided on our site.

If you are new, or just looking for guidance, here are some helpful links to get you started.

What are the benefits of VIP Membership?
VIP members get exclusive access to these proven and tested premium indicators: Buy the Dip, Advanced Market Moves 2.0, Take Profit, and Volatility Trading Range. In addition, VIP members get access to over 50 VIP-only custom indicators, add-ons, and strategies, private VIP-only forums, private Discord channel to discuss trades and strategies in real-time, customer support, trade alerts, and much more. Learn all about VIP membership here.
How can I access the premium indicators?
To access the premium indicators, which are plug and play ready, sign up for VIP membership here.
Back
Top