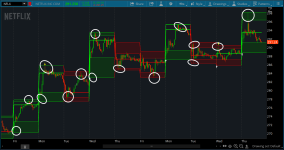
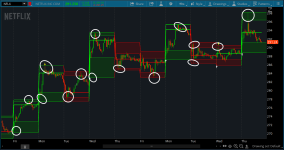
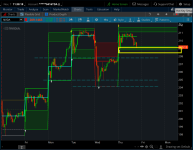
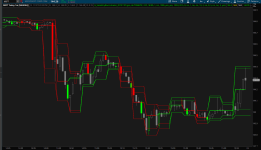
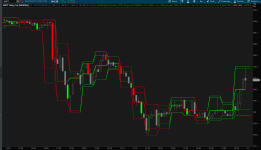
Volatility Box Indicator for ThinkorSwim

input pricecolor = no;
AssignPriceColor(if pricecolor and dnarrow then Color.white else Color.current);
AssignPriceColor(if pricecolor and uparrow then Color.cyan else color.current);

@Huffmac90 Try this:

input pricecolor = no;
AssignPriceColor(if pricecolor and dnarrow
then Color.WHITE
else if pricecolor and uparrow
then Color.CYAN
else Color.DARK_GRAY);

Hope this helps :)
 

New Indicator: Buy the Dip

Check out our Buy the Dip indicator and see how it can help you find profitable swing trading ideas. Scanner, watchlist columns, and add-ons are included.

Download the indicator

@Huffmac90 What changes did you make? Are those changes reflected in the code you just posted? What settings are you currently using for the indicator?

@BenTen I just changed the price color code. Everything else is solid and reflected in the upper code. 153 to 155

input pricecolor = no;
AssignPriceColor(if pricecolor and dnarrow then Color.white else Color.current);
AssignPriceColor(if pricecolor and uparrow then Color.cyan else color.current);

Would like to get the supertrend painter code to work but I'm missing an Else statement 154:18
AssignPriceColor(if pricecolor then if dnarrow then Color.DOWNTICK else if uparrow then Color.GREEN else Color.GRAY);

Bare with me, dying from migraines today! hahaha
 
@Huffmac90 How do you identify the candles? You have the arrows identified... I think if you identified the candles in the same way you'd be done...

Let me check on some code and I'll get back to you once I'm done...

Hope you're feeling better :)
 
@Huffmac90 This indicator looks really cool. Can you confirm that it's not showing the top and bottom line after the fact? Looking at the 20d 15m. I have yet to find a single false signal. This usually mean the indicator will repaint or delay. You said you're currently using it. Can you confirm its not?

gIIG1vC.png
 

Attachments

  • gIIG1vC.png
    gIIG1vC.png
    150.8 KB · Views: 244
@Huffmac90:

Does this snippet/example hopefully help...

def long = SMI < 35 and mom > 0 and mom[1] < 0;
def short = SMI > 35 and mom < 0 and mom[1] > 0;

AssignPriceColor(if long then Color.GREEN else if short then Color.RED else Color.DARK_GRAY);
 
@Huffmac90 This indicator looks really cool. Can you confirm that it's not showing the top and bottom line after the fact? Looking at the 20d 15m. I have yet to find a single false signal. This usually mean the indicator will repaint or delay. You said you're currently using it. Can you confirm its not?

gIIG1vC.png

@BenTen

⚠ Caution: should not be used without a lower indicator set --> the Volatility Box's weakness (TOSindicator.com)

Most people wouldn't like it because the arrow appears on bottom and top level taps and is a little re-painterish. False signals are about 1 out of every 10 arrows. My current win rate is 87% using this with confirmation with my lower indicator set. candle painter works to color pivots like in person's pivots models. The original code was found in the onenote under review strategy section. The code is not perfect though because you still need to know the fundamentals of zone trading for it to be effective.

I like it for it's strengths though because I'm a zone strategy trader (Don Fron on YouTube uses zones) and this depicts them perfectly.
 

Attachments

  • gIIG1vC.png
    gIIG1vC.png
    150.8 KB · Views: 213
Last edited:
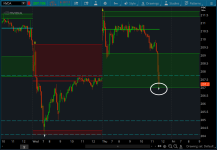
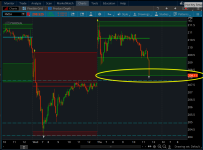
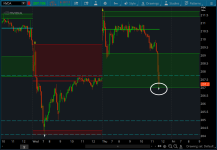
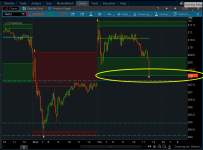
Okay, I was able to confirm that this indicator indeed will repaint, and the boxes will re-adjust itself based on the current price. I would be cautious of using it. ⚠

Here is NVDA that I just witnessed. I was watching it since it was coming down to the bottom of the box. In my mind, I would be expecting a bounce here. But then NVDA suddenly crashed, and the box gets adjusted to the low of day. This makes it really bad for trading in real-time.

Glad you're having success with it @Huffmac90 but I would advise everyone else to be careful with it.

zfETYjB.png


QfePqyO.png


F8pljdg.png


Pay attention to the price (red bubble on the right). This indicator looks great in the after hours but not so much when you're day trading it live. Again, please be extremely cautious when using it.
 

Attachments

  • F8pljdg.png
    F8pljdg.png
    82.3 KB · Views: 196
  • QfePqyO.png
    QfePqyO.png
    106.4 KB · Views: 209
  • zfETYjB.png
    zfETYjB.png
    119.8 KB · Views: 207
Okay, I was able to confirm that this indicator indeed will repaint, and the boxes will re-adjust itself based on the current price. I would be cautious of using it. ⚠

Here is NVDA that I just witnessed. I was watching it since it was coming down to the bottom of the box. In my mind, I would be expecting a bounce here. But then NVDA suddenly crashed, and the box gets adjusted to the low of day. This makes it really bad for trading in real-time.

Glad you're having success with it @Huffmac90 but I would advise everyone else to be careful with it.

zfETYjB.png


QfePqyO.png


F8pljdg.png


Pay attention to the price (red bubble on the right). This indicator looks great in the after hours but not so much when you're day trading it live. Again, please be extremely cautious when using it.

With that though, any idea on how to paint those candles gray? Hahahaha, I'm going to keep using it because it matches my style perfectly but adding the gray candles would save me some trouble intra-zone.

I have a few people I'm teaching zone strategy already and this will help illustrate that.

⚠ Caution: should not be used without a lower indicator set
 

Attachments

  • F8pljdg.png
    F8pljdg.png
    82.3 KB · Views: 204
  • QfePqyO.png
    QfePqyO.png
    106.4 KB · Views: 205
  • zfETYjB.png
    zfETYjB.png
    119.8 KB · Views: 202
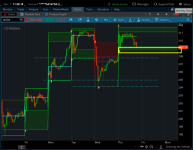
not sure if this is all what you want. I cleaned up the code a bit and revised the color bars.

N7Ht3YQ.png


Ruby:
#VolumeProfile_IntradaySelection with Expanded Intraday Period Selections plus
#
#the Prior Day's Value Areas
#INPUTS
input showlines = yes;
input pricePerRowHeightMode = { AUTOMATIC, default TICKSIZE, CUSTOM};
input customRowHeight = .01;
input timePerProfile = {CHART, MINUTE, MIN2, MIN3, MIN4, MIN5, MIN10, default MIN15, MIN20, MIN30, HOUR, TWOHOUR, FOURHOUR, DAY , TWODAY, THREEDAY, FOURDAY, WEEK, MONTH, "OPT EXP", BAR};
input multiplier = 1;
input onExpansion = no;
input profiles = 1000;
input showPointOfControl = yes;
input showValueArea = yes;
input valueAreaPercent = 100.0;
input valueAreaPercent2 = 87.5;
input opacity            = 0;
def period;
def agg;
def yyyymmdd = GetYYYYMMDD();
def seconds = SecondsFromTime(0);
def month = GetYear() * 12 + GetMonth();
def day_number = DaysFromDate(First(yyyymmdd)) + GetDayOfWeek(First(yyyymmdd));
def dom = GetDayOfMonth(yyyymmdd);
def dow = GetDayOfWeek(yyyymmdd - dom + 1);
def expthismonth = (if dow > 5 then 27 else 20) - dow;
def exp_opt      = month + (dom > expthismonth);
switch (timePerProfile) {
case CHART:
period = 0;
agg = AggregationPeriod.DAY;
case MINUTE:
period = Floor(seconds / 60 + day_number * 24 * 60);
agg = AggregationPeriod.MIN;
case MIN2:
period = Floor(seconds / 120 + day_number * 24);
agg = AggregationPeriod.TWO_MIN;
case MIN3:
period = Floor(seconds / 180 + day_number * 24);
agg = AggregationPeriod.THREE_MIN;
case MIN4:
period = Floor(seconds / 240 + day_number * 24);
agg = AggregationPeriod.FOUR_MIN;
case MIN5:
period = Floor(seconds / 300 + day_number * 24);
agg = AggregationPeriod.FIVE_MIN;
case MIN10:
period = Floor(seconds / 600 + day_number * 24);
agg = AggregationPeriod.TEN_MIN;
case MIN15:
period = Floor(seconds / 900 + day_number * 24);
agg = AggregationPeriod.FIFTEEN_MIN;
case MIN20:
period = Floor(seconds / 1200 + day_number * 24);
agg = AggregationPeriod.TWENTY_MIN;
case MIN30:
period = Floor(seconds / 1800 + day_number * 24);
agg = AggregationPeriod.THIRTY_MIN;
case HOUR:
period = Floor(seconds / 3600 + day_number * 24);
agg = AggregationPeriod.HOUR;
case TWOHOUR:
period = Floor(seconds / 7200 + day_number * 24);
agg = AggregationPeriod.TWO_HOURS;
case FOURHOUR:
period = Floor(seconds / 14400 + day_number * 24);
agg = AggregationPeriod.FOUR_HOURS;
case DAY:
period = CountTradingDays(Min(First(yyyymmdd), yyyymmdd), yyyymmdd) - 1;
agg = AggregationPeriod.DAY;
case TWODAY:
period = CountTradingDays(Min(First(yyyymmdd), yyyymmdd), yyyymmdd) - 1;
agg = AggregationPeriod.TWO_DAYS;
case THREEDAY:
period = CountTradingDays(Min(First(yyyymmdd), yyyymmdd), yyyymmdd) - 1;
agg = AggregationPeriod.THREE_DAYS;
case FOURDAY:
period = CountTradingDays(Min(First(yyyymmdd), yyyymmdd), yyyymmdd) - 1;
agg = AggregationPeriod.FOUR_DAYS;
case WEEK:
period = Floor(day_number / 7);
agg = AggregationPeriod.WEEK;
case MONTH:
period = Floor(month - First(month));
agg = AggregationPeriod.MONTH;
case "OPT EXP":
period = exp_opt - First(exp_opt);
agg = AggregationPeriod.DAY;
case BAR:
period = BarNumber() - 1;
agg = AggregationPeriod.DAY;
}
def count = CompoundValue(1, if period != period[1] then (count[1] + period - period[1]) % (if timePerProfile == timePerProfile.TWODAY then 2 else if timePerProfile == timePerProfile.THREEDAY then 3 else if timePerProfile == timePerProfile.FOURDAY then 4 else multiplier) else count[1], 0);
def cond = count < count[1] + period - period[1];
def height;
switch (pricePerRowHeightMode) {
case AUTOMATIC:
height = PricePerRow.AUTOMATIC;
case TICKSIZE:
height = PricePerRow.TICKSIZE;
case CUSTOM:
height = customRowHeight;
}
profile vol     = VolumeProfile("startNewProfile" = cond, "onExpansion" = onExpansion, "numberOfProfiles" = profiles, "pricePerRow" = height, "value area percent" = valueAreaPercent);
def con = CompoundValue(1, onExpansion, no);
def pc = if IsNaN(vol.GetPointOfControl()) and con then pc[1] else vol.GetPointOfControl();
def hVA = if IsNaN(vol.GetHighestValueArea()) and con then hVA[1] else vol.GetHighestValueArea();
def lVA = if IsNaN(vol.GetLowestValueArea()) and con then lVA[1] else vol.GetLowestValueArea();
def hProfile = if IsNaN(vol.GetHighest()) and con then hProfile[1] else vol.GetHighest();
def lProfile = if IsNaN(vol.GetLowest()) and con then lProfile[1] else vol.GetLowest();
def plotsDomain = IsNaN(close) == onExpansion or showlines;
plot POC         = if plotsDomain then pc       else Double.NaN;
plot ProfileHigh = if plotsDomain then hProfile else Double.NaN;
plot ProfileLow  = if plotsDomain then lProfile else Double.NaN;
def VAHigh       = if plotsDomain then hVA      else Double.NaN;
def VALow        = if plotsDomain then lVA      else Double.NaN;
DefineGlobalColor("Profile", GetColor(1));
DefineGlobalColor("Point Of Control", Color.CYAN);
DefineGlobalColor("Value Area", GetColor(8));
vol.Show(color = Color.CURRENT, opacity = opacity, "poc color" = Color.CURRENT);
def pc1   = if pc  != pc[1]  then pc[1]  else pc1[1];
def pc2 = if pc1 != pc1[1] then pc1[1] else pc2[1];
rec uppoc = if pc1 > pc      then 1 else if uppoc[1] == 1 and pc1 >= pc then 1 else 0;
POC.AssignValueColor(if uppoc == 1 then Color.RED else Color.GREEN);
POC.SetLineWeight(2);
ProfileHigh.SetStyle(Curve.POINTS);
ProfileLow.SetPaintingStrategy(PaintingStrategy.HORIZONTAL);
ProfileHigh.SetDefaultColor(GetColor(3));
ProfileLow.SetDefaultColor(GetColor(3));
ProfileHigh.Hide();
ProfileLow.Hide();
input showarrows       = no;
input arrowsensitivity = 1;#Hint arrowsensitivity: number of ticks within 95% to create an arrow
def dn = if high >= VAHigh - TickSize() * arrowsensitivity
then 1
else if dn[1] == 1 and high >= VAHigh - TickSize() * arrowsensitivity
then 1
else 0;
plot dnarrow = if showarrows and dn[1] == 0 and dn == 1
then high + .02
else Double.NaN;
def up = if low <= VALow + TickSize() * arrowsensitivity
then 1
else if up[1] == 1 and low <= VALow + TickSize() * arrowsensitivity
then 1
else 0;
plot uparrow = if showarrows and up[1] == 0 and up == 1
then low - .02
else Double.NaN;
dnarrow.SetPaintingStrategy(PaintingStrategy.ARROW_DOWN);
uparrow.SetPaintingStrategy(PaintingStrategy.ARROW_UP);
dnarrow.SetDefaultColor(Color.YELLOW);
uparrow.SetDefaultColor(Color.WHITE);
profile vol1  = VolumeProfile("startNewProfile" = cond, "onExpansion" = onExpansion, "numberOfProfiles" = profiles, "pricePerRow" = height, "value area percent" = valueAreaPercent2);
def hVA1 = if IsNaN(vol1.GetHighestValueArea()) and con then hVA[1] else vol1.GetHighestValueArea();
def lVA1 = if IsNaN(vol1.GetLowestValueArea()) and con then lVA[1] else vol1.GetLowestValueArea();
def upvah1 = if hVA1[1] < hVA1 then 1 else if upvah1[1] == 1 and hVA1[1] <= hVA1 then 1 else 0;
def upval1 = if lVA1[1] < lVA1 then 1 else if upval1[1] == 1 and lVA1[1] <= lVA1 then 1 else 0;
plot VAHigh1 = if plotsDomain then hVA1 else Double.NaN;
plot VALow1 = if plotsDomain then lVA1 else Double.NaN;
VAHigh1.SetStyle(Curve.SHORT_DASH);
VALow1.SetStyle(Curve.SHORT_DASH);
#addcloud(vahigh,vahigh1,color.light_orange, color2 = Color.LIGHT_ORANGE);
#addcloud(valow1,valow,Color.LIGHT_GRAY, color2 = Color.LIGHT_GRAY);
def upvah = if hVA[1] < hVA then 1 else if upvah[1] == 1 and hVA[1] <= hVA then 1 else 0;
def upval = if lVA[1] < lVA then 1 else if upval[1] == 1 and lVA[1] <= lVA then 1 else 0;
def green = upvah1 == 1 and upval1 == 1;
def red = upvah1 == 0 and upval1 == 0;
def green1 = if green then 1 else if green1[1] == 1 and !red then 1 else 0;
def green1ext = if IsNaN(close) then green1ext[1] else green1;
def g1ext = green1ext;
def g1 = green1ext;
def red1 = if red then 1 else if red1[1] == 1 and !green then 1 else 0;
def red1ext = if IsNaN(close) then red1ext[1] else red1;
def r1ext = red1ext;
def r1        = red1;
VAHigh1.AssignValueColor(if green1 then Color.GREEN else Color.RED);
VALow1.AssignValueColor (if green1 then Color.GREEN else Color.RED);
plot vahplot = VAHigh;
vahplot.AssignValueColor(if green1 then Color.GREEN else Color.RED);
plot valplot = VALow;
valplot.AssignValueColor(if green1 then Color.GREEN else Color.RED);
def vahext = if IsNaN(close) then vahext[1] else VAHigh;
plot vahextp = vahext;
vahextp.AssignValueColor(if green1ext then Color.GREEN else Color.RED);
def valext = if IsNaN(close) then valext[1] else VALow;
plot valextp = valext;
valextp.AssignValueColor(if green1ext then Color.GREEN else Color.RED);
def vah1ext = if IsNaN(close) then vah1ext[1] else VAHigh1;
plot vah1extp = vah1ext;
vah1extp.AssignValueColor(if green1ext then Color.GREEN else Color.RED);
def val1ext = if IsNaN(close) then val1ext[1] else VALow1;
plot val1extp = val1ext;
val1extp.AssignValueColor(if green1ext then Color.GREEN else Color.RED);
input showclouds = no;
AddCloud(if showclouds and g1ext then vahextp else Double.NaN, vah1extp, Color.DARK_GREEN, Color.DARK_GREEN);
AddCloud(if showclouds and g1ext then val1extp else Double.NaN, valextp, Color.DARK_GREEN, Color.DARK_GREEN);
AddCloud(if showclouds and r1ext then vahextp else Double.NaN, vah1extp, Color.DARK_RED, Color.DARK_RED);
AddCloud(if showclouds and r1ext then val1extp else Double.NaN, valextp,  Color.DARK_RED, Color.DARK_RED);
POC.HideBubble();
VAHigh1.HideBubble();
VALow1.HideBubble();
vahplot.HideBubble();
valplot.HideBubble();
uparrow.HideBubble();
dnarrow.HideBubble();
vahextp.HideBubble();
vah1extp.HideBubble();
valextp.HideBubble();
val1extp.HideBubble();
input showbubbleperperiod = no;
input bubblemoverperperiodhorizontal = 10;
input bubblemoverperperiodvertical  = 2;
def bubble = if period[1] != period then BarNumber() + bubblemoverperperiodhorizontal else bubble[1];
AddChartBubble(showbubbleperperiod and BarNumber() == (bubble), Max(high, VAHigh) + bubblemoverperperiodvertical * TickSize(), (VAHigh - VALow) + "\n" + (VAHigh1 - VALow1) , if green then Color.GREEN else if red then Color.RED else Color.GRAY, yes);
input showcurrentperiodbubble = no;
input x = 8;
def x1  = x + 1;
AddChartBubble(showcurrentperiodbubble and !IsNaN(close[x1]) and IsNaN(close[x]), close[x1], (VAHigh[x1] - VALow[x1]) + " :\n" + volume(period = agg), if green[x1] then Color.GREEN else if red[x1] then Color.RED else Color.GRAY);
input n = 5;
def n1 = n + 1;
input showbubblesVAvalues = no;
AddChartBubble(showbubblesVAvalues and !IsNaN(close[n1]) and IsNaN(close[n]), Round(POC[n1], 2) , "POC: " + Round(POC[n1], 2), if uppoc[n1] == 1 then Color.RED else Color.GREEN, yes);
AddChartBubble(showbubblesVAvalues and !IsNaN(close[n1]) and IsNaN(close[n]), Round(VALow1[n1], 2) , "VL: " + Round(VALow1[n1], 2), if upval[n1] == 1 then Color.RED else Color.GREEN, yes);
AddChartBubble(showbubblesVAvalues and !IsNaN(close[n1]) and IsNaN(close[n]), Round(VALow[n1], 2) , "VL1: " + Round(VALow[n1], 2), if upval1[n1] == 1 then Color.RED else Color.GREEN, yes);
AddChartBubble(showbubblesVAvalues and !IsNaN(close[n1]) and IsNaN(close[n]), Round(VAHigh1[n1], 2) , "VH: " + Round(VAHigh1[n1], 2), if upvah1[n1] == 1 then Color.RED else Color.GREEN, yes);
AddChartBubble(showbubblesVAvalues and !IsNaN(close[n1]) and IsNaN(close[n]), Round(VAHigh[n1], 2) , "VH1: " + Round(VAHigh[n1], 2), if upvah[n1] == 1 then Color.RED else Color.GREEN, yes);
#Squeeze Added
input showsqueeze = no;
def bbupper = reference BollingerBands().UpperBand;
def kcupper = KeltnerChannels().Upper_Band;
def Squeeze = bbupper - kcupper < 0;
plot Squeezeplot = if showsqueeze and Squeeze then POC else Double.NaN;
Squeezeplot.SetDefaultColor(Color.WHITE);
Squeezeplot.SetPaintingStrategy(PaintingStrategy.POINTS);
Squeezeplot.SetLineWeight(3);
Squeezeplot.HideBubble();
#Count of Periods in consecutive squeeze
rec countsq = if Squeeze then countsq[1] + 1 else 0;
rec count1sq = if !Squeeze then count1sq[1] + 1 else 0;
#Expansion Bubbles
input q = 3;
def q1 = q + 1;
AddChartBubble(showsqueeze and !IsNaN(close[q1]) and IsNaN(close[q]), POC[q1] , if Squeeze[q1] then "S " + Round(countsq[q1], 2) else "NS " + count1sq[q1] , if DMI_Oscillator()[q1] < 0 then Color.RED else Color.GREEN, no);
#COLORBARS
input pricecolor = yes;
AssignPriceColor(
if PRICECOLOR then
if dn[1] == 0 and dn == 1 then COLOR.RED else
if up[1] == 0 and up == 1 then COLOR.GREEN else
COLOR.GRAY
else
COLOR.CURRENT
);

#END OF STUDY

@Gildes and @Billions can you look at it. you all might already have it done. will be good to fit/gap and publish a final version once you're all done with your reviews.
 

Attachments

  • N7Ht3YQ.png
    N7Ht3YQ.png
    205.3 KB · Views: 231
not sure if this is all what you want. I cleaned up the code a bit and revised the color bars.

N7Ht3YQ.png


Ruby:
#VolumeProfile_IntradaySelection with Expanded Intraday Period Selections plus
#
#the Prior Day's Value Areas
#INPUTS
input showlines = yes;
input pricePerRowHeightMode = { AUTOMATIC, default TICKSIZE, CUSTOM};
input customRowHeight = .01;
input timePerProfile = {CHART, MINUTE, MIN2, MIN3, MIN4, MIN5, MIN10, default MIN15, MIN20, MIN30, HOUR, TWOHOUR, FOURHOUR, DAY , TWODAY, THREEDAY, FOURDAY, WEEK, MONTH, "OPT EXP", BAR};
input multiplier = 1;
input onExpansion = no;
input profiles = 1000;
input showPointOfControl = yes;
input showValueArea = yes;
input valueAreaPercent = 100.0;
input valueAreaPercent2 = 87.5;
input opacity            = 0;
def period;
def agg;
def yyyymmdd = GetYYYYMMDD();
def seconds = SecondsFromTime(0);
def month = GetYear() * 12 + GetMonth();
def day_number = DaysFromDate(First(yyyymmdd)) + GetDayOfWeek(First(yyyymmdd));
def dom = GetDayOfMonth(yyyymmdd);
def dow = GetDayOfWeek(yyyymmdd - dom + 1);
def expthismonth = (if dow > 5 then 27 else 20) - dow;
def exp_opt      = month + (dom > expthismonth);
switch (timePerProfile) {
case CHART:
period = 0;
agg = AggregationPeriod.DAY;
case MINUTE:
period = Floor(seconds / 60 + day_number * 24 * 60);
agg = AggregationPeriod.MIN;
case MIN2:
period = Floor(seconds / 120 + day_number * 24);
agg = AggregationPeriod.TWO_MIN;
case MIN3:
period = Floor(seconds / 180 + day_number * 24);
agg = AggregationPeriod.THREE_MIN;
case MIN4:
period = Floor(seconds / 240 + day_number * 24);
agg = AggregationPeriod.FOUR_MIN;
case MIN5:
period = Floor(seconds / 300 + day_number * 24);
agg = AggregationPeriod.FIVE_MIN;
case MIN10:
period = Floor(seconds / 600 + day_number * 24);
agg = AggregationPeriod.TEN_MIN;
case MIN15:
period = Floor(seconds / 900 + day_number * 24);
agg = AggregationPeriod.FIFTEEN_MIN;
case MIN20:
period = Floor(seconds / 1200 + day_number * 24);
agg = AggregationPeriod.TWENTY_MIN;
case MIN30:
period = Floor(seconds / 1800 + day_number * 24);
agg = AggregationPeriod.THIRTY_MIN;
case HOUR:
period = Floor(seconds / 3600 + day_number * 24);
agg = AggregationPeriod.HOUR;
case TWOHOUR:
period = Floor(seconds / 7200 + day_number * 24);
agg = AggregationPeriod.TWO_HOURS;
case FOURHOUR:
period = Floor(seconds / 14400 + day_number * 24);
agg = AggregationPeriod.FOUR_HOURS;
case DAY:
period = CountTradingDays(Min(First(yyyymmdd), yyyymmdd), yyyymmdd) - 1;
agg = AggregationPeriod.DAY;
case TWODAY:
period = CountTradingDays(Min(First(yyyymmdd), yyyymmdd), yyyymmdd) - 1;
agg = AggregationPeriod.TWO_DAYS;
case THREEDAY:
period = CountTradingDays(Min(First(yyyymmdd), yyyymmdd), yyyymmdd) - 1;
agg = AggregationPeriod.THREE_DAYS;
case FOURDAY:
period = CountTradingDays(Min(First(yyyymmdd), yyyymmdd), yyyymmdd) - 1;
agg = AggregationPeriod.FOUR_DAYS;
case WEEK:
period = Floor(day_number / 7);
agg = AggregationPeriod.WEEK;
case MONTH:
period = Floor(month - First(month));
agg = AggregationPeriod.MONTH;
case "OPT EXP":
period = exp_opt - First(exp_opt);
agg = AggregationPeriod.DAY;
case BAR:
period = BarNumber() - 1;
agg = AggregationPeriod.DAY;
}
def count = CompoundValue(1, if period != period[1] then (count[1] + period - period[1]) % (if timePerProfile == timePerProfile.TWODAY then 2 else if timePerProfile == timePerProfile.THREEDAY then 3 else if timePerProfile == timePerProfile.FOURDAY then 4 else multiplier) else count[1], 0);
def cond = count < count[1] + period - period[1];
def height;
switch (pricePerRowHeightMode) {
case AUTOMATIC:
height = PricePerRow.AUTOMATIC;
case TICKSIZE:
height = PricePerRow.TICKSIZE;
case CUSTOM:
height = customRowHeight;
}
profile vol     = VolumeProfile("startNewProfile" = cond, "onExpansion" = onExpansion, "numberOfProfiles" = profiles, "pricePerRow" = height, "value area percent" = valueAreaPercent);
def con = CompoundValue(1, onExpansion, no);
def pc = if IsNaN(vol.GetPointOfControl()) and con then pc[1] else vol.GetPointOfControl();
def hVA = if IsNaN(vol.GetHighestValueArea()) and con then hVA[1] else vol.GetHighestValueArea();
def lVA = if IsNaN(vol.GetLowestValueArea()) and con then lVA[1] else vol.GetLowestValueArea();
def hProfile = if IsNaN(vol.GetHighest()) and con then hProfile[1] else vol.GetHighest();
def lProfile = if IsNaN(vol.GetLowest()) and con then lProfile[1] else vol.GetLowest();
def plotsDomain = IsNaN(close) == onExpansion or showlines;
plot POC         = if plotsDomain then pc       else Double.NaN;
plot ProfileHigh = if plotsDomain then hProfile else Double.NaN;
plot ProfileLow  = if plotsDomain then lProfile else Double.NaN;
def VAHigh       = if plotsDomain then hVA      else Double.NaN;
def VALow        = if plotsDomain then lVA      else Double.NaN;
DefineGlobalColor("Profile", GetColor(1));
DefineGlobalColor("Point Of Control", Color.CYAN);
DefineGlobalColor("Value Area", GetColor(8));
vol.Show(color = Color.CURRENT, opacity = opacity, "poc color" = Color.CURRENT);
def pc1   = if pc  != pc[1]  then pc[1]  else pc1[1];
def pc2 = if pc1 != pc1[1] then pc1[1] else pc2[1];
rec uppoc = if pc1 > pc      then 1 else if uppoc[1] == 1 and pc1 >= pc then 1 else 0;
POC.AssignValueColor(if uppoc == 1 then Color.RED else Color.GREEN);
POC.SetLineWeight(2);
ProfileHigh.SetStyle(Curve.POINTS);
ProfileLow.SetPaintingStrategy(PaintingStrategy.HORIZONTAL);
ProfileHigh.SetDefaultColor(GetColor(3));
ProfileLow.SetDefaultColor(GetColor(3));
ProfileHigh.Hide();
ProfileLow.Hide();
input showarrows       = no;
input arrowsensitivity = 1;#Hint arrowsensitivity: number of ticks within 95% to create an arrow
def dn = if high >= VAHigh - TickSize() * arrowsensitivity
then 1
else if dn[1] == 1 and high >= VAHigh - TickSize() * arrowsensitivity
then 1
else 0;
plot dnarrow = if showarrows and dn[1] == 0 and dn == 1
then high + .02
else Double.NaN;
def up = if low <= VALow + TickSize() * arrowsensitivity
then 1
else if up[1] == 1 and low <= VALow + TickSize() * arrowsensitivity
then 1
else 0;
plot uparrow = if showarrows and up[1] == 0 and up == 1
then low - .02
else Double.NaN;
dnarrow.SetPaintingStrategy(PaintingStrategy.ARROW_DOWN);
uparrow.SetPaintingStrategy(PaintingStrategy.ARROW_UP);
dnarrow.SetDefaultColor(Color.YELLOW);
uparrow.SetDefaultColor(Color.WHITE);
profile vol1  = VolumeProfile("startNewProfile" = cond, "onExpansion" = onExpansion, "numberOfProfiles" = profiles, "pricePerRow" = height, "value area percent" = valueAreaPercent2);
def hVA1 = if IsNaN(vol1.GetHighestValueArea()) and con then hVA[1] else vol1.GetHighestValueArea();
def lVA1 = if IsNaN(vol1.GetLowestValueArea()) and con then lVA[1] else vol1.GetLowestValueArea();
def upvah1 = if hVA1[1] < hVA1 then 1 else if upvah1[1] == 1 and hVA1[1] <= hVA1 then 1 else 0;
def upval1 = if lVA1[1] < lVA1 then 1 else if upval1[1] == 1 and lVA1[1] <= lVA1 then 1 else 0;
plot VAHigh1 = if plotsDomain then hVA1 else Double.NaN;
plot VALow1 = if plotsDomain then lVA1 else Double.NaN;
VAHigh1.SetStyle(Curve.SHORT_DASH);
VALow1.SetStyle(Curve.SHORT_DASH);
#addcloud(vahigh,vahigh1,color.light_orange, color2 = Color.LIGHT_ORANGE);
#addcloud(valow1,valow,Color.LIGHT_GRAY, color2 = Color.LIGHT_GRAY);
def upvah = if hVA[1] < hVA then 1 else if upvah[1] == 1 and hVA[1] <= hVA then 1 else 0;
def upval = if lVA[1] < lVA then 1 else if upval[1] == 1 and lVA[1] <= lVA then 1 else 0;
def green = upvah1 == 1 and upval1 == 1;
def red = upvah1 == 0 and upval1 == 0;
def green1 = if green then 1 else if green1[1] == 1 and !red then 1 else 0;
def green1ext = if IsNaN(close) then green1ext[1] else green1;
def g1ext = green1ext;
def g1 = green1ext;
def red1 = if red then 1 else if red1[1] == 1 and !green then 1 else 0;
def red1ext = if IsNaN(close) then red1ext[1] else red1;
def r1ext = red1ext;
def r1        = red1;
VAHigh1.AssignValueColor(if green1 then Color.GREEN else Color.RED);
VALow1.AssignValueColor (if green1 then Color.GREEN else Color.RED);
plot vahplot = VAHigh;
vahplot.AssignValueColor(if green1 then Color.GREEN else Color.RED);
plot valplot = VALow;
valplot.AssignValueColor(if green1 then Color.GREEN else Color.RED);
def vahext = if IsNaN(close) then vahext[1] else VAHigh;
plot vahextp = vahext;
vahextp.AssignValueColor(if green1ext then Color.GREEN else Color.RED);
def valext = if IsNaN(close) then valext[1] else VALow;
plot valextp = valext;
valextp.AssignValueColor(if green1ext then Color.GREEN else Color.RED);
def vah1ext = if IsNaN(close) then vah1ext[1] else VAHigh1;
plot vah1extp = vah1ext;
vah1extp.AssignValueColor(if green1ext then Color.GREEN else Color.RED);
def val1ext = if IsNaN(close) then val1ext[1] else VALow1;
plot val1extp = val1ext;
val1extp.AssignValueColor(if green1ext then Color.GREEN else Color.RED);
input showclouds = no;
AddCloud(if showclouds and g1ext then vahextp else Double.NaN, vah1extp, Color.DARK_GREEN, Color.DARK_GREEN);
AddCloud(if showclouds and g1ext then val1extp else Double.NaN, valextp, Color.DARK_GREEN, Color.DARK_GREEN);
AddCloud(if showclouds and r1ext then vahextp else Double.NaN, vah1extp, Color.DARK_RED, Color.DARK_RED);
AddCloud(if showclouds and r1ext then val1extp else Double.NaN, valextp,  Color.DARK_RED, Color.DARK_RED);
POC.HideBubble();
VAHigh1.HideBubble();
VALow1.HideBubble();
vahplot.HideBubble();
valplot.HideBubble();
uparrow.HideBubble();
dnarrow.HideBubble();
vahextp.HideBubble();
vah1extp.HideBubble();
valextp.HideBubble();
val1extp.HideBubble();
input showbubbleperperiod = no;
input bubblemoverperperiodhorizontal = 10;
input bubblemoverperperiodvertical  = 2;
def bubble = if period[1] != period then BarNumber() + bubblemoverperperiodhorizontal else bubble[1];
AddChartBubble(showbubbleperperiod and BarNumber() == (bubble), Max(high, VAHigh) + bubblemoverperperiodvertical * TickSize(), (VAHigh - VALow) + "\n" + (VAHigh1 - VALow1) , if green then Color.GREEN else if red then Color.RED else Color.GRAY, yes);
input showcurrentperiodbubble = no;
input x = 8;
def x1  = x + 1;
AddChartBubble(showcurrentperiodbubble and !IsNaN(close[x1]) and IsNaN(close[x]), close[x1], (VAHigh[x1] - VALow[x1]) + " :\n" + volume(period = agg), if green[x1] then Color.GREEN else if red[x1] then Color.RED else Color.GRAY);
input n = 5;
def n1 = n + 1;
input showbubblesVAvalues = no;
AddChartBubble(showbubblesVAvalues and !IsNaN(close[n1]) and IsNaN(close[n]), Round(POC[n1], 2) , "POC: " + Round(POC[n1], 2), if uppoc[n1] == 1 then Color.RED else Color.GREEN, yes);
AddChartBubble(showbubblesVAvalues and !IsNaN(close[n1]) and IsNaN(close[n]), Round(VALow1[n1], 2) , "VL: " + Round(VALow1[n1], 2), if upval[n1] == 1 then Color.RED else Color.GREEN, yes);
AddChartBubble(showbubblesVAvalues and !IsNaN(close[n1]) and IsNaN(close[n]), Round(VALow[n1], 2) , "VL1: " + Round(VALow[n1], 2), if upval1[n1] == 1 then Color.RED else Color.GREEN, yes);
AddChartBubble(showbubblesVAvalues and !IsNaN(close[n1]) and IsNaN(close[n]), Round(VAHigh1[n1], 2) , "VH: " + Round(VAHigh1[n1], 2), if upvah1[n1] == 1 then Color.RED else Color.GREEN, yes);
AddChartBubble(showbubblesVAvalues and !IsNaN(close[n1]) and IsNaN(close[n]), Round(VAHigh[n1], 2) , "VH1: " + Round(VAHigh[n1], 2), if upvah[n1] == 1 then Color.RED else Color.GREEN, yes);
#Squeeze Added
input showsqueeze = no;
def bbupper = reference BollingerBands().UpperBand;
def kcupper = KeltnerChannels().Upper_Band;
def Squeeze = bbupper - kcupper < 0;
plot Squeezeplot = if showsqueeze and Squeeze then POC else Double.NaN;
Squeezeplot.SetDefaultColor(Color.WHITE);
Squeezeplot.SetPaintingStrategy(PaintingStrategy.POINTS);
Squeezeplot.SetLineWeight(3);
Squeezeplot.HideBubble();
#Count of Periods in consecutive squeeze
rec countsq = if Squeeze then countsq[1] + 1 else 0;
rec count1sq = if !Squeeze then count1sq[1] + 1 else 0;
#Expansion Bubbles
input q = 3;
def q1 = q + 1;
AddChartBubble(showsqueeze and !IsNaN(close[q1]) and IsNaN(close[q]), POC[q1] , if Squeeze[q1] then "S " + Round(countsq[q1], 2) else "NS " + count1sq[q1] , if DMI_Oscillator()[q1] < 0 then Color.RED else Color.GREEN, no);
#COLORBARS
input pricecolor = yes;
AssignPriceColor(
if PRICECOLOR then
if dn[1] == 0 and dn == 1 then COLOR.RED else
if up[1] == 0 and up == 1 then COLOR.GREEN else
COLOR.GRAY
else
COLOR.CURRENT
);

#END OF STUDY

@Gildes and @Billions can you look at it. you all might already have it done. will be good to fit/gap and publish a final version once you're all done with your reviews.
I'm gonna test it a little will get back to you
 

Attachments

  • N7Ht3YQ.png
    N7Ht3YQ.png
    205.3 KB · Views: 188
Caution: in the developmental stage, do not use for live trading!

Something I'm chewing on now to fix the re-painter that people don't like. This uses the ADR (Average Daily Range) in sequence. just need to fit it better to current price action and boom: VBOX w/o repainter. Let me know what you guys think!

Code:
#Hint: Average Daily Range
input showlines             = yes;
input pricePerRowHeightMode = { AUTOMATIC, default TICKSIZE, CUSTOM};
input customRowHeight       = .01;
input timePerProfile        = {CHART, MINUTE, MIN2, MIN3, MIN4, MIN5, MIN10,  default  MIN15, MIN20,  MIN30, HOUR, TWOHOUR, FOURHOUR, DAY , TWODAY, THREEDAY, FOURDAY, WEEK, MONTH, "OPT EXP", BAR};
input multiplier         = 1;
input onExpansion        = no;
input profiles           = 1000;
input showPointOfControl = yes;
input showValueArea      = yes;
input valueAreaPercent   = 100.0;
input valueAreaPercent2  = 87.5;
input opacity            = 0;

def period;
def agg;
def yyyymmdd = GetYYYYMMDD();
def seconds = SecondsFromTime(0);
def month = GetYear() * 12 + GetMonth();
def day_number = DaysFromDate(First(yyyymmdd)) + GetDayOfWeek(First(yyyymmdd));
def dom = GetDayOfMonth(yyyymmdd);
def dow = GetDayOfWeek(yyyymmdd - dom + 1);
def expthismonth = (if dow > 5 then 27 else 20) - dow;
def exp_opt = month + (dom > expthismonth);
switch (timePerProfile) {
case CHART:
    period = 0;
    agg = AggregationPeriod.DAY;
case MINUTE:
    period = Floor(seconds / 60 + day_number * 24 * 60);
    agg = AggregationPeriod.MIN;
case MIN2:
    period = Floor(seconds / 120 + day_number * 24);
    agg = AggregationPeriod.TWO_MIN;
case MIN3:
    period = Floor(seconds / 180 + day_number * 24);
    agg = AggregationPeriod.THREE_MIN;
case MIN4:
    period = Floor(seconds / 240 + day_number * 24);
    agg = AggregationPeriod.FOUR_MIN;
case MIN5:
    period = Floor(seconds / 300 + day_number * 24);
    agg = AggregationPeriod.FIVE_MIN;
case MIN10:
    period = Floor(seconds / 600 + day_number * 24);
    agg = AggregationPeriod.TEN_MIN;
case MIN15:
    period = Floor(seconds / 900 + day_number * 24);
    agg = AggregationPeriod.FIFTEEN_MIN;
case MIN20:
    period = Floor(seconds / 1200 + day_number * 24);
    agg = AggregationPeriod.TWENTY_MIN;
case MIN30:
    period = Floor(seconds / 1800 + day_number * 24);
    agg = AggregationPeriod.THIRTY_MIN;
case HOUR:
    period = Floor(seconds / 3600 + day_number * 24);
    agg = AggregationPeriod.HOUR;
case TWOHOUR:
    period = Floor(seconds / 7200 + day_number * 24);
    agg = AggregationPeriod.TWO_HOURS;
case FOURHOUR:
    period = Floor(seconds / 14400 + day_number * 24);
    agg = AggregationPeriod.FOUR_HOURS;
case DAY:
    period = CountTradingDays(Min(First(yyyymmdd), yyyymmdd), yyyymmdd) - 1;
    agg = AggregationPeriod.DAY;
case TWODAY:
    period = CountTradingDays(Min(First(yyyymmdd), yyyymmdd), yyyymmdd) - 1;
    agg = AggregationPeriod.TWO_DAYS;
case THREEDAY:
    period = CountTradingDays(Min(First(yyyymmdd), yyyymmdd), yyyymmdd) - 1;
    agg = AggregationPeriod.THREE_DAYS;
case FOURDAY:
    period = CountTradingDays(Min(First(yyyymmdd), yyyymmdd), yyyymmdd) - 1;
    agg = AggregationPeriod.FOUR_DAYS;
case WEEK:
    period = Floor(day_number / 7);
    agg = AggregationPeriod.WEEK;
case MONTH:
    period = Floor(month - First(month));
    agg = AggregationPeriod.MONTH;
case "OPT EXP":
    period = exp_opt - First(exp_opt);
    agg = AggregationPeriod.DAY;
case BAR:
    period = BarNumber() - 1;
    agg = AggregationPeriod.DAY;
}


def len = 2;
def Neglen = -2;

def dayHigh = DailyHighLow(timePerProfile, len, 0, no).dailyhigh;
def dayLow = DailyHighLow(timePerProfile, len, 0, no).DailyLow;

def ADR_high = (dayHigh + dayHigh[1] + dayHigh[2] + dayHigh[3] + dayHigh[4]) / 5.406;
def ADR_low = (dayLow + dayLow[1] + dayLow[2] + dayLow[3] + dayLow[4]) / 5.24;

plot ADR_H = ADR_high;
plot ADR_L = ADR_low;


def dayHigh1 = DailyHighLow(timePerProfile, len, 0, no).dailyhigh;
def dayLow1 = DailyHighLow(timePerProfile, len, 0, no).DailyLow;

def ADR_high1 = (dayHigh1 + dayHigh1[1] + dayHigh1[2] + dayHigh1[3] + dayHigh1[4]) / 5.463;
def ADR_low1 = (dayLow1 + dayLow1[1] + dayLow1[2] + dayLow1[3] + dayLow1[4]) / 5.186;

plot ADR_H1 = ADR_high1;
plot ADR_L1 = ADR_low1;

def dayHigh2 = DailyHighLow(timePerProfile, len, 0, no).dailyhigh;
def dayLow2 = DailyHighLow(timePerProfile, len, 0, no).DailyLow;

def ADR_high2 = (dayHigh2 + dayHigh2[1] + dayHigh2[2] + dayHigh2[3] + dayHigh2[4]) / 5.28;
def ADR_low2 = (dayLow2 + dayLow2[1] + dayLow2[2] + dayLow2[3] + dayLow2[4]) / 5.32;

plot ADR_H2 = ADR_high2;
plot ADR_L2 = ADR_low2;

def dayHigh3 = DailyHighLow(timePerProfile, len, 0, no).dailyhigh;
def dayLow3 = DailyHighLow(timePerProfile, len, 0, no).DailyLow;

def ADR_high3 = (dayHigh3 + dayHigh3[1] + dayHigh3[2] + dayHigh3[3] + dayHigh3[4]) / 5.19;
def ADR_low3 = (dayLow3 + dayLow3[1] + dayLow3[2] + dayLow3[3] + dayLow3[4]) / 5.38;

plot ADR_H3 = ADR_high3;
plot ADR_L3 = ADR_low3;
 

Volatility Trading Range

VTR is a momentum indicator that shows if a stock is overbought or oversold based on its Weekly and Monthly average volatility trading range.

Download the indicator

Similar threads

Not the exact question you're looking for?

Start a new thread and receive assistance from our community.

87k+ Posts
251 Online
Create Post

Similar threads

Similar threads

The Market Trading Game Changer

Join 2,500+ subscribers inside the useThinkScript VIP Membership Club
  • Exclusive indicators
  • Proven strategies & setups
  • Private Discord community
  • ‘Buy The Dip’ signal alerts
  • Exclusive members-only content
  • Add-ons and resources
  • 1 full year of unlimited support

Frequently Asked Questions

What is useThinkScript?

useThinkScript is the #1 community of stock market investors using indicators and other tools to power their trading strategies. Traders of all skill levels use our forums to learn about scripting and indicators, help each other, and discover new ways to gain an edge in the markets.

How do I get started?

We get it. Our forum can be intimidating, if not overwhelming. With thousands of topics, tens of thousands of posts, our community has created an incredibly deep knowledge base for stock traders. No one can ever exhaust every resource provided on our site.

If you are new, or just looking for guidance, here are some helpful links to get you started.

What are the benefits of VIP Membership?
VIP members get exclusive access to these proven and tested premium indicators: Buy the Dip, Advanced Market Moves 2.0, Take Profit, and Volatility Trading Range. In addition, VIP members get access to over 50 VIP-only custom indicators, add-ons, and strategies, private VIP-only forums, private Discord channel to discuss trades and strategies in real-time, customer support, trade alerts, and much more. Learn all about VIP membership here.
How can I access the premium indicators?
To access the premium indicators, which are plug and play ready, sign up for VIP membership here.
Back
Top