
Thank you sir , Does he have a site or did you save these scripts from other places ?@Buckbull He sure does, here is the companion bear flag scan. Hope this helps
# Bear Flag on Pole - SCAN
# Mobius
# V01.02.2014
# Price trend - Downward leading to the pattern. The price should fall for at least 2 months.
# Shape - A consolidation pattern forms. It usually doesn't look like a flag or pennant, just a pause in the price decline.
# Volume - Recedes for best performance
# Confirmation - The pattern confirms as valid when price closes below the lowest trough in the pattern.
def o = open;
def h = high;
def l = low;
def c = close;
def BBl = BollingerBands().LowerBand;
def KCl = KeltnerChannels().Lower_Band;
def downward = isDescending(close, 42);
def p = (c[42] / lowest(l, 21)) > 1.2;
def squeezeLow = if BBl < KCl
then squeezeLow[1]
else if BBl crosses above KCl
then l
else if BBl > KCl and l < squeezeLow[1]
then l
else squeezeLow[1];
def NotSqueeze = BBl < KCl;
plot Flag = if downward and
p and
NotSqueeze and
close crosses below squeezeLow
then 1
else Double.NaN;
# End Code Bear Flag
You are using an out of date browser. It may not display this or other websites correctly.
You should upgrade or use an alternative browser.
You should upgrade or use an alternative browser.
Bull Flag and Bear Flag Formations for ThinkorSwim
- Thread starter BenTen
- Start date
Join useThinkScript to post your question to a community of 21,000+ developers and traders.
") very well done. Just a thought - perhaps you might like to explore combining both of these indicators and see what sort of results you might get
very well done. Just a thought - perhaps you might like to explore combining both of these indicators and see what sort of results you might getKen Rose updated the BFBF Indicator to be more sensitive to trend , here's the link https://tos.mx/6xou4xs
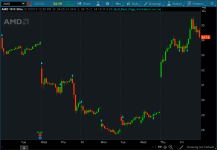
Does anybody understand how to use this watchlist quote? As I uploaded this in TOS and applied indicator from post#1, but still cannot see how it correllates between each other. Example stock: FND. It shows in Watchlist (5m agg) sign down, but in chart there is no arrow in such case.
Below is the link to see described scenario:
https://prnt.sc/pxr6ao
@tsleong Here is a nice tutorial on how to create a custom watchlist on TOS
https://intercom.help/simpler-tradi...ow-to-create-a-custom-watchlist-column-in-tos
https://intercom.help/simpler-tradi...ow-to-create-a-custom-watchlist-column-in-tos
Use it on the Daily not 5 min .Does anybody understand how to use this watchlist quote? As I uploaded this in TOS and applied indicator from post#1, but still cannot see how it correllates between each other. Example stock: FND. It shows in Watchlist (5m agg) sign down, but in chart there is no arrow in such case.
Below is the link to see described scenario:
https://prnt.sc/pxr6ao
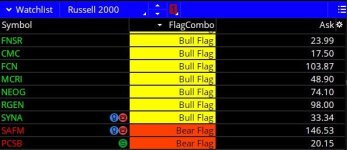
I am confused on where to put these source codes. example watchlist and scanner. Please helpKen Rose of TD Ameritrade recently shared a watchlist column that shows potential bull flag and bear flag patterns being formed. I modified it a little so that it can also plot bull flag signal and also bear flag signal on your chart.

Here is the watchlist column:
Code:# [email protected] CBLOLD Search #To use for scan place # signs before 2 Addlabel statements and change "def" before trigger statement to "plot" ##############Bull Flag def StockPrice = close>=10; def trend = simpleMovingAvg("length"=30)> (simpleMovingAvg("length"=30)[5]); def MacdLow = macdHistogram(8,17,9)[1]< macdHistogram(8,17,9)[2]and close[1]<close[2] and close>high[1]; #def Momentum = macdHistogram(8,17,9) > macdHistogram(8,17,9)[1]; ##############Bear Flag def StockPriceBear = close>=10; def trendBear = simpleMovingAvg("length"=30)< (simpleMovingAvg("length"=30)[5]); def MacdHighBear = macdHistogram(8,17,9)[1]> macdHistogram(8,17,9)[2]and close[1]>close[2] and close<low[1]; ######################################### #def trigger = trend and momentum and MacdLow; def Bulltrigger = trend and MacdLow; def BearTrigger = TrendBear and MacdHighBear; #AddLabel(yes, if Bulltrigger then "Bull Flag" else " ",Color.PLUM); AddLabel(yes, if Bulltrigger then "Bull Flag" else if BearTrigger then "Bear Flag" else " ",Color.black); AssignBackgroundColor(if Bulltrigger then color.YELLOW else if bearTrigger then color.LIGHT_RED else color.WHITE);
Shareable Link: https://tos.mx/nGYN7x

Here is the indicator
Code:# Bull Flag and Bear Flag Indicator # Original from https://twitter.com/KRose_TDA/status/1158974048518328320 # [email protected] CBLOLD Search #To use for scan place # signs before 2 Addlabel statements and change "def" before trigger statement to "plot" # Modified by BenTen at useThinkScript to Display Signals on Chart ##############Bull Flag def StockPrice = close>=10; def trend = simpleMovingAvg("length"=30)> (simpleMovingAvg("length"=30)[5]); def MacdLow = macdHistogram(8,17,9)[1]< macdHistogram(8,17,9)[2]and close[1]<close[2] and close>high[1]; #def Momentum = macdHistogram(8,17,9) > macdHistogram(8,17,9)[1]; ##############Bear Flag def StockPriceBear = close>=10; def trendBear = simpleMovingAvg("length"=30)< (simpleMovingAvg("length"=30)[5]); def MacdHighBear = macdHistogram(8,17,9)[1]> macdHistogram(8,17,9)[2]and close[1]>close[2] and close<low[1]; ######################################### #def trigger = trend and momentum and MacdLow; def Bulltrigger = trend and MacdLow; def BearTrigger = TrendBear and MacdHighBear; #AddLabel(yes, if Bulltrigger then "Bull Flag" else " ",Color.PLUM); #AddLabel(yes, if Bulltrigger then "Bull Flag" else if BearTrigger then "Bear Flag" else " ",Color.black); #AssignBackgroundColor(if Bulltrigger then color.YELLOW else if bearTrigger then color.LIGHT_RED else color.WHITE); # Plot Confirmed Signals plot bullish = Bulltrigger; bullish.SetPaintingStrategy(PaintingStrategy.BOOLEAN_ARROW_UP); bullish.SetDefaultColor(Color.CYAN); bullish.SetLineWeight(1); plot bearish = BearTrigger; bearish.SetPaintingStrategy(PaintingStrategy.BOOLEAN_ARROW_DOWN); bearish.SetDefaultColor(Color.CYAN); bearish.SetLineWeight(1);
Shareable link: https://tos.mx/5bxCeS
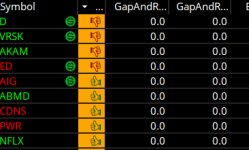
New Watchlist Update

Ken Rose recently updated his watchlist column. Here is the new code with a bit more customization
Code:# Follow @KRose_TDA on twitter for updates to this and other scripts # Thanks to Alan Burch for emoji enhancement # Thumbs up = potential Bull Flag - Thumbs Down potential bear flag # To use for scan place # signs before 2 Addlabel statements. # For Bull Flag Scan change "def" before Bulltrigger statement to "plot" # For Bear Flag scan change "def" before BearTrigger Statement to "Plot" #Enter desired distance of flag by changing FlagDistance value def FlagDistance = .75; #Percent of ATR from high/low ##############Bull Flag def StockPrice = close>=10; ##############ThinkScriptWebcast################## def FATR = ATR(); def trigATR = (highest(high,5)-close)> (FlagDistance*FATR); #flag slopping down def PriceSma = close>simpleMovingAvg("length"=30); #Trend still in force ########################################## def trend = simpleMovingAvg("length"=30)> (simpleMovingAvg("length"=30)[5]); def MacdLow = macdHistogram(8,17,9)[1]< macdHistogram(8,17,9)[2]and close[1]<close[2]; #def Momentum = macdHistogram(8,17,9) > macdHistogram(8,17,9)[1]; ##############Bear Flag def StockPriceBear = close>=10; def trendBear = simpleMovingAvg("length"=30)< (simpleMovingAvg("length"=30)[5]); def MacdHighBear = macdHistogram(8,17,9)[1]> macdHistogram(8,17,9)[2]and close[1]>close[2]; ######################################### ##############ThinkScriptWebcast################## def BFATR = reference ATR(); def BtrigATR = (close-lowest(low,5))> (FlagDistance*FATR); #flag slopping up def BPriceSma = close<simpleMovingAvg("length"=30); #Trend still in force ########################################## def Bulltrigger = trend and MacdLow and trigATR and PriceSma; def BearTrigger = TrendBear and MacdHighBear and BtrigATR and BPriceSma ; AssignBackgroundColor(if Bulltrigger then color.YELLOW else if bearTrigger then color.LIGHT_RED else color.WHITE); ########################################################## AddLabel(yes, if Bulltrigger then "👍" else if BearTrigger then "👎" else " ", if BearTrigger then Color.dark_red else if Bulltrigger then Color.dark_GREEN else Color.ORANGE); AssignBackgroundColor(color.light_ORANGE); ############################################################
Shareable Link: https://tos.mx/6xou4xs
Attachments
@dolcea23 Indeed, there sure are differences in where to deploy code for studies, strategies, scanner, watchlists, etc. Have a look through the tutorial section that @BenTen and many other contributors have posted and you'll soon get the hang of it
https://usethinkscript.com/forums/tutorials.4/
https://usethinkscript.com/forums/tutorials.4/
I know how to input the indicator but where do I input the scanner and watchlist@dolcea23 Indeed, there sure are differences in where to deploy code for studies, strategies, scanner, watchlists, etc. Have a look through the tutorial section that @BenTen and many other contributors have posted and you'll soon get the hang of it
https://usethinkscript.com/forums/tutorials.4/
So I put the custom watch list second link from been and added the indicator. Im now sure how it correlates because stock list show bull yet the flag is bearish on chart. Please helpGo into your watchlist and click the little gear that says customize .then type in whatever you named it it will appear double click it and it will be put in your watchlist .
what stock are you referring to ?So I put the custom watch list second link from been and added the indicator. Im now sure how it correlates because stock list show bull yet the flag is bearish on chart. Please help
Yes go to edit script and in the top of the Box you will see timeframe and will see the letter D click on that and you could switch to a different time frameIs there a way to change the timeframe on the watchlist to 30 Min or something else, I think its default to 1 day, but in the code, I didn't see a timeframe location. It does look awesome by the way.
joshua74133
Member
im looking for something that will draw the flag on the chart.
@Buckbull You sure are a fan of Ken Rose it seems! Here is your scan code, it is configured for a bull scan. To change this to a bear scan, just comment out the bull scan line at the end of the code and uncomment the bear scan. The scanner can ONLY have one active plot at any time
Code:
# Follow @KRose_TDA on twitter for updates to this and other scripts
# Thanks to Alan Burch for emoji enhancement
# For Bull Flag Scan change "def" before Bulltrigger statement to "plot"
# For Bear Flag scan change "def" before BearTrigger Statement to "Plot"

def FlagDistance = .75; #Percent of ATR from high/low

# Bull Flag
def StockPrice = close>=10;
def FATR = ATR();
def trigATR = (highest(high,5)-close)> (FlagDistance*FATR); #flag slopping down
def PriceSma = close>simpleMovingAvg("length"=30); #Trend still in force
def trend = simpleMovingAvg("length"=30)> (simpleMovingAvg("length"=30)[5]);
def MacdLow = macdHistogram(8,17,9)[1]< macdHistogram(8,17,9)[2]and close[1]<close[2];
#def Momentum = macdHistogram(8,17,9) > macdHistogram(8,17,9)[1];

# Bear Flag
def StockPriceBear = close>=10;
def trendBear = simpleMovingAvg("length"=30)< (simpleMovingAvg("length"=30)[5]);
def MacdHighBear = macdHistogram(8,17,9)[1]> macdHistogram(8,17,9)[2]and close[1]>close[2];
def BFATR = reference ATR();
def BtrigATR = (close-lowest(low,5))> (FlagDistance*FATR); #flag slopping up
def BPriceSma = close<simpleMovingAvg("length"=30); #Trend still in force

# Delete (#) the plot not needed

plot Bulltrigger = trend and MacdLow and trigATR and PriceSma;
# plot BearTrigger = TrendBear and MacdHighBear and BtrigATR and BPriceSma ;| Thread starter | Similar threads | Forum | Replies | Date |
|---|---|---|---|---|
| C | Bull Bear Power VOID Oscillator For ThinkOrSwim | Indicators | 21 | |
| M | Automatic patterns studies, Bull, Bear, Bullish only & Bearish only For ThinkOrSwim | Indicators | 8 | |
| P | High Tight Flag Scanner (Leif Soreide) For ThinkOrSwim | Indicators | 17 |
Similar threads
-
-
Automatic patterns studies, Bull, Bear, Bullish only & Bearish only For ThinkOrSwim
- Started by mourningwood4521
- Replies: 8
-
Not the exact question you're looking for?
Start a new thread and receive assistance from our community.
87k+
Posts
1298
Online
Similar threads
-
-
Automatic patterns studies, Bull, Bear, Bullish only & Bearish only For ThinkOrSwim
- Started by mourningwood4521
- Replies: 8
-
Similar threads
-
-
Automatic patterns studies, Bull, Bear, Bullish only & Bearish only For ThinkOrSwim
- Started by mourningwood4521
- Replies: 8
-
The Market Trading Game Changer
Join 2,500+ subscribers inside the useThinkScript VIP Membership Club
- Exclusive indicators
- Proven strategies & setups
- Private Discord community
- ‘Buy The Dip’ signal alerts
- Exclusive members-only content
- Add-ons and resources
- 1 full year of unlimited support
Frequently Asked Questions
What is useThinkScript?
useThinkScript is the #1 community of stock market investors using indicators and other tools to power their trading strategies. Traders of all skill levels use our forums to learn about scripting and indicators, help each other, and discover new ways to gain an edge in the markets.
How do I get started?
We get it. Our forum can be intimidating, if not overwhelming. With thousands of topics, tens of thousands of posts, our community has created an incredibly deep knowledge base for stock traders. No one can ever exhaust every resource provided on our site.
If you are new, or just looking for guidance, here are some helpful links to get you started.
- The most viewed thread:
https://usethinkscript.com/threads/repainting-trend-reversal-for-thinkorswim.183/ - Our most popular indicator:
https://usethinkscript.com/threads/buy-the-dip-indicator-for-thinkorswim.3553/ - Answers to frequently asked questions:
https://usethinkscript.com/threads/answers-to-commonly-asked-questions.6006/
What are the benefits of VIP Membership?
VIP members get exclusive access to these proven and tested premium indicators: Buy the Dip, Advanced Market Moves 2.0, Take Profit, and Volatility Trading Range. In addition, VIP members get access to over 50 VIP-only custom indicators, add-ons, and strategies, private VIP-only forums, private Discord channel to discuss trades and strategies in real-time, customer support, trade alerts, and much more. Learn all about VIP membership here.
How can I access the premium indicators?
To access the premium indicators, which are plug and play ready, sign up for VIP membership here.