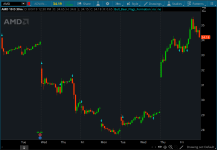
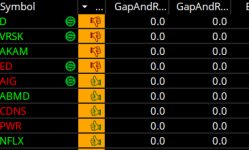
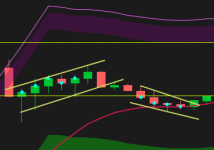
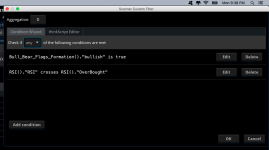
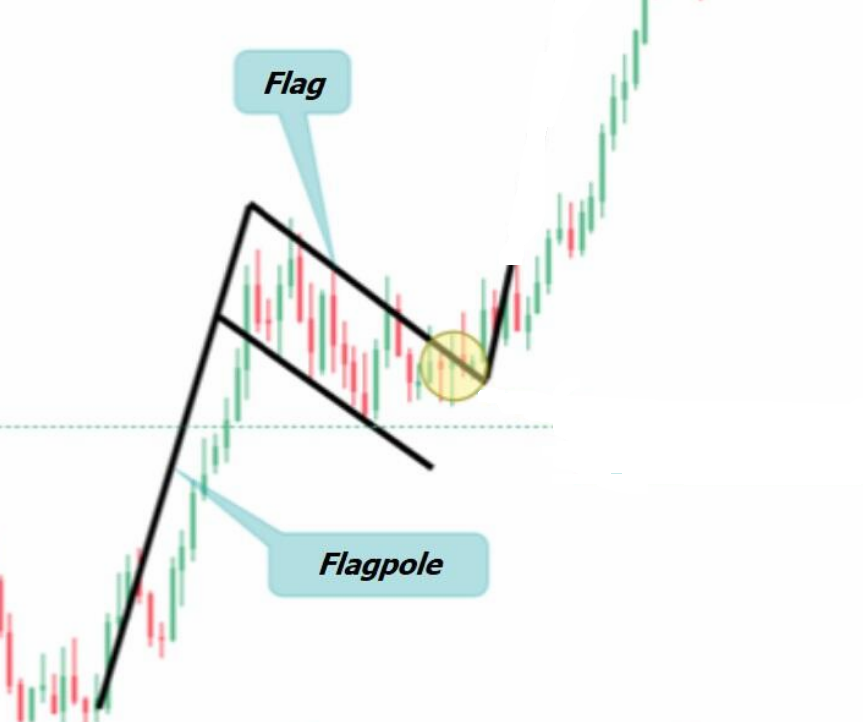
Ken Rose of TD Ameritrade shared a watchlist column that shows potential bull flag and bear flag patterns being formed.
This forum version is modified to also plot bull flag signal and also bear flag signal on your chart.
To trade a flag pattern, wait for the price to break above the flag.
Set a stop loss below the lowest price of the flag.


This forum version is modified to also plot bull flag signal and also bear flag signal on your chart.
To trade a flag pattern, wait for the price to break above the flag.
Set a stop loss below the lowest price of the flag.

Here is the indicator
Shareable link: http://tos.mx/c4jNKVn
Code:
# Follow @KRose_TDA on twitter for updates to this and other scripts
# Thanks to Alan Burch for emoji enhancement
# Thumbs up = potential Bull Flag - Thumbs Down potential bear flag
# To use for scan place # signs before 2 Addlabel statements.
# For Bull Flag Scan change "def" before Bulltrigger statement to "plot"
# For Bear Flag scan change "def" before BearTrigger Statement to "Plot"
#Enter desired distance of flag by changing FlagDistance value
def FlagDistance = .75; #Percent of ATR from high/low
##############Bull Flag
def StockPrice = close>=10;

##############ThinkScriptWebcast##################
def FATR = ATR();
def trigATR = (highest(high,5)-close)> (FlagDistance*FATR); #flag slopping down
def PriceSma = close>simpleMovingAvg("length"=30); #Trend still in force

##########################################
def trend = simpleMovingAvg("length"=30)> (simpleMovingAvg("length"=30)[5]);
def MacdLow = macdHistogram(8,17,9)[1]< macdHistogram(8,17,9)[2]and close[1]<close[2];
#def Momentum = macdHistogram(8,17,9) > macdHistogram(8,17,9)[1];
##############Bear Flag
def StockPriceBear = close>=10;
def trendBear = simpleMovingAvg("length"=30)< (simpleMovingAvg("length"=30)[5]);
def MacdHighBear = macdHistogram(8,17,9)[1]> macdHistogram(8,17,9)[2]and close[1]>close[2];
#########################################
##############ThinkScriptWebcast##################
def BFATR = reference ATR();
def BtrigATR = (close-lowest(low,5))> (FlagDistance*FATR); #flag slopping up
def BPriceSma = close<simpleMovingAvg("length"=30); #Trend still in force

##########################################

def Bulltrigger = trend and MacdLow and trigATR and PriceSma;
def BearTrigger = TrendBear and MacdHighBear and BtrigATR and BPriceSma  ;
############################################################

#AddLabel(yes, if Bulltrigger then "Bull Flag" else " ",Color.PLUM);
#AddLabel(yes, if Bulltrigger then "Bull Flag" else if BearTrigger then "Bear Flag" else " ",Color.black);
#AssignBackgroundColor(if Bulltrigger then color.YELLOW else if bearTrigger then color.LIGHT_RED else color.WHITE);

# Plot Confirmed Signals
plot bullish = Bulltrigger;
bullish.SetPaintingStrategy(PaintingStrategy.BOOLEAN_ARROW_UP);
bullish.SetDefaultColor(Color.CYAN);
bullish.SetLineWeight(1);
plot bearish = BearTrigger;
bearish.SetPaintingStrategy(PaintingStrategy.BOOLEAN_ARROW_DOWN);
bearish.SetDefaultColor(Color.CYAN);
bearish.SetLineWeight(1);
Watchlist
Shareable Link: https://tos.mx/6xou4xs
Code:
# Follow @KRose_TDA on twitter for updates to this and other scripts
# Thanks to Alan Burch for emoji enhancement
# Thumbs up = potential Bull Flag - Thumbs Down potential bear flag
# To use for scan place # signs before 2 Addlabel statements.
# For Bull Flag Scan change "def" before Bulltrigger statement to "plot"
# For Bear Flag scan change "def" before BearTrigger Statement to "Plot"
#Enter desired distance of flag by changing FlagDistance value
def FlagDistance = .75; #Percent of ATR from high/low
##############Bull Flag
def StockPrice = close>=10;

##############ThinkScriptWebcast##################
def FATR = ATR();
def trigATR = (highest(high,5)-close)> (FlagDistance*FATR); #flag slopping down
def PriceSma = close>simpleMovingAvg("length"=30); #Trend still in force

##########################################
def trend = simpleMovingAvg("length"=30)> (simpleMovingAvg("length"=30)[5]);
def MacdLow = macdHistogram(8,17,9)[1]< macdHistogram(8,17,9)[2]and close[1]<close[2];
#def Momentum = macdHistogram(8,17,9) > macdHistogram(8,17,9)[1];
##############Bear Flag
def StockPriceBear = close>=10;
def trendBear = simpleMovingAvg("length"=30)< (simpleMovingAvg("length"=30)[5]);
def MacdHighBear = macdHistogram(8,17,9)[1]> macdHistogram(8,17,9)[2]and close[1]>close[2];
#########################################
##############ThinkScriptWebcast##################
def BFATR = reference ATR();
def BtrigATR = (close-lowest(low,5))> (FlagDistance*FATR); #flag slopping up
def BPriceSma = close<simpleMovingAvg("length"=30); #Trend still in force

##########################################

def Bulltrigger = trend and MacdLow and trigATR and PriceSma;
def BearTrigger = TrendBear and MacdHighBear and BtrigATR and BPriceSma  ;

AssignBackgroundColor(if Bulltrigger then color.YELLOW else if bearTrigger then color.LIGHT_RED else color.WHITE);

##########################################################
AddLabel(yes, if Bulltrigger then "👍" else if BearTrigger then "👎" else " ", if BearTrigger  then Color.dark_red else if Bulltrigger then Color.dark_GREEN else Color.ORANGE);
AssignBackgroundColor(color.light_ORANGE);
############################################################
Attachments
Last edited by a moderator:

