Bull Flag and Bear Flag Formations for ThinkorSwim

BenTen

Administrative
Staff member
Staff
VIP
Lifetime
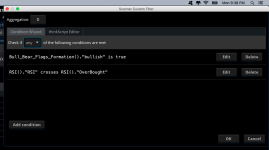
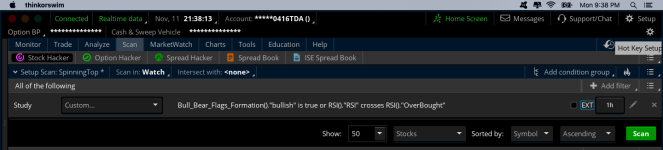
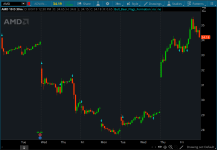
Ken Rose of TD Ameritrade shared a watchlist column that shows potential bull flag and bear flag patterns being formed.

This forum version is modified to also plot bull flag signal and also bear flag signal on your chart.
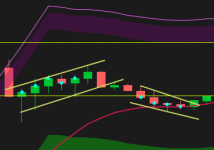
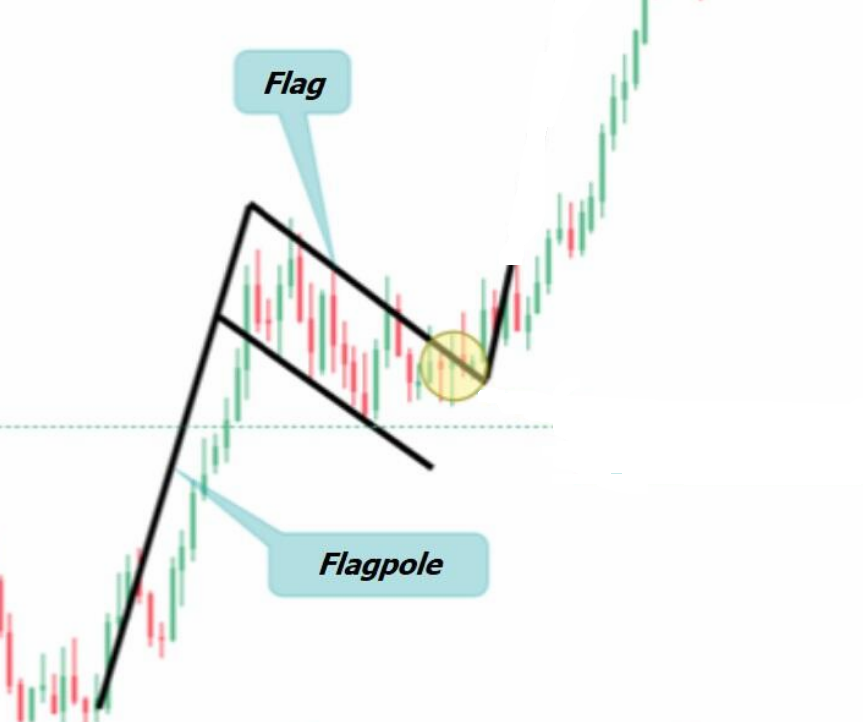
To trade a flag pattern, wait for the price to break above the flag.
Set a stop loss below the lowest price of the flag.
k3vh523.png

mLRHr5G.png

Here is the indicator

Shareable link: http://tos.mx/c4jNKVn
Code:
# Follow @KRose_TDA on twitter for updates to this and other scripts
# Thanks to Alan Burch for emoji enhancement
# Thumbs up = potential Bull Flag - Thumbs Down potential bear flag
# To use for scan place # signs before 2 Addlabel statements.
# For Bull Flag Scan change "def" before Bulltrigger statement to "plot"
# For Bear Flag scan change "def" before BearTrigger Statement to "Plot"
#Enter desired distance of flag by changing FlagDistance value
def FlagDistance = .75; #Percent of ATR from high/low
##############Bull Flag
def StockPrice = close>=10;

##############ThinkScriptWebcast##################
def FATR = ATR();
def trigATR = (highest(high,5)-close)> (FlagDistance*FATR); #flag slopping down
def PriceSma = close>simpleMovingAvg("length"=30); #Trend still in force

##########################################
def trend = simpleMovingAvg("length"=30)> (simpleMovingAvg("length"=30)[5]);
def MacdLow = macdHistogram(8,17,9)[1]< macdHistogram(8,17,9)[2]and close[1]<close[2];
#def Momentum = macdHistogram(8,17,9) > macdHistogram(8,17,9)[1];
##############Bear Flag
def StockPriceBear = close>=10;
def trendBear = simpleMovingAvg("length"=30)< (simpleMovingAvg("length"=30)[5]);
def MacdHighBear = macdHistogram(8,17,9)[1]> macdHistogram(8,17,9)[2]and close[1]>close[2];
#########################################
##############ThinkScriptWebcast##################
def BFATR = reference ATR();
def BtrigATR = (close-lowest(low,5))> (FlagDistance*FATR); #flag slopping up
def BPriceSma = close<simpleMovingAvg("length"=30); #Trend still in force

##########################################

def Bulltrigger = trend and MacdLow and trigATR and PriceSma;
def BearTrigger = TrendBear and MacdHighBear and BtrigATR and BPriceSma  ;
############################################################

#AddLabel(yes, if Bulltrigger then "Bull Flag" else " ",Color.PLUM);
#AddLabel(yes, if Bulltrigger then "Bull Flag" else if BearTrigger then "Bear Flag" else " ",Color.black);
#AssignBackgroundColor(if Bulltrigger then color.YELLOW else if bearTrigger then color.LIGHT_RED else color.WHITE);

# Plot Confirmed Signals
plot bullish = Bulltrigger;
bullish.SetPaintingStrategy(PaintingStrategy.BOOLEAN_ARROW_UP);
bullish.SetDefaultColor(Color.CYAN);
bullish.SetLineWeight(1);
plot bearish = BearTrigger;
bearish.SetPaintingStrategy(PaintingStrategy.BOOLEAN_ARROW_DOWN);
bearish.SetDefaultColor(Color.CYAN);
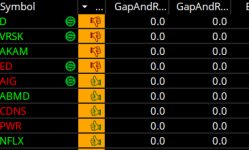
bearish.SetLineWeight(1);

Watchlist

Shareable Link: https://tos.mx/6xou4xs
974gKFy.png

Code:
# Follow @KRose_TDA on twitter for updates to this and other scripts
# Thanks to Alan Burch for emoji enhancement
# Thumbs up = potential Bull Flag - Thumbs Down potential bear flag
# To use for scan place # signs before 2 Addlabel statements.
# For Bull Flag Scan change "def" before Bulltrigger statement to "plot"
# For Bear Flag scan change "def" before BearTrigger Statement to "Plot"
#Enter desired distance of flag by changing FlagDistance value
def FlagDistance = .75; #Percent of ATR from high/low
##############Bull Flag
def StockPrice = close>=10;

##############ThinkScriptWebcast##################
def FATR = ATR();
def trigATR = (highest(high,5)-close)> (FlagDistance*FATR); #flag slopping down
def PriceSma = close>simpleMovingAvg("length"=30); #Trend still in force

##########################################
def trend = simpleMovingAvg("length"=30)> (simpleMovingAvg("length"=30)[5]);
def MacdLow = macdHistogram(8,17,9)[1]< macdHistogram(8,17,9)[2]and close[1]<close[2];
#def Momentum = macdHistogram(8,17,9) > macdHistogram(8,17,9)[1];
##############Bear Flag
def StockPriceBear = close>=10;
def trendBear = simpleMovingAvg("length"=30)< (simpleMovingAvg("length"=30)[5]);
def MacdHighBear = macdHistogram(8,17,9)[1]> macdHistogram(8,17,9)[2]and close[1]>close[2];
#########################################
##############ThinkScriptWebcast##################
def BFATR = reference ATR();
def BtrigATR = (close-lowest(low,5))> (FlagDistance*FATR); #flag slopping up
def BPriceSma = close<simpleMovingAvg("length"=30); #Trend still in force

##########################################

def Bulltrigger = trend and MacdLow and trigATR and PriceSma;
def BearTrigger = TrendBear and MacdHighBear and BtrigATR and BPriceSma  ;

AssignBackgroundColor(if Bulltrigger then color.YELLOW else if bearTrigger then color.LIGHT_RED else color.WHITE);

##########################################################
AddLabel(yes, if Bulltrigger then "👍" else if BearTrigger then "👎" else " ", if BearTrigger  then Color.dark_red else if Bulltrigger then Color.dark_GREEN else Color.ORANGE);
AssignBackgroundColor(color.light_ORANGE);
############################################################
 

Attachments

  • mLRHr5G.png
    mLRHr5G.png
    71.9 KB · Views: 249
  • 974gKFy.png
    974gKFy.png
    14.7 KB · Views: 253
Last edited by a moderator:

Join useThinkScript to post your question to a community of 21,000+ developers and traders.

@Steve2286 There is already a built-in one in ThinkorSwim called IntradayFlagFormation. Here is what it looks like:

QoYnKo9.png


Here is the code if you're interested or you can look it up inside the Studies section and add it.

Rich (BB code):
#
# TD Ameritrade IP Company, Inc. (c) 2014-2019
#

script VariableMinOffset {
    input price = close;
    input length = 0;

    plot VMin;
    if !IsNaN(price) and !IsNaN(length) {
        VMin = fold i = 0 to length with o do if GetValue(price, i) < GetValue(price, o) then i else o;
    } else {
        VMin = Double.NaN;
    }
}

script VariableLRS {
    input price = close;
    input length = 0;

    plot VLRS;
    if !IsNaN(price) and length != 1 {
        VLRS = 6 * ( ( fold i1 = 0 to length with s1 do s1 + (length - i1) * GetValue(price, i1) ) / ( (1 + length) / 2 * length ) - ( fold i2 = 0 to length with s2 do s2 + GetValue(price, i2) ) / length ) / (length - 1);
    } else if length == 1 {
        VLRS = 0;
    } else {
        VLRS = Double.NaN;
    }
}

input maxFlagLength = 15;
input maxFlagHeight = 2.5;
input maxPoleLength = 23;
input minPoleHeight = 5.5;
input upTrendLength = 70;
input minAtrPercentChange = 5.0;

Assert(maxPoleLength > 0, "'maxPoleLength' must be positive: " + maxPoleLength);

def x1 = GetMaxValueOffset(close, maxFlagLength)[2] + 2;
def x2 = x1 + 1;
def lfOffset = VariableMinOffset(close, x2);
def lf = GetValue(close, lfOffset);
def top = Max(GetValue(close, x1), GetValue(close, x1 + 1));
def atr = Average(TrueRange(high,  close,  low),  40);
def LRSX = VariableLRS(close[1], x1);
def LRSX1 = VariableLRS(close, x1);
def LRSX2;
if x1 == 2 {
    LRSX2 = LRSX2[1];
} else if x1 > 2 {
    LRSX2 = VariableLRS(close[2], x1 - 1);
} else {
    LRSX2 = Double.NaN;
}

def condition1 = top - lf < maxFlagHeight * atr and x2 > 2 and x2 <= maxFlagLength;
def condition2 =  if IsNaN(LRSX) or IsNaN(LRSX1) or IsNaN(LRSX2) then no else LRSX < 0 and (LRSX1 < 0 or LRSX2 < 0);
def y23 = VariableMinOffset(close, maxPoleLength + x2);
def bottom = GetValue(close, y23);
def pole = top - bottom;
def condition3 = pole > minPoleHeight * atr and y23 > x2;
def condition4 = bottom - Lowest(low, upTrendLength) > 0;
def condition5 = (atr / GetValue(atr, y23) - 1) * 100 > minAtrPercentChange;

plot Flag = condition1 and condition2 and condition3 and condition4 and condition5;
Flag.SetPaintingStrategy(PaintingStrategy.BOOLEAN_POINTS);
Flag.SetLineWeight(3);
 

Attachments

  • QoYnKo9.png
    QoYnKo9.png
    13.2 KB · Views: 157
Last edited:
best way to see is, if it works in mobile, it probably is not repainting. But that is just my observation. It may not be true. Although all the repainting indicators dont work on mobile
 
@BenTen Is there a way to Put this into a scan and specify that the Stochrsi on the 1 hr chart be below 20 or above 80 . What i do is I am looking at the 1 hr to make an entry to go long So If a stock fired a bull flag I would want the 1 hr stochrsi to be in oversold territory to make an entry and if the bear flag fired off I would want the 1 hr Stochrsi to be in Overbrought territory . Hope you can help . Thanks
 
Hello, what is the best time frame for the scan? Yesterday (11/11/19) SQ was shown as Bullish and today it is down, MCD was shown as bearish and today it is up. Any suggestions?
 
I put it in a watch list https://tos.mx/Nn4Oje1 criteria $20.00 stock with a volume at or above 250,000. then I add the Bullflag Bearflag into my watchlist . I just go through the watchlist seeing where the MA's are and where the candle is in relation to the BB whether they are pointed up, down or flat . Thats what dictates if I get into trade or not
 
I put it in a watch list https://tos.mx/Nn4Oje1 criteria $20.00 stock with a volume at or above 250,000. then I add the Bullflag Bearflag into my watchlist . I just go through the watchlist seeing where the MA's are and where the candle is in relation to the BB whether they are pointed up, down or flat . Thats what dictates if I get into trade or not
Sorry for the dumb question- what is BB -Bollinger Band or something else?
 
I put it in a watch list https://tos.mx/Nn4Oje1 criteria $20.00 stock with a volume at or above 250,000. then I add the Bullflag Bearflag into my watchlist . I just go through the watchlist seeing where the MA's are and where the candle is in relation to the BB whether they are pointed up, down or flat . Thats what dictates if I get into trade or not
Great Thanks
 
@Buckbull I still don’t understand what you’re trying to do. Based on the screenshot you sent, that’s not you how setup the scanner.
 
OK now that i figured it out I want something like this. on the Daily i want the scan to alert me when the bear flag is done and i would like the rsi to be overbrought on the 1 hr . But im not sure if im telling the rsi the right thing . Not sure what all the center column stuff means , for example (true ,false , crosses below,crosses above all of that .
Screenshot%20877.png
 
@Buckbull Glad you’re on the right track.

The daily scanner looks correct. Its looking for bear flag signal on the current bar of the daily chart. The RSI doesn’t seem correct though. Adjust it to RSI crosses below Overbought.
 

Similar threads

Not the exact question you're looking for?

Start a new thread and receive assistance from our community.

87k+ Posts
457 Online
Create Post

Similar threads

Similar threads

The Market Trading Game Changer

Join 2,500+ subscribers inside the useThinkScript VIP Membership Club
  • Exclusive indicators
  • Proven strategies & setups
  • Private Discord community
  • ‘Buy The Dip’ signal alerts
  • Exclusive members-only content
  • Add-ons and resources
  • 1 full year of unlimited support

Frequently Asked Questions

What is useThinkScript?

useThinkScript is the #1 community of stock market investors using indicators and other tools to power their trading strategies. Traders of all skill levels use our forums to learn about scripting and indicators, help each other, and discover new ways to gain an edge in the markets.

How do I get started?

We get it. Our forum can be intimidating, if not overwhelming. With thousands of topics, tens of thousands of posts, our community has created an incredibly deep knowledge base for stock traders. No one can ever exhaust every resource provided on our site.

If you are new, or just looking for guidance, here are some helpful links to get you started.

What are the benefits of VIP Membership?
VIP members get exclusive access to these proven and tested premium indicators: Buy the Dip, Advanced Market Moves 2.0, Take Profit, and Volatility Trading Range. In addition, VIP members get access to over 50 VIP-only custom indicators, add-ons, and strategies, private VIP-only forums, private Discord channel to discuss trades and strategies in real-time, customer support, trade alerts, and much more. Learn all about VIP membership here.
How can I access the premium indicators?
To access the premium indicators, which are plug and play ready, sign up for VIP membership here.
Back
Top