Auto Pivot Points Support & Resistance Indicator for ThinkorSwim

BenTen

Administrative
Staff member
Staff
VIP
Lifetime
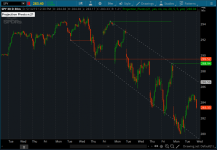
If you're having trouble with drawing trend lines, support and resistance levels then this indicator can help. It's called Projection Pivots, developed by Mobius for ThinkorSwim.

Upon adding the indicator, it will plot several trend lines, support, and resistance channels based on critical pivot points of the stock.

F0AXsHf.png


What I normally do is load this up at the end of each trading day and plot new S/R areas onto my chart based on the suggestion of the Projection Pivots indicator. I would also do this at the end of the week as well. It's important that you have these levels up to date on your chart.

thinkScript Code

Rich (BB code):
#ProjectionPivots_v03_JQ
#03.04.2019
#Original Code and Concept by Mobius:
# V01.08.2012 Projection Pivots
# mobius

# Notes:
# 03.04.2019 added linits on extensions
# 03.05.2019 adjusted limits on extensions by adding user input upper and lower extenion percent limits

#declare Once_Per_Bar;
#Inputs
input n = 21;
input showLines = yes;
input showValues = no;
input showBarNumbers = no;
input ExtensionLengthBars = 20; # added to control length of Entension
input UpperExtensionPercentLimit = 5;
input LowerExtensionPercentLimit = 5;
input DisplayLabel = yes;    #JQ 7.8.2018 added
    addlabel (DisplayLabel, "Projection Pivots n:" + n + " " , color.WHITE);    #JQ 7.8.2018 added

 
# Universal Header _v030429019 _JQ
#     code from various sources including Mobius, NoLongerNube and others
# Comment out unnecessary portions to preserve tos memory and enhance speed

# Universal Definitions using Padawan variable naming convention (JQ) v03.04.2019
# iData Definitions
    def vHigh = high;  # creates the variable vHigh.  Use of the variable reduce data calls to tos iData server
#    def initHigh =  CompoundValue(1, high, high);  # creates and initialized variable for High
    def vLow = low;
#    def initLow = CompoundValue(1, low, low);
    def vOpen = open;
#    def initOpen = CompoundValue(1, open, open);
    def vClose = close;
#    def initClose = CompoundValue(1, close, close);
    def vVolume = volume;
#    def initVolume = CompoundValue(1, volume, volume);
    def nan = Double.NaN;
# Bar Time & Date
    def bn = BarNumber();
    def currentBar = HighestAll(if !IsNaN(vHigh) then bn else nan);
#    def Today = GetDay() ==GetLastDay();
#    def time = GetTime();
#    def GlobeX = GetTime() < RegularTradingStart(GetYYYYMMDD());
    # def globeX_v2 = if time crosses below RegularTradingEnd(GetYYYYMMDD()) then bn else GlobeX[1];
#    def RTS  = RegularTradingStart(GetYYYYMMDD());
#    def RTE  = RegularTradingEnd(GetYYYYMMDD());
#    def RTH = GetTime() > RegularTradingStart(GetYYYYMMDD());
#    def RTH_v2 = if time crosses above RegularTradingStart(GetYYYYMMDD()) then bn else RTH[1];

# bars that start and end the sessions  #(borrowed from nube)
#    def rthStartBar    = CompoundValue(1,
#                         if   !IsNaN(vClose)
#                         &&   time crosses above RegularTradingStart(GetYYYYMMDD())
#                         then bn
#                         else rthStartBar[1], 0);
#    def rthEndBar      = CompoundValue(1,
#                         if   !IsNaN(vClose)
#                         &&   time crosses above RegularTradingEnd(GetYYYYMMDD())
#                         then bn
#                         else rthEndBar[1], 1);
#    def globexStartBar = CompoundValue(1,
#                         if   !IsNaN(vClose)
#                         &&   time crosses below RegularTradingEnd(GetYYYYMMDD())
#                         then bn
#                         else globexStartBar[1], 1);
#    def rthSession = if   bn crosses above rthStartBar #+ barsExtendedBeyondSession
#                     then 1
#                     else if   bn crosses above rthEndBar #+ barsExtendedBeyondSession
#                          then 0
#                     else rthSession[1];

# Bubble Locations
    def x_AxisLastExpansionBar = BarNumber() == HighestAll(BarNumber());  #corrected 11.12.2018 (JQ)
        # syntax: addChartBubble(x_AxisLastExpansionBar, y-axis coordinate," text", Color.LIME); #verified 12.25.2018 (JQ)

def PH;
   def PL;
   def hh = fold i = 1 to n + 1
            with p = 1
            while p
            do vHigh > getValue(vHigh, -i);
       PH = if (bn > n and
                vHigh == highest(vHigh, n) and
                hh)
            then vHigh
            else double.NaN;
   def ll = fold j = 1 to n + 1
            with q = 1
            while q
            do vLow < getValue(low, -j);
       PL = if (bn > n and
                vLow == lowest(vLow, n) and
                ll)
            then vLow
            else double.NaN;
   def PHBar = if !isNaN(PH)
               then bn
               else PHBar[1];
   def PLBar = if !isNaN(PL)
               then bn
               else PLBar[1];
   def PHL = if !isNaN(PH)
             then PH
             else PHL[1];
   def priorPHBar = if PHL != PHL[1]
                    then PHBar[1]
                    else priorPHBar[1];
   def PLL = if !isNaN(PL)
             then PL
             else PLL[1];
   def priorPLBar = if PLL != PLL[1]
                    then PLBar[1]
                    else priorPLBar[1];
   def HighPivots = bn >= highestAll(priorPHBar);
   def LowPivots = bn >= highestAll(priorPLBar);
   def FirstRpoint = if HighPivots
                     then bn - PHBar
                     else 0;
   def PriorRpoint = if HighPivots
                     then bn - PriorPHBar
                     else 0;
   def RSlope = (getvalue(PH, FirstRpoint) - getvalue(PH, PriorRpoint))
                       / (PHBar - PriorPHBar);
   def FirstSpoint = if LowPivots
                     then bn - PLBar
                     else 0;
   def PriorSpoint = if LowPivots
                     then bn - PriorPLBar
                     else 0;
   def SSlope = (getvalue(PL, FirstSpoint) - getvalue(PL, PriorSpoint))
                   / (PLBar - PriorPLBar);
   def RExtend = if bn == highestall(PHBar)
                 then 1
                 else RExtend[1];
   def SExtend = if bn == highestall(PLBar)
                 then 1
                 else SExtend[1];

  plot pivotHigh = if HighPivots
                   then PH
                   else double.NaN;
       pivotHigh.SetDefaultColor(GetColor(1));
       pivotHigh.setPaintingStrategy(PaintingStrategy.VALUES_ABOVE);
       pivotHigh.setHiding(!showValues);

  plot pivotHighLine = if PHL > 0 and
                          HighPivots
                       then PHL
                       else double.NaN;
       pivotHighLine.SetPaintingStrategy(PaintingStrategy.DASHES);  # Mobius original was DASHES
       pivotHighLine.setDefaultColor(color.uptick);    #JQ 7.8.2018 added
       pivotHighLine.setHiding(!showLines);

  plot RLine = pivotHigh;
       RLine.enableApproximation();
       RLine.SetDefaultColor(Color.LIGHT_GRAY);
       RLine.SetStyle(Curve.Short_DASH);

# Added code to limit resistance estension line (JQ 03.04.2019)
  def calc_ResistanceExtension = if RExtend
                    then (bn - PHBar) * RSlope + PHL
                    else double.NaN;
  plot line_ResistanceExtension = if bn <= (Currentbar + ExtensionLengthBars)
                                   and calc_ResistanceExtension[1] >=  (lowestall(vLow) * (1-(lowerExtensionPercentLimit/100)))
                                   and calc_ResistanceExtension[1] <= (Highestall(vHigh) * (1 + (upperExtensionPercentLimit/100)))
                               then calc_ResistanceExtension else double.nan;
       line_ResistanceExtension.SetStyle(Curve.Short_DASH);
       line_ResistanceExtension.SetDefaultColor(color.LIGHT_GRAY); #was 7
       line_ResistanceExtension.setLineWeight(1);

# Low Plots
  plot pivotLow = if LowPivots
                  then PL
                  else double.NaN;
       pivotLow.setDefaultColor(GetColor(4));
       pivotLow.setPaintingStrategy(PaintingStrategy.VALUES_BELOW);
       pivotLow.setHiding(!showValues);

  plot pivotLowLine = if PLL > 0 and
                         LowPivots
                      then PLL
                      else double.NaN;
       pivotLowLine.SetPaintingStrategy(PaintingStrategy.DASHES);  # Mobius original was DASHES
       pivotLowLine.setDefaultColor(color.DOWNTICK);#  #  JQ 7.8.2018 added
       pivotLowLine.setHiding(!showLines);

  plot SupportLine = pivotLow;
       SupportLine.enableApproximation();
       SupportLine.SetDefaultColor(color.LIGHT_GRAY);
       SUpportLine.SetStyle(Curve.Short_DASH);

# Added code to limit support estension line (JQ 03.04.2019)
  def calc_SupportExtension = if SExtend
                          then (bn - PLBar) * SSlope + PLL
                          else double.NaN;
  plot line_SupportExtension = if bn <= (Currentbar + ExtensionLengthBars)
                                   and calc_SupportExtension[1] >= (lowestall(vLow) * (1-(lowerExtensionPercentLimit/100)))
                                   and calc_SupportExtension[1] <= (Highestall(vHigh) * (1 + (upperExtensionPercentLimit/100)))
                               then calc_supportExtension else double.nan;
       line_SupportExtension.SetDefaultColor(color.LIGHT_GRAY); #was 7
       line_SupportExtension.SetStyle(Curve.Short_DASH);
       line_SupportExtension.setLineWeight(1);

  plot BarNumbersBelow = bn;
       BarNumbersBelow.SetDefaultColor(GetColor(0));
       BarNumbersBelow.setHiding(!showBarNumbers);
       BarNumbersBelow.SetPaintingStrategy(PaintingStrategy.VALUES_BELOW);

  plot PivotDot = if !isNaN(pivotHigh)
                  then pivotHigh
                  else if !isNaN(pivotLow)
                  then pivotLow
                  else double.NaN;
       pivotDot.SetDefaultColor(GetColor(7));
       pivotDot.SetPaintingStrategy(PaintingStrategy.POINTS);
       pivotDot.SetLineWeight(3);

# End Code

Shareable Link

https://tos.mx/WhZxG6

Video Tutorial


Attachments

  • F0AXsHf.png
    F0AXsHf.png
    350.4 KB · Views: 568
Last edited by a moderator:
This looks great but I am looking for an indicator that will plot the traditional pivot lines on the chart automatically even if I change symbols and time frames.
The Formulas for classic Pivot Points: Pivot Point Formulas. Investopedia
PIVOT POINTS (P) = (HIGH + LOW + CLOSE) = ALL RESULTS / 3
RESISTENCE 1 (R1) = (P * 2) - LOW
RESISTENCE 2 (R2) = P + (HIGH – LOW)
SUPPORT 1 (S1) = (P * 2) - HIGH
SUPPORT 2 (S2)= P – (HIGH – LOW)
Resistance (r3) = pp + 2 * (h – l);
Support (s3) = pp – 2 * (h – l);
The one in TOS does not work well on a daily chart no matter what setting it does not place clean lines on the chart but it works with in-traday charts. I want it to work after the close on a daily chart.
Thanks
 
@soary Sorry. Must have been in my studies so long I thought it was standard to ToS. Here it is. Adjust the n value to your needs.

Code:
# Pivot_Array (***Please copy and paste this name to study name above***)
# Mobius
# V01.09.13.2017
#hint: Plots the most recent 4 resistance pivots and support pivots. \n For scanning: Find the study in list of studies then select either BearScan or BullScan as the left side entry in the Scan Wizard and equal to as the center definition and close price as the right side entry.

# User Inputs
input n = 3; #hint n: periods used for pivot calculations.

# Internal Script Reference
script LinePlot {
    input BarID = 0;
    input Value = 0;
    input BarOrigin = 0;
    def ThisBar = HighestAll(BarOrigin);
    def ValueLine = if BarOrigin == ThisBar
                then Value
                else Double.NaN;
    plot P = if ThisBar - BarID <= BarOrigin
             then HighestAll(ValueLine)
             else Double.NaN;
}
# Variables
def o = open;
def h = high;
def l = low;
def c = close;
def bar = BarNumber();
def BBar = bar == HighestAll(bar);
# Parent High
def ParentHigh = HighestAll(h);
def ParentHBarOrigin = if h == ParentHigh
                       then bar
                       else ParentHBarOrigin[1];
def ParentHBarID = bar - HighestAll(ParentHBarOrigin);
# R1
def hh = fold i = 1 to n + 1
         with p = 1
         while p
         do h > GetValue(h, -i);
def PivotH = if (bar > n and
                 h == Highest(h, n) and
                 hh)
            then h
            else Double.NaN;
def PHValue = if !IsNaN(PivotH)
              then PivotH
              else PHValue[1];
def PHBarOrigin = if !IsNaN(PivotH)
                  then bar
                  else PHBarOrigin[1];
def PHBarID = bar - PHBarOrigin;
# R2
def R2PHValue = if PHBarOrigin != PHBarOrigin[1]
              then PHValue[1]
              else R2PHValue[1];
def R2PHBarOrigin = if PHBarOrigin != PHBarOrigin[1]
                  then PHBarOrigin[1]
                  else R2PHBarOrigin[1];
def R2PHBarID = bar - R2PHBarOrigin;
# R3
def R3PHValue = if R2PHBarOrigin != R2PHBarOrigin[1]
              then R2PHValue[1]
              else R3PHValue[1];
def R3PHBarOrigin = if R2PHBarOrigin != R2PHBarOrigin[1]
                  then R2PHBarOrigin[1]
                  else R3PHBarOrigin[1];
def R3PHBarID = bar - R3PHBarOrigin;
# R4
def R4PHValue = if R3PHBarOrigin != R3PHBarOrigin[1]
              then R3PHValue[1]
              else R4PHValue[1];
def R4PHBarOrigin = if R3PHBarOrigin != R3PHBarOrigin[1]
                  then R3PHBarOrigin[1]
                  else R4PHBarOrigin[1];
def R4PHBarID = bar - R4PHBarOrigin;

# Parent Low
def ParentLow = LowestAll(l);
def ParentLBarOrigin = if l == ParentLow
                       then bar
                       else ParentLBarOrigin[1];
def ParentLBarID = bar - HighestAll(ParentLBarOrigin);
# S1
def ll = fold j = 1 to n + 1
         with q = 1
         while q
         do l < GetValue(l, -j);
def PivotL = if (bar > n and
                 l == Lowest(l, n) and
                 ll)
             then l
             else Double.NaN;
def PLValue = if !IsNaN(PivotL)
              then PivotL
              else PLValue[1];
def PLBarOrigin = if !IsNaN(PivotL)
                  then bar
                  else PLBarOrigin[1];
def PLBarID = bar - PLBarOrigin;
# S2
def S2PLValue = if PLBarOrigin != PLBarOrigin[1]
              then PLValue[1]
              else S2PLValue[1];
def S2PLBarOrigin = if PLBarOrigin != PLBarOrigin[1]
                  then PLBarOrigin[1]
                  else S2PLBarOrigin[1];
def S2PLBarID = bar - S2PLBarOrigin;
# S3
def S3PLValue = if S2PLBarOrigin != S2PLBarOrigin[1]
              then S2PLValue[1]
              else S3PLValue[1];
def S3PLBarOrigin = if S2PLBarOrigin != S2PLBarOrigin[1]
                  then S2PLBarOrigin[1]
                  else S3PLBarOrigin[1];
def S3PLBarID = bar - S3PLBarOrigin;
# S4
def S4PLValue = if S3PLBarOrigin != S3PLBarOrigin[1]
              then S3PLValue[1]
              else S4PLValue[1];
def S4PLBarOrigin = if S3PLBarOrigin != S3PLBarOrigin[1]
                  then S3PLBarOrigin[1]
                  else S4PLBarOrigin[1];
def S4PLBarID = bar - S4PLBarOrigin;

# Plots
plot PR1 = LinePlot(BarID = ParentHBarID,
                    Value = ParentHigh,
                    BarOrigin = HighestAll(ParentHBarOrigin));
     PR1.SetDefaultColor(Color.GREEN);
#addChartBubble(Bar == HighestAll(ParentHBarOrigin), ParentHigh, "High", color.yellow, 1);
plot R1 = LinePlot(BarID = PHBarID,
                   Value = PHValue,
                   BarOrigin = PHBarOrigin);
     R1.SetDefaultColor(Color.GREEN);
addChartBubble(Bar == HighestAll(PHBarOrigin), PHvalue, "R1", color.green, 1);
plot R2 = LinePlot(BarID = R2PHBarID,
                   Value = R2PHValue,
                   BarOrigin = R2PHBarOrigin);
     R2.SetDefaultColor(Color.GREEN);
addChartBubble(Bar == HighestAll(R2PHBarOrigin), PHvalue, "R2", color.green, 1);
plot R3 = LinePlot(BarID = R3PHBarID,
                   Value = R3PHValue,
                   BarOrigin = R3PHBarOrigin);
     R3.SetDefaultColor(Color.GREEN);
addChartBubble(Bar == HighestAll(R3PHBarOrigin), PHvalue, "R3", color.green, 1);
plot R4 = LinePlot(BarID = R4PHBarID,
                   Value = R4PHValue,
                   BarOrigin = R4PHBarOrigin);
     R4.SetDefaultColor(Color.GREEN);
addChartBubble(Bar == HighestAll(R4PHBarOrigin), PHvalue, "R4", color.green, 1);

plot PS1 = LinePlot(BarID = ParentLBarID,
                   Value = ParentLow,
                   BarOrigin = HighestAll(ParentLBarOrigin));
     PS1.SetDefaultColor(Color.RED);
AddChartBubble(Bar == HighestAll(ParentLBarOrigin), ParentLow, "Low", Color.Yellow, 0);
plot S1 = LinePlot(BarID = PLBarID,
                   Value = PLValue,
                   BarOrigin = PLBarOrigin);
     S1.SetDefaultColor(Color.RED);
addChartBubble(Bar == HighestAll(PLBarOrigin), PLvalue, "S1", color.red, 0);
plot S2 = LinePlot(BarID = S2PLBarID,
                   Value = S2PLValue,
                   BarOrigin = S2PLBarOrigin);
     S2.SetDefaultColor(Color.RED);
addChartBubble(Bar == HighestAll(S2PLBarOrigin), PLvalue, "S2", color.red, 0);
plot S3 = LinePlot(BarID = S3PLBarID,
                   Value = S3PLValue,
                   BarOrigin = S3PLBarOrigin);
     S3.SetDefaultColor(Color.RED);
addChartBubble(Bar == HighestAll(S3PLBarOrigin), PLvalue, "S3", color.red, 0);
plot S4 = LinePlot(BarID = S4PLBarID,
                   Value = S4PLValue,
                   BarOrigin = S4PLBarOrigin);
     S4.SetDefaultColor(Color.RED);
addChartBubble(Bar == HighestAll(S4PLBarOrigin), PLvalue, "S4", color.red, 0);
# Signals
def UpSignal;
def DnSignal;
if close crosses above R4
{
    UpSignal = low;
}
else if close crosses above R3
{
    UpSignal = low;
}
else if close crosses above R2
{
    UpSignal = low;
}
else if close crosses above R1
{
    UpSignal = low;
}
else
{
    UpSignal = UpSignal[1];
}
plot UpArrows = if low == UpSignal
                then low
                else double.nan;
     UpArrows.SetPaintingStrategy(PaintingStrategy.Arrow_UP);
     UpArrows.SetDefaultColor(Color.CYAN);
if close crosses below S1
{
    DnSignal = high;
}
else if close crosses below S2
{
    DnSignal = high;
}
else if close crosses below S3
{
    DnSignal = high;
}
else if close crosses below S4
{
    DnSignal = high;
}
else
{
    DnSignal = DnSignal[1];
}
plot DnArrow = if high == DnSignal
               then high
               else double.nan;
DnArrow.SetPaintingStrategy(PaintingStrategy.Arrow_DOWN);
DnArrow.SetDefaultColor(Color.YELLOW);
plot BearScan = if (close crosses below S1) OR
                   (close crosses below S2)
                then close
                else double.nan;
plot BullScan = if (close crosses above R1) OR
                   (close crosses above R2)
                then close
                else double.nan;
# End Code Fractal Array
 
@BenTen and @horserider , How to use these indicator for Monthly, Weekly,Hourly 4hours,30mts, 15 and 5 mts.
San, The idea is for the script to use the H, L, C data from the monthly, weekly and daily charts and since the data changes I would draw them onto the chart so that when I go to a lower time frames the lines appear. The daily lines would be changed daily but the monthly and weekly would not be changed until the new week or month. These act as support and resistance levels so that when price hit any of them in any time frame you know you are at a key level, I still have questions on the script so I will respond to the post. Hope that helps.
 
@soary Sorry. Must have been in my studies so long I thought it was standard to ToS. Here it is. Adjust the n value to your needs.

Code:
# Pivot_Array (***Please copy and paste this name to study name above***)
# Mobius
# V01.09.13.2017
#hint: Plots the most recent 4 resistance pivots and support pivots. \n For scanning: Find the study in list of studies then select either BearScan or BullScan as the left side entry in the Scan Wizard and equal to as the center definition and close price as the right side entry.

# User Inputs
input n = 3; #hint n: periods used for pivot calculations.

# Internal Script Reference
script LinePlot {
    input BarID = 0;
    input Value = 0;
    input BarOrigin = 0;
    def ThisBar = HighestAll(BarOrigin);
    def ValueLine = if BarOrigin == ThisBar
                then Value
                else Double.NaN;
    plot P = if ThisBar - BarID <= BarOrigin
             then HighestAll(ValueLine)
             else Double.NaN;
}
# Variables
def o = open;
def h = high;
def l = low;
def c = close;
def bar = BarNumber();
def BBar = bar == HighestAll(bar);
# Parent High
def ParentHigh = HighestAll(h);
def ParentHBarOrigin = if h == ParentHigh
                       then bar
                       else ParentHBarOrigin[1];
def ParentHBarID = bar - HighestAll(ParentHBarOrigin);
# R1
def hh = fold i = 1 to n + 1
         with p = 1
         while p
         do h > GetValue(h, -i);
def PivotH = if (bar > n and
                 h == Highest(h, n) and
                 hh)
            then h
            else Double.NaN;
def PHValue = if !IsNaN(PivotH)
              then PivotH
              else PHValue[1];
def PHBarOrigin = if !IsNaN(PivotH)
                  then bar
                  else PHBarOrigin[1];
def PHBarID = bar - PHBarOrigin;
# R2
def R2PHValue = if PHBarOrigin != PHBarOrigin[1]
              then PHValue[1]
              else R2PHValue[1];
def R2PHBarOrigin = if PHBarOrigin != PHBarOrigin[1]
                  then PHBarOrigin[1]
                  else R2PHBarOrigin[1];
def R2PHBarID = bar - R2PHBarOrigin;
# R3
def R3PHValue = if R2PHBarOrigin != R2PHBarOrigin[1]
              then R2PHValue[1]
              else R3PHValue[1];
def R3PHBarOrigin = if R2PHBarOrigin != R2PHBarOrigin[1]
                  then R2PHBarOrigin[1]
                  else R3PHBarOrigin[1];
def R3PHBarID = bar - R3PHBarOrigin;
# R4
def R4PHValue = if R3PHBarOrigin != R3PHBarOrigin[1]
              then R3PHValue[1]
              else R4PHValue[1];
def R4PHBarOrigin = if R3PHBarOrigin != R3PHBarOrigin[1]
                  then R3PHBarOrigin[1]
                  else R4PHBarOrigin[1];
def R4PHBarID = bar - R4PHBarOrigin;

# Parent Low
def ParentLow = LowestAll(l);
def ParentLBarOrigin = if l == ParentLow
                       then bar
                       else ParentLBarOrigin[1];
def ParentLBarID = bar - HighestAll(ParentLBarOrigin);
# S1
def ll = fold j = 1 to n + 1
         with q = 1
         while q
         do l < GetValue(l, -j);
def PivotL = if (bar > n and
                 l == Lowest(l, n) and
                 ll)
             then l
             else Double.NaN;
def PLValue = if !IsNaN(PivotL)
              then PivotL
              else PLValue[1];
def PLBarOrigin = if !IsNaN(PivotL)
                  then bar
                  else PLBarOrigin[1];
def PLBarID = bar - PLBarOrigin;
# S2
def S2PLValue = if PLBarOrigin != PLBarOrigin[1]
              then PLValue[1]
              else S2PLValue[1];
def S2PLBarOrigin = if PLBarOrigin != PLBarOrigin[1]
                  then PLBarOrigin[1]
                  else S2PLBarOrigin[1];
def S2PLBarID = bar - S2PLBarOrigin;
# S3
def S3PLValue = if S2PLBarOrigin != S2PLBarOrigin[1]
              then S2PLValue[1]
              else S3PLValue[1];
def S3PLBarOrigin = if S2PLBarOrigin != S2PLBarOrigin[1]
                  then S2PLBarOrigin[1]
                  else S3PLBarOrigin[1];
def S3PLBarID = bar - S3PLBarOrigin;
# S4
def S4PLValue = if S3PLBarOrigin != S3PLBarOrigin[1]
              then S3PLValue[1]
              else S4PLValue[1];
def S4PLBarOrigin = if S3PLBarOrigin != S3PLBarOrigin[1]
                  then S3PLBarOrigin[1]
                  else S4PLBarOrigin[1];
def S4PLBarID = bar - S4PLBarOrigin;

# Plots
plot PR1 = LinePlot(BarID = ParentHBarID,
                    Value = ParentHigh,
                    BarOrigin = HighestAll(ParentHBarOrigin));
     PR1.SetDefaultColor(Color.GREEN);
#addChartBubble(Bar == HighestAll(ParentHBarOrigin), ParentHigh, "High", color.yellow, 1);
plot R1 = LinePlot(BarID = PHBarID,
                   Value = PHValue,
                   BarOrigin = PHBarOrigin);
     R1.SetDefaultColor(Color.GREEN);
addChartBubble(Bar == HighestAll(PHBarOrigin), PHvalue, "R1", color.green, 1);
plot R2 = LinePlot(BarID = R2PHBarID,
                   Value = R2PHValue,
                   BarOrigin = R2PHBarOrigin);
     R2.SetDefaultColor(Color.GREEN);
addChartBubble(Bar == HighestAll(R2PHBarOrigin), PHvalue, "R2", color.green, 1);
plot R3 = LinePlot(BarID = R3PHBarID,
                   Value = R3PHValue,
                   BarOrigin = R3PHBarOrigin);
     R3.SetDefaultColor(Color.GREEN);
addChartBubble(Bar == HighestAll(R3PHBarOrigin), PHvalue, "R3", color.green, 1);
plot R4 = LinePlot(BarID = R4PHBarID,
                   Value = R4PHValue,
                   BarOrigin = R4PHBarOrigin);
     R4.SetDefaultColor(Color.GREEN);
addChartBubble(Bar == HighestAll(R4PHBarOrigin), PHvalue, "R4", color.green, 1);

plot PS1 = LinePlot(BarID = ParentLBarID,
                   Value = ParentLow,
                   BarOrigin = HighestAll(ParentLBarOrigin));
     PS1.SetDefaultColor(Color.RED);
AddChartBubble(Bar == HighestAll(ParentLBarOrigin), ParentLow, "Low", Color.Yellow, 0);
plot S1 = LinePlot(BarID = PLBarID,
                   Value = PLValue,
                   BarOrigin = PLBarOrigin);
     S1.SetDefaultColor(Color.RED);
addChartBubble(Bar == HighestAll(PLBarOrigin), PLvalue, "S1", color.red, 0);
plot S2 = LinePlot(BarID = S2PLBarID,
                   Value = S2PLValue,
                   BarOrigin = S2PLBarOrigin);
     S2.SetDefaultColor(Color.RED);
addChartBubble(Bar == HighestAll(S2PLBarOrigin), PLvalue, "S2", color.red, 0);
plot S3 = LinePlot(BarID = S3PLBarID,
                   Value = S3PLValue,
                   BarOrigin = S3PLBarOrigin);
     S3.SetDefaultColor(Color.RED);
addChartBubble(Bar == HighestAll(S3PLBarOrigin), PLvalue, "S3", color.red, 0);
plot S4 = LinePlot(BarID = S4PLBarID,
                   Value = S4PLValue,
                   BarOrigin = S4PLBarOrigin);
     S4.SetDefaultColor(Color.RED);
addChartBubble(Bar == HighestAll(S4PLBarOrigin), PLvalue, "S4", color.red, 0);
# Signals
def UpSignal;
def DnSignal;
if close crosses above R4
{
    UpSignal = low;
}
else if close crosses above R3
{
    UpSignal = low;
}
else if close crosses above R2
{
    UpSignal = low;
}
else if close crosses above R1
{
    UpSignal = low;
}
else
{
    UpSignal = UpSignal[1];
}
plot UpArrows = if low == UpSignal
                then low
                else double.nan;
     UpArrows.SetPaintingStrategy(PaintingStrategy.Arrow_UP);
     UpArrows.SetDefaultColor(Color.CYAN);
if close crosses below S1
{
    DnSignal = high;
}
else if close crosses below S2
{
    DnSignal = high;
}
else if close crosses below S3
{
    DnSignal = high;
}
else if close crosses below S4
{
    DnSignal = high;
}
else
{
    DnSignal = DnSignal[1];
}
plot DnArrow = if high == DnSignal
               then high
               else double.nan;
DnArrow.SetPaintingStrategy(PaintingStrategy.Arrow_DOWN);
DnArrow.SetDefaultColor(Color.YELLOW);
plot BearScan = if (close crosses below S1) OR
                   (close crosses below S2)
                then close
                else double.nan;
plot BullScan = if (close crosses above R1) OR
                   (close crosses above R2)
                then close
                else double.nan;
# End Code Fractal Array
.............................................................................................................
horserider, Thanks I just added it and I have a few questions. I'm not a script writer so how to remove the color bubbles labels for the various levels? Do I only delete the lines that say,
addChartBubble(Bar == HighestAll(PHBarOrigin), PHvalue, "R1", color.green, 1);
.....................................................
To be explicit
on the daily chart after the close E/O/D would n = 1
on the weekly chart set up on a Saturday would n = 7 not counting the starting Saturday counting from or n = 8 counting the starting Saturday
on a monthly chart would n = 30 or 31 depending on the # days in that particular month if I look at it after the close on the last day of the month
......................................................
Also, I noticed some extra levels called PR1 and then it goes on to R1,R2....R4 and PS1 and then it goes on to S1,S2......S4, what are PR1 AND PS1? I'm guessing PR1 may be the Pivot followed by R1 to R4 but then what is PS1 since it already plots S1 TO S4?
........................................................
A line in the code says, Plots the most recent 4 resistance pivots and support pivots. Does this mean I should turn off extended hours market at close for example when I need to get the daily pivots?
 
Last edited:
@soary I would just comment out the add bubble lines.
Sorry not sure how n works. It is in the fold calculations and I as yet have no idea how fold works. Math is not my best subject.
I believe PR1 and PS1 are the high and low of the chart being displayed.
I never use extended hours but my guess is it will choose points in the extended hours. Try it and see. Then you can decide which way gives you the lines you want.
 
I really like the trend line drawing in this script. I don't use the Pivots myself because i have another script for that but the automatic drawing of trendlines is super!
 
Last edited:
nice video but it is fast I looked multiple times at the ending but still didn't get the last part.. What was that at the end that seems to add the price of the levels towards the end? Can you describe that part? Thanks
 
Last edited:
can i make it show weekly pivots even though im on the 6mo 1day chart? Also can you scan it?
I believe it could be done using aggregation periods, though it would require some re-working.

The code comments in the version posted in line by @horserider at #6 in this thread have hints for using the script in a scan. :) but you can always brew your own, so lang as the scan returns exactly one value (boolean) to scan against. -- that can be in the form of x == y, x > y, x > y and x < z, etc... but returns only one thing. comment out other plots.

This is my first post here, so perhaps my tone isn't the most considered for the group. I don't mean to offend.

Happy Scripting
 
@Nikola I didn't make this indicator. Another developer, named Mobius produced it. I believe both utilize pivot points. The one that horserider shared also include ATR (average true range). You should try them out and see which one works better for you.
 
@Nikola Here's what I know about these two pivot studies. The study that @BenTen posted is called Projection Pivots while the study that @horserider posted is called Pivot Array with Signals. Both studies were written by Mobius.

In the Projection Pivots study, notice there is an input variable called "n" with a value of 21. That looks at the last 21 pivots and plots projection lines. Load that on a daily aggregation chart of /ES. Now when you change the value of that from 21 to 5, you'll see very different results on the chart.

The other study called Pivot Array with Signals was written by Mobius for TheoTrade. It plots the most recent 4 support and resistance pivots labelled with signals. None of these indicators use any form of ATR, it is based purely on price and prior pivots.

Mobius had also recently written another study called Trend Pivots that is great for intraday trades especially on /ES. It is an amazing study, it tends to react really well to turning points. One of the big pluses for me is that I can watch the pivots form and see how price reacts to pivot points especially on a 2 min timeframe. Good for a quick $200-300 win most days especially during volatile sessions, good enough for lunch/dinner!

Hope this helps
 
Last edited:
Mobius had also recently written another study called Trend Pivots that is great for intraday trades especially on /ES. It is an amazing study, it tends to react really well to turning points. One of the big pluses for me is that I can watch the pivots form and see how price reacts to pivot points especially on a 2 min timeframe. Good for a quick $200-300 win most days especially during volatile sessions, good enough for lunch/dinner!

Hope this helps

What timeframes and parameters you use for this study?
 
@skynetgen I used standard parameters, on a 2 day 2 min timeframe, instrument: /ES. One enhancement is that I also added a very simple color coded TICK and AD label on my chart to get a sense of the underlying market sentiment

Here's what I use:

# START CODE
input TickSymb = "$TIKSP";
input ADSymb = "$ADSPD";
def TICKS = if !IsNaN(close(TickSymb)) then close(TickSymb) else TICKS[1];
def AD = if !IsNaN(close(ADSymb)) then close(ADSymb) else AD[1];
AddLabel(1, " Tick = " + TICKS, if TICKS < 0 then Color.Pink else Color.Cyan);
AddLabel(1, " AD = " + AD, if AD < -350 then Color.Pink else if AD > 350 then Color.Cyan else if between(AD, -250, 250) then Color.White else Color.Yellow);
# END CODE
 
Last edited:
@Nikola
Mobius had also recently written another study called Trend Pivots that is great for intraday trades especially on /ES. It is an amazing study, it tends to react really well to turning points. One of the big pluses for me is that I can watch the pivots form and see how price reacts to pivot points especially on a 2 min timeframe. Good for a quick $200-300 win most days especially during volatile sessions, good enough for lunch/dinner!

Hope this helps

Do you know if the Trend Pivots study is currently avaliable for TOS?
 

Join useThinkScript to post your question to a community of 21,000+ developers and traders.

Similar threads

Not the exact question you're looking for?

Start a new thread and receive assistance from our community.

87k+ Posts
594 Online
Create Post

Similar threads

Similar threads

The Market Trading Game Changer

Join 2,500+ subscribers inside the useThinkScript VIP Membership Club
  • Exclusive indicators
  • Proven strategies & setups
  • Private Discord community
  • ‘Buy The Dip’ signal alerts
  • Exclusive members-only content
  • Add-ons and resources
  • 1 full year of unlimited support

Frequently Asked Questions

What is useThinkScript?

useThinkScript is the #1 community of stock market investors using indicators and other tools to power their trading strategies. Traders of all skill levels use our forums to learn about scripting and indicators, help each other, and discover new ways to gain an edge in the markets.

How do I get started?

We get it. Our forum can be intimidating, if not overwhelming. With thousands of topics, tens of thousands of posts, our community has created an incredibly deep knowledge base for stock traders. No one can ever exhaust every resource provided on our site.

If you are new, or just looking for guidance, here are some helpful links to get you started.

What are the benefits of VIP Membership?
VIP members get exclusive access to these proven and tested premium indicators: Buy the Dip, Advanced Market Moves 2.0, Take Profit, and Volatility Trading Range. In addition, VIP members get access to over 50 VIP-only custom indicators, add-ons, and strategies, private VIP-only forums, private Discord channel to discuss trades and strategies in real-time, customer support, trade alerts, and much more. Learn all about VIP membership here.
How can I access the premium indicators?
To access the premium indicators, which are plug and play ready, sign up for VIP membership here.
Back
Top