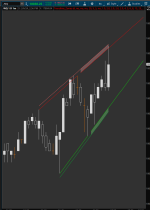
Auto Pivot Points Support & Resistance Indicator for ThinkorSwim

Anyway possible someone can create an alert system for the code below? Having issues.
https://usethinkscript.com/threads/...icator-for-thinkorswim.158/page-3#post-108089

Code:
declare upper;

input Length_Forward   = 9;
input Length_Backward  = 9;

def _BN  = BarNumber();     # current barnumber
def _NaN = Double.NaN;      # non-numeric values
def _H   = high;            # high price
def _L   = low;             # low price
def _C   = close;           # close price
def _O   = open;            # open price
def _LL  = Lowestall(_L);   # lowest _L price
def _HH  = highestall(_H);  # highest _H price

script FindPivots {
    input dat = high; # default data or study being evaluated
    input HL  = 0;    # default high or low pivot designation, -1 low, +1 high
    input PF  = 1;    # default pivot forward period
    input PB  = 5;    # default pivot backward period

    ##############
    def _nan;    # used for non-number returns
    def _BN;     # the current barnumber
    def _VStop;  # confirms that the lookforward period continues the pivot trend
    def _V;      # the Value at the actual pivot point
    def _VBar;   # the bar number at the pivot point
    def _PV;     # the previous pivot Value
    def _PVBar;  # the previous pivot bar number
    def _VDiff;  # the difference in values between last two pivot points
    def _VDist;  # the diffence in barnumbers between last two pivot points
    def _VSlope; # the Slope calculated using value and distance changes
    def _VPivot; # used for the pivot point connector line only
    ##############

    _BN  = BarNumber();
    _nan = Double.NaN;
    _VStop =
        fold a = 1 to PF + 1
        with b = 1 while b
        do if HL > 0 then
            dat > GetValue(dat, -a) else
            dat < GetValue(dat, -a) ;
    if (HL > 0) {
        _V = if _BN > PB and dat == Highest(dat, PB) and _VStop
            then dat else _nan;
    } else {
        _V = if _BN > PB and dat == Lowest(dat, PB) and _VStop
            then dat else _nan;
    }
    ;
    _VBar   = if !IsNaN(_V) then _BN else _VBar[1];
    _PV     = if !IsNaN(_V) then GetValue(dat, _BN - _VBar[1]) else _PV[1];
    _PVBar  = if   _VBar != _VBar[1]
            then _PVBar[1] else _VBar;
    _VDiff  = AbsValue(_V) - AbsValue(_PV);
    _VDist  = _BN - _PVBar;
    _VSlope = if _V > _PV  then 1 else
              if _V < _PV  then -1 else 0;
    if (HL > 0) {
        _VPivot = _BN >= HighestAll(_PVBar);
    } else {
        _VPivot = _BN >= LowestAll(_PVBar);
    }
    ; 
    plot result = if !IsNaN(_V) and _VStop then _V else _nan; #return the final _dat value at the most recent pivot point (same as V)
}
;

def ph =  findpivots(_H, 1, length_forward, length_backward)."result";
def pl =  findpivots(_L, -1, length_forward, length_backward)."result";

def ph_1 = if !isnan(ph) then ph else ph_1[1];
def pl_1 = if !isnan(pl) then pl else pl_1[1];

def hh = !isnan(ph) and ph > ph_1[1];
def ll = !isnan(pl) and pl < pl_1[1];

addchartbubble(ll, pl, "BUY CALLS", color.green, no);
addchartbubble(hh, ph, "BUY PUTS", color.red, yes);
 
Last edited by a moderator:

Join useThinkScript to post your question to a community of 21,000+ developers and traders.

mod note:
This study was moved here as it plots similarly to the other pivot points in this thread, except this has extended lines and pivot bubbles.

check this.

CSS:
declare upper;

input Length_Forward   = 9;
input Length_Backward  = 9;

#def _BN  = BarNumber();     # current barnumber
def na = Double.NaN;      # non-numeric values
def _H   = high;            # high price
def _L   = low;             # low price
def _C   = close;           # close price
def _O   = open;            # open price
#def _LL  = Lowestall(_L);   # lowest _L price
#def _HH  = highestall(_H);  # highest _H price

script FindPivots {
    input dat = high; # default data or study being evaluated
    input HL  = 0;    # default high or low pivot designation, -1 low, +1 high
    input PF  = 1;    # default pivot forward period
    input PB  = 5;    # default pivot backward period

    ##############
    def _nan;    # used for non-number returns
    def _BN;     # the current barnumber
    def _VStop;  # confirms that the lookforward period continues the pivot trend
    def _V;      # the Value at the actual pivot point
    def _VBar;   # the bar number at the pivot point
    def _PV;     # the previous pivot Value
    def _PVBar;  # the previous pivot bar number
    def _VDiff;  # the difference in values between last two pivot points
    def _VDist;  # the diffence in barnumbers between last two pivot points
    def _VSlope; # the Slope calculated using value and distance changes
    def _VPivot; # used for the pivot point connector line only
    ##############

    _BN  = BarNumber();
    _nan = Double.NaN;
    _VStop =
        fold a = 1 to PF + 1
        with b = 1 while b
        do if HL > 0 then
            dat > GetValue(dat, -a) else
            dat < GetValue(dat, -a) ;
    if (HL > 0) {
        _V = if _BN > PB and dat == Highest(dat, PB) and _VStop
            then dat else _nan;
    } else {
        _V = if _BN > PB and dat == Lowest(dat, PB) and _VStop
            then dat else _nan;
    }
    ;
    _VBar   = if !IsNaN(_V) then _BN else _VBar[1];
    _PV     = if !IsNaN(_V) then GetValue(dat, _BN - _VBar[1]) else _PV[1];
    _PVBar  = if   _VBar != _VBar[1]
            then _PVBar[1] else _VBar;
    _VDiff  = AbsValue(_V) - AbsValue(_PV);
    _VDist  = _BN - _PVBar;
    _VSlope = if _V > _PV  then 1 else
              if _V < _PV  then -1 else 0;
    if (HL > 0) {
        _VPivot = _BN >= HighestAll(_PVBar);
    } else {
        _VPivot = _BN >= LowestAll(_PVBar);
    }
    ;
    plot result = if !IsNaN(_V) and _VStop then _V else _nan; #return the final _dat value at the most recent pivot point (same as V)
}

def ph =  findpivots(_H, 1, length_forward, length_backward)."result";
def pl =  findpivots(_L, -1, length_forward, length_backward)."result";

def ph_1 = if !isnan(ph) then ph else ph_1[1];
def pl_1 = if !isnan(pl) then pl else pl_1[1];

def hh = !isnan(ph) and ph > ph_1[1];
def ll = !isnan(pl) and pl < pl_1[1];

#--------------------------------------------------------------
def LastTF = CompoundValue(1, if isNaN(ph) then LastTF[1] else ph, ph);
def LastBF = CompoundValue(1, if isNan(pl) then LastBF[1] else pl, pl);
#--------------------------------------------------------------

plot HLine =  LastTF ; #,color=red,style=circles,linewidth=1,offset=-1)
plot LLine =  LastBF ; #,color=green,style=circles,linewidth=1,offset=-1)
HLine.SetPaintingStrategy(PaintingStrategy.POINTS);
HLine.SetDefaultColor(Color.DARK_GREEN);
LLine.SetPaintingStrategy(PaintingStrategy.POINTS);
LLine.SetDefaultColor(Color.DARK_RED);

addchartbubble(ll, pl, "BUY CALLS", color.green, no);
addchartbubble(hh, ph, "BUY PUTS", color.red, yes);
@samer800, hi bro, may I check with you if we can condition the "trigger" by the next candle (or the next few candles) which broke and close the lowest price of the "highest pivot candle". As below is the image for better explanation:


Many thanks in advance.
 
@samer800, hi bro, may I check with you if we can condition the "trigger" by the next candle (or the next few candles) which broke and close the lowest price of the "highest pivot candle". As below is the image for better explanation:


Many thanks in advance.
check this.

CSS:
declare upper;

input rightBars   = 9;
input leftBars    = 9;
input ShowArrow   = yes;
input ShowLines   = yes;
input ShowBubbles = yes;

#def _BN  = BarNumber();     # current barnumber
def na = Double.NaN;      # non-numeric values
def _H   = high;            # high price
def _L   = low;             # low price
def _C   = close;           # close price
def _O   = open;            # open price
#def _LL  = Lowestall(_L);   # lowest _L price
#def _HH  = highestall(_H);  # highest _H price

script FindPivots {
    input dat = close; # default data or study being evaluated
    input HL  = 0;    # default high or low pivot designation, -1 low, +1 high
    input lbL  = 5;    # default Pivot Lookback Left
    input lbR  = 1;    # default Pivot Lookback Right
    ##############
    def _nan;    # used for non-number returns
    def _BN;     # the current barnumber
    def _VStop;  # confirms that the lookforward period continues the pivot trend
    def _V;      # the Value at the actual pivot point
    ##############
    _BN  = BarNumber();
    _nan = Double.NaN;
    _VStop = if !isNaN(dat) and lbr > 0 and lbl > 0 then
                fold a = 1 to lbR + 1 with b=1 while b do
                    if HL > 0 then dat > GetValue(dat,-a) else dat < GetValue(dat,-a) else _nan;
   if (HL > 0) {
        _V = if _BN > lbL and dat == Highest(dat, lbL+1) and _VStop
            then dat else _nan;
    } else {
        _V = if _BN > lbL and dat == Lowest(dat, lbL+1) and _VStop
            then dat else _nan;
    }
    plot result = if !IsNaN(_V) and _VStop then _V else _nan;
}
def ph =  findpivots(_H, 1, leftBars, rightBars);
def pl =  findpivots(_L, -1, leftBars, rightBars);

def ph_1 = if !isnan(ph) then ph else ph_1[1];
def pl_1 = if !isnan(pl) then pl else pl_1[1];

def hh = if !isnan(ph) and ph > ph_1[1] then ph else na;
def ll = if !isnan(pl) and pl < pl_1[1] then pl else na;

#--------------------------------------------------------------
def LastTF = CompoundValue(1, if isNaN(ph) then LastTF[1] else ph, ph);
def LastBF = CompoundValue(1, if isNan(pl) then LastBF[1] else pl, pl);
#--------------------------------------------------------------

plot HLine =  if !ShowLines then na else LastTF ; #,color=red,style=circles,linewidth=1,offset=-1)
plot LLine =  if !ShowLines then na else LastBF; #,color=green,style=circles,linewidth=1,offset=-1)
HLine.SetPaintingStrategy(PaintingStrategy.HORIZONTAL);
HLine.SetDefaultColor(Color.DARK_GREEN);
LLine.SetPaintingStrategy(PaintingStrategy.HORIZONTAL);
LLine.SetDefaultColor(Color.DARK_RED);

addchartbubble(ShowBubbles and ll, ll, "B", color.green, no);
addchartbubble(ShowBubbles and hh, hh, "S", color.red, yes);

# Breakuot
def hhValue = CompoundValue(1, if isNaN(ph) then LastTF[1] else _L, _L);
def llValue = CompoundValue(1, if isNan(pl) then LastBF[1] else _H, _H);
def BreakDn = Crosses(_C, hhValue, CrossingDirection.BELOW);
def BreakUp = Crosses(_C, llValue, CrossingDirection.ABOVE);

plot SigDn = if ShowArrow then if BreakDn then _H else na else na;
plot SigUp = if ShowArrow then if BreakUp then _L else na else na;
SigDn.SetPaintingStrategy(PaintingStrategy.ARROW_DOWN);
SigUp.SetPaintingStrategy(PaintingStrategy.ARROW_UP);
SigUp.SetDefaultColor(Color.WHITE);
SigDn.SetDefaultColor(Color.YELLOW);

#---- END Code
@samer800 Hi bro, thank you so much for the detailed script c/w all the descriptions. I m very grateful and very much appreciated your guidance. Please if you don't mind to look into the image here: .

Hoping to get the trigger condition as: When the next candle (or the next few candles) broke and close below the lowest price of the pivot high candle.

Thanks again bro. Enjoy your weekend. Cheers
check the below. You can adjust the number if breakout bars.

CSS:
# Created for usethinkscript.com
# Created by Sam4Cok@Samer800 - 10/2022


declare upper;

input rightBars   = 9;
input leftBars    = 9;
input NoOfBreakoutBars = 3;
input ShowArrow   = yes;
input ShowLines   = yes;
input ShowBubbles = yes;

#def _BN  = BarNumber();     # current barnumber
def na = Double.NaN;      # non-numeric values
def _H   = high;            # high price
def _L   = low;             # low price
def _C   = close;           # close price
def _O   = open;            # open price
#def _LL  = Lowestall(_L);   # lowest _L price
#def _HH  = highestall(_H);  # highest _H price

script FindPivots {
    input dat = close; # default data or study being evaluated
    input HL  = 0;    # default high or low pivot designation, -1 low, +1 high
    input lbL  = 5;    # default Pivot Lookback Left
    input lbR  = 1;    # default Pivot Lookback Right
    ##############
    def _nan;    # used for non-number returns
    def _BN;     # the current barnumber
    def _VStop;  # confirms that the lookforward period continues the pivot trend
    def _V;      # the Value at the actual pivot point
    ##############
    _BN  = BarNumber();
    _nan = Double.NaN;
    _VStop = if !isNaN(dat) and lbr > 0 and lbl > 0 then
                fold a = 1 to lbR + 1 with b=1 while b do
                    if HL > 0 then dat > GetValue(dat,-a) else dat < GetValue(dat,-a) else _nan;
   if (HL > 0) {
        _V = if _BN > lbL and dat == Highest(dat, lbL+1) and _VStop
            then dat else _nan;
    } else {
        _V = if _BN > lbL and dat == Lowest(dat, lbL+1) and _VStop
            then dat else _nan;
    }
    plot result = if !IsNaN(_V) and _VStop then _V else _nan;
}
def ph =  findpivots(_H, 1, leftBars, rightBars);
def pl =  findpivots(_L, -1, leftBars, rightBars);

def ph_1 = if !isnan(ph) then ph else ph_1[1];
def pl_1 = if !isnan(pl) then pl else pl_1[1];

def hh = if !isnan(ph) and ph > ph_1[1] then ph else na;
def ll = if !isnan(pl) and pl < pl_1[1] then pl else na;

addchartbubble(ShowBubbles and ll, ll, "B", color.green, no);
addchartbubble(ShowBubbles and hh, hh, "S", color.red, yes);

# Breakuot
def hhValue = CompoundValue(1, if isNaN(hh) then hhValue[1] else _L, _L);
def llValue = CompoundValue(1, if isNan(ll) then llValue[1] else _H, _H);
def hhCount = if hhValue==hhValue[1] then hhCount[1]+1 else 0;
def llCount = if llValue==llValue[1] then llCount[1]+1 else 0;
def BreakDn = Crosses(_C, hhValue, CrossingDirection.BELOW) and hhCount<NoOfBreakoutBars;
def BreakUp = Crosses(_C, llValue, CrossingDirection.ABOVE) and llCount<NoOfBreakoutBars;

plot HLine =  if !ShowLines then na else hhValue ; #,color=red,style=circles,linewidth=1,offset=-1)
plot LLine =  if !ShowLines then na else llValue; #,color=green,style=circles,linewidth=1,offset=-1)
HLine.SetPaintingStrategy(PaintingStrategy.HORIZONTAL);
HLine.SetDefaultColor(Color.DARK_GREEN);
LLine.SetPaintingStrategy(PaintingStrategy.HORIZONTAL);
LLine.SetDefaultColor(Color.DARK_RED);

plot SigDn = if ShowArrow then if BreakDn then _H else na else na;
plot SigUp = if ShowArrow then if BreakUp then _L else na else na;
SigDn.SetPaintingStrategy(PaintingStrategy.ARROW_DOWN);
SigUp.SetPaintingStrategy(PaintingStrategy.ARROW_UP);
SigUp.SetDefaultColor(Color.WHITE);
SigDn.SetDefaultColor(Color.YELLOW);

#---- END Code
 
Love the indicator. Can you explain how you use it to scalp? Thanks
Did you know that by clicking on a member's name, you can easily check when they were last seen on the uTS forum? It's a great way to keep track of who's been around recently, and who hasn't. Speaking of which, it looks like @tomsk is no longer active. :(

Scalpers looks at a breakout above support as a sign of increased momentum.
No indicator can be used in isolation.
Combining this indicator with https://usethinkscript.com/threads/price-action-toolbox-for-thinkorswim.10747/ will provide you with a chart configuration that will aid in identifying potential scalping opportunities.
 
Pivot Study with Audible Alarms for Buy/Sell.... this is a mobious study, and definitely worth a try it also paints buy/sell wedges.

Code:
# Mobius
####EVANB ADDED CODE AT THE BOTTOM
# V01.08.2012

input n = 1;
input showLines = yes;
input showValues = Yes;
input showBarNumbers = no;

# Internal Script Reference
script LinePlot {
    input BarID = 0;
    input Value = 0;
    input BarOrigin = 0;
    def ThisBar = HighestAll(BarOrigin);
    def ValueLine = if BarOrigin == ThisBar
                then Value
                else Double.NaN;
    plot P = if ThisBar - BarID <= BarOrigin
             then HighestAll(ValueLine)
             else Double.NaN;
}
   def h = high;
   def l = low;
   def bar = barNumber();
   def PH;
   def PL;
   def hh = fold i = 1 to n + 1
            with p = 1
            while p
            do h > getValue(h, -i);
       PH = if (bar > n and
                h == highest(h, n) and
                hh)
            then h
            else double.NaN;
   def ll = fold j = 1 to n + 1 
            with q = 1
            while q
            do l < getValue(low, -j);
       PL = if (bar > n and
                l == lowest(l, n) and
                ll)
            then l
            else double.NaN;
   def PHBar = if !isNaN(PH)
               then bar
               else PHBar[1];
   def PLBar = if !isNaN(PL)
               then bar
               else PLBar[1];
   def PHL = if !isNaN(PH)
             then PH
             else PHL[1];
   def priorPHBar = if PHL != PHL[1]
                    then PHBar[1]
                    else priorPHBar[1];
   def PriorPH = if PHL != PHL[1]
                 then PHL[1]
                 else PriorPH[1];
   def PLL = if !isNaN(PL)
             then PL
             else PLL[1];
   def PriorPLBar = if PLL != PLL[1]
                    then PLBar[1]
                    else priorPLBar[1];
   def PriorPL = if PLL != PLL[1]
                 then PLL[1]
                 else PriorPL[1];
   def HighPivots = bar >= highestAll(priorPHBar);
   def LowPivots = bar >= highestAll(priorPLBar);
   def FirstRpoint = if HighPivots
                     then bar - PHBar
                     else 0;
   def PriorRpoint = if HighPivots
                     then bar - PriorPHBar
                     else 0;
   def RSlope = (getvalue(PH, FirstRpoint) - getvalue(PH, PriorRpoint))
                       / (PHBar - PriorPHBar);
   def FirstSpoint = if LowPivots
                     then bar - PLBar
                     else 0;
   def PriorSpoint = if LowPivots
                     then bar - PriorPLBar
                     else 0;
   def SSlope = (getvalue(PL, FirstSpoint) - getvalue(PL, PriorSpoint))
                   / (PLBar - PriorPLBar);
   def RExtend = if bar == highestall(PHBar)
                 then 1
                 else RExtend[1];
   def SExtend = if bar == highestall(PLBar)
                 then 1
                 else SExtend[1];
  plot PriorPHLine = LinePlot(PriorRPoint, PriorPH, PriorPHBar);
       PriorPHLine.SetStyle(Curve.Firm);
       PriorPHLine.SetDefaultColor(Color.Red);
  plot PivotHighLine = LinePlot(FirstRPoint, PH, PHBar);
       PivotHighLine.SetStyle(Curve.Firm);
       PivotHighLine.SetDefaultColor(Color.Red);
  plot pivotHigh = if HighPivots
                   then PH
                   else double.NaN;
       pivotHigh.SetDefaultColor(GetColor(1));
       pivotHigh.setPaintingStrategy(PaintingStrategy.VALUES_ABOVE);
       pivotHigh.setHiding(!showValues);
  plot RLine = pivotHigh;
       RLine.enableApproximation();
       RLine.SetDefaultColor(GetColor(7));
       RLine.SetStyle(Curve.Short_DASH);
  plot RExtension = if RExtend
                    then (bar - PHBar) * RSlope + PHL
                    else double.NaN;
       RExtension.SetStyle(Curve.Short_DASH);
       RExtension.SetDefaultColor(GetColor(7));
  plot PriorPLLine = LinePlot(PriorSPoint, PriorPL, PriorPLBar);
       PriorPLLine.SetStyle(Curve.Firm);
       PriorPLLine.SetDefaultColor(Color.Green);
  plot PivotLowLine = LinePlot(FirstSPoint, PL, PLBar);
       PivotLowLine.SetStyle(Curve.Firm);
       PivotLowLine.SetDefaultColor(Color.Green);
  plot pivotLow = if LowPivots
                   then PL
                   else double.NaN;
       pivotLow.SetDefaultColor(GetColor(1));
       pivotLow.setPaintingStrategy(PaintingStrategy.VALUES_ABOVE);
       pivotLow.setHiding(!showValues);
  plot SupportLine = pivotLow;
       SupportLine.enableApproximation();
       SupportLine.SetDefaultColor(GetColor(7));
       SUpportLine.SetStyle(Curve.Short_DASH);
  plot SupportExtension = if SExtend
                          then (bar - PLBar) * SSlope + PLL
                          else double.NaN;
       SupportExtension.SetDefaultColor(GetColor(7));
       SupportExtension.SetStyle(Curve.Short_DASH);


### EvanB #######
    plot buy = close[1] > pivotHighLine and high>high[1];
           buy.setPaintingstrategy(PaintingStrategy.BOOLEAN_WEDGE_UP);
           buy.SetDefaultColor(Color.green);

    plot sell = close[1] < pivotlowline  and low < low[1];     
       sell.setPaintingStrategy(PaintingStrategy.BOOLEAN_WEDGE_DOWN);
        sell.SetDefaultColor(Color.pink);
plot bo = close>open and high>high[1] and close > rextension;
bo.setPaintingstrategy(PaintingStrategy.BOOLEAN_WEDGE_UP);
           bo.SetDefaultColor(Color.green);
plot bd = close<open and low<low[1] and close < supportextension;
bd.setPaintingstrategy(PaintingStrategy.BOOLEAN_WEDGE_down);
           bd.SetDefaultColor(Color.pink);

Alert(condition = buy, text = "Buy", "alert type" = Alert.BAR, sound = Sound.Ding);
Alert(condition = sell, text = "Sell", "alert type" = Alert.BAR, sound = Sound.Ding);
Alert(condition = bo, text = "Breakout", "alert type" = Alert.BAR, sound = Sound.Ring);
Alert(condition = bd, text = "Breakdown", "alert type" = Alert.BAR, sound = Sound.Ring);
Is there any way you can update the code to have the support and resistance lines extend all the way to the left side of the screen?
 
Please help....I have tried everything to figure this out on my own for a while now and I am still stuck. If anyone can guide me on how I can do it. I will be extremely grateful. I have used the code in this chat and modified it slightly to show me the pivot high and pivot low based on the hourly close. My challenge is that I would like to highlight in a chart with arrows or with a gray consolidation box (and eventually turn into a scanner) when there are 2 or more pivot highs (i.e., HHX) or pivot lows (LLX) within a 1% range of each other.

In the image below, I am encircling in yellow the examples I am looking to identify. On June 15th TSLA had 3 HHX values (including those in after-hours) that were within 1% (or whatever percentage I chose ) of each other. (i.e., $257.335, 257.50, and 257.86). What I cannot figure out is how to code around the fact that HHX code or even the other values (e.g., HLine or hhvalue) is looking up the value for each hourly bar. What I am trying to compare is the new HHX value to the last time there was an older HHX value. In the example above, it would compare the three different HHX values and highlight in some way that this was an area of consolidation based on the hourly close.

Ideally, I would love to be able to identify in some way when at least 2 different HHX values are within a 1% range.

I sincerely thank anyone in advance for any help you can provide that helps me figure this challenge out.

Screenshot 2023-07-09 160009.png


Below is the code I am using...

#-------------------------------------------------------------------------------------------;

declare upper;
def AggregationPeriod = AggregationPeriod.HOUR;
input rightBars = 1;
input leftBars = 1;
input NoOfBreakoutBars = 3;
input ShowArrow = yes;
input ShowLines = yes;
input ShowBubbles = yes;


#def _BN = BarNumber(); # current barnumber
def na = Double.NaN; # non-numeric values
def _H = close(period = AggregationPeriod); # high price
def _L = close(period = AggregationPeriod); # low price
def _C = close(period = AggregationPeriod); # close price
def _O = open(period = AggregationPeriod); # open price

script FindPivots {
input dat = close; # default data or study being evaluated
input HL = 0; # default high or low pivot designation, -1 low, +1 high
input lbL = 5; # default Pivot Lookback Left
input lbR = 1; # default Pivot Lookback Right
##############
def _nan; # used for non-number returns
def _BN; # the current barnumber
def _VStop; # confirms that the lookforward period continues the pivot trend
def _V; # the Value at the actual pivot point
##############
_BN = BarNumber();
_nan = Double.NaN;
_VStop = if !IsNaN(dat) and lbR > 0 and lbL > 0 then
fold a = 1 to lbR + 1 with b=1 while b do
if HL > 0 then dat > GetValue(dat, -a) else dat < GetValue(dat, -a) else _nan;
if (HL > 0) {
_V = if _BN > lbL and dat == Highest(dat, lbL + 1) and _VStop
then dat else _nan;
} else {
_V = if _BN > lbL and dat == Lowest(dat, lbL + 1) and _VStop
then dat else _nan;
}
plot result = if !IsNaN(_V) and _VStop then _V else _nan;
}
def ph = findpivots(_H, 1, leftBars, rightBars);
def pl = findpivots(_L, -1, leftBars, rightBars);

def ph_1 = if !IsNaN(ph) then ph else ph_1[1];
def pl_1 = if !IsNaN(pl) then pl else pl_1[1];

def hhx = if !IsNaN(ph) and ph > ph_1[1] then ph else na;
def llx = if !IsNaN(pl) and pl < pl_1[1] then pl else na;

# Breakuot
def hhValue = CompoundValue(1, if IsNaN(hhx) then hhValue[1] else _L, _L);
def llValue = CompoundValue(1, if IsNaN(llx) then llValue[1] else _H, _H);

plot HLine = if !ShowLines then na else hhValue ;
plot LLine = if !ShowLines then na else llValue; #,color=green,style=circles,linewidth=1,offset=-1)

HLine.SetPaintingStrategy(PaintingStrategy.HORIZONTAL);
HLine.SetDefaultColor(Color.YELLOW);
HLine.SetLineWeight(2);

LLine.SetPaintingStrategy(PaintingStrategy.HORIZONTAL);
LLine.SetDefaultColor(Color.PINK);
LLine.SetLineWeight(2);


addchartbubble(yes, hhx, hhx,color.magenta, yes);


input percentageThreshold = 10; #// Percentage difference threshold

def hhxDiff = AbsValue(hhx - hhx[1]);
def percentageDiff = (hhxDiff / hhx[1]) * 100;

def twoOrMoreHHX = if !IsNaN(hhx) and !IsNaN(hhx[1]) and percentageDiff <= percentageThreshold then 1 else 0;

plot UpArrow = if twoOrMoreHHX >= 1 then low - (TickSize() * 2) else Double.NaN;
UpArrow.SetPaintingStrategy(PaintingStrategy.BOOLEAN_ARROW_UP);
UpArrow.SetDefaultColor(Color.GREEN);
Uparrow.SetLineWeight(5);

#---- END Code
 
Last edited:
hello! Can I set up a scanner to select stocks? I select the stock at 4H and see how far the price is from the green PivotNightLine. Is it possible to set up a scanner when at the moment the price crosses the PivotNightLine at the current price by 4H? I enter on 1m or 5m. Thank you!
 
Last edited by a moderator:
hello! Can I set up a scanner to select stocks? I select the stock at 4H and see how far the price is from the green PivotNightLine. Is it possible to set up a scanner when at the moment the price crosses the PivotNightLine at the current price by 4H? I enter on 1m or 5m. Thank you!
I am assuming that "4H"? and "green PivotNightLine"? are plots from some script in this thread?
If so, yes, you can scan for any plots in a script that is not complex.
Here is the scanner tutorial:
https://usethinkscript.com/threads/how-to-use-thinkorswim-stock-hacker-scans.284/
 
If you're having trouble with drawing trend lines, support and resistance levels then this indicator can help. It's called Projection Pivots, developed by Mobius for ThinkorSwim.

Upon adding the indicator, it will plot several trend lines, support, and resistance channels based on critical pivot points of the stock.

View attachment 4495

What I normally do is load this up at the end of each trading day and plot new S/R areas onto my chart based on the suggestion of the Projection Pivots indicator. I would also do this at the end of the week as well. It's important that you have these levels up to date on your chart.

thinkScript Code

Rich (BB code):
#ProjectionPivots_v03_JQ
#03.04.2019
#Original Code and Concept by Mobius:
# V01.08.2012 Projection Pivots
# mobius

# Notes:
# 03.04.2019 added linits on extensions
# 03.05.2019 adjusted limits on extensions by adding user input upper and lower extenion percent limits

#declare Once_Per_Bar;
#Inputs
input n = 21;
input showLines = yes;
input showValues = no;
input showBarNumbers = no;
input ExtensionLengthBars = 20; # added to control length of Entension
input UpperExtensionPercentLimit = 5;
input LowerExtensionPercentLimit = 5;
input DisplayLabel = yes;    #JQ 7.8.2018 added
    addlabel (DisplayLabel, "Projection Pivots n:" + n + " " , color.WHITE);    #JQ 7.8.2018 added

 
# Universal Header _v030429019 _JQ
#     code from various sources including Mobius, NoLongerNube and others
# Comment out unnecessary portions to preserve tos memory and enhance speed

# Universal Definitions using Padawan variable naming convention (JQ) v03.04.2019
# iData Definitions
    def vHigh = high;  # creates the variable vHigh.  Use of the variable reduce data calls to tos iData server
#    def initHigh =  CompoundValue(1, high, high);  # creates and initialized variable for High
    def vLow = low;
#    def initLow = CompoundValue(1, low, low);
    def vOpen = open;
#    def initOpen = CompoundValue(1, open, open);
    def vClose = close;
#    def initClose = CompoundValue(1, close, close);
    def vVolume = volume;
#    def initVolume = CompoundValue(1, volume, volume);
    def nan = Double.NaN;
# Bar Time & Date
    def bn = BarNumber();
    def currentBar = HighestAll(if !IsNaN(vHigh) then bn else nan);
#    def Today = GetDay() ==GetLastDay();
#    def time = GetTime();
#    def GlobeX = GetTime() < RegularTradingStart(GetYYYYMMDD());
    # def globeX_v2 = if time crosses below RegularTradingEnd(GetYYYYMMDD()) then bn else GlobeX[1];
#    def RTS  = RegularTradingStart(GetYYYYMMDD());
#    def RTE  = RegularTradingEnd(GetYYYYMMDD());
#    def RTH = GetTime() > RegularTradingStart(GetYYYYMMDD());
#    def RTH_v2 = if time crosses above RegularTradingStart(GetYYYYMMDD()) then bn else RTH[1];

# bars that start and end the sessions  #(borrowed from nube)
#    def rthStartBar    = CompoundValue(1,
#                         if   !IsNaN(vClose)
#                         &&   time crosses above RegularTradingStart(GetYYYYMMDD())
#                         then bn
#                         else rthStartBar[1], 0);
#    def rthEndBar      = CompoundValue(1,
#                         if   !IsNaN(vClose)
#                         &&   time crosses above RegularTradingEnd(GetYYYYMMDD())
#                         then bn
#                         else rthEndBar[1], 1);
#    def globexStartBar = CompoundValue(1,
#                         if   !IsNaN(vClose)
#                         &&   time crosses below RegularTradingEnd(GetYYYYMMDD())
#                         then bn
#                         else globexStartBar[1], 1);
#    def rthSession = if   bn crosses above rthStartBar #+ barsExtendedBeyondSession
#                     then 1
#                     else if   bn crosses above rthEndBar #+ barsExtendedBeyondSession
#                          then 0
#                     else rthSession[1];

# Bubble Locations
    def x_AxisLastExpansionBar = BarNumber() == HighestAll(BarNumber());  #corrected 11.12.2018 (JQ)
        # syntax: addChartBubble(x_AxisLastExpansionBar, y-axis coordinate," text", Color.LIME); #verified 12.25.2018 (JQ)

def PH;
   def PL;
   def hh = fold i = 1 to n + 1
            with p = 1
            while p
            do vHigh > getValue(vHigh, -i);
       PH = if (bn > n and
                vHigh == highest(vHigh, n) and
                hh)
            then vHigh
            else double.NaN;
   def ll = fold j = 1 to n + 1
            with q = 1
            while q
            do vLow < getValue(low, -j);
       PL = if (bn > n and
                vLow == lowest(vLow, n) and
                ll)
            then vLow
            else double.NaN;
   def PHBar = if !isNaN(PH)
               then bn
               else PHBar[1];
   def PLBar = if !isNaN(PL)
               then bn
               else PLBar[1];
   def PHL = if !isNaN(PH)
             then PH
             else PHL[1];
   def priorPHBar = if PHL != PHL[1]
                    then PHBar[1]
                    else priorPHBar[1];
   def PLL = if !isNaN(PL)
             then PL
             else PLL[1];
   def priorPLBar = if PLL != PLL[1]
                    then PLBar[1]
                    else priorPLBar[1];
   def HighPivots = bn >= highestAll(priorPHBar);
   def LowPivots = bn >= highestAll(priorPLBar);
   def FirstRpoint = if HighPivots
                     then bn - PHBar
                     else 0;
   def PriorRpoint = if HighPivots
                     then bn - PriorPHBar
                     else 0;
   def RSlope = (getvalue(PH, FirstRpoint) - getvalue(PH, PriorRpoint))
                       / (PHBar - PriorPHBar);
   def FirstSpoint = if LowPivots
                     then bn - PLBar
                     else 0;
   def PriorSpoint = if LowPivots
                     then bn - PriorPLBar
                     else 0;
   def SSlope = (getvalue(PL, FirstSpoint) - getvalue(PL, PriorSpoint))
                   / (PLBar - PriorPLBar);
   def RExtend = if bn == highestall(PHBar)
                 then 1
                 else RExtend[1];
   def SExtend = if bn == highestall(PLBar)
                 then 1
                 else SExtend[1];

  plot pivotHigh = if HighPivots
                   then PH
                   else double.NaN;
       pivotHigh.SetDefaultColor(GetColor(1));
       pivotHigh.setPaintingStrategy(PaintingStrategy.VALUES_ABOVE);
       pivotHigh.setHiding(!showValues);

  plot pivotHighLine = if PHL > 0 and
                          HighPivots
                       then PHL
                       else double.NaN;
       pivotHighLine.SetPaintingStrategy(PaintingStrategy.DASHES);  # Mobius original was DASHES
       pivotHighLine.setDefaultColor(color.uptick);    #JQ 7.8.2018 added
       pivotHighLine.setHiding(!showLines);

  plot RLine = pivotHigh;
       RLine.enableApproximation();
       RLine.SetDefaultColor(Color.LIGHT_GRAY);
       RLine.SetStyle(Curve.Short_DASH);

# Added code to limit resistance estension line (JQ 03.04.2019)
  def calc_ResistanceExtension = if RExtend
                    then (bn - PHBar) * RSlope + PHL
                    else double.NaN;
  plot line_ResistanceExtension = if bn <= (Currentbar + ExtensionLengthBars)
                                   and calc_ResistanceExtension[1] >=  (lowestall(vLow) * (1-(lowerExtensionPercentLimit/100)))
                                   and calc_ResistanceExtension[1] <= (Highestall(vHigh) * (1 + (upperExtensionPercentLimit/100)))
                               then calc_ResistanceExtension else double.nan;
       line_ResistanceExtension.SetStyle(Curve.Short_DASH);
       line_ResistanceExtension.SetDefaultColor(color.LIGHT_GRAY); #was 7
       line_ResistanceExtension.setLineWeight(1);

# Low Plots
  plot pivotLow = if LowPivots
                  then PL
                  else double.NaN;
       pivotLow.setDefaultColor(GetColor(4));
       pivotLow.setPaintingStrategy(PaintingStrategy.VALUES_BELOW);
       pivotLow.setHiding(!showValues);

  plot pivotLowLine = if PLL > 0 and
                         LowPivots
                      then PLL
                      else double.NaN;
       pivotLowLine.SetPaintingStrategy(PaintingStrategy.DASHES);  # Mobius original was DASHES
       pivotLowLine.setDefaultColor(color.DOWNTICK);#  #  JQ 7.8.2018 added
       pivotLowLine.setHiding(!showLines);

  plot SupportLine = pivotLow;
       SupportLine.enableApproximation();
       SupportLine.SetDefaultColor(color.LIGHT_GRAY);
       SUpportLine.SetStyle(Curve.Short_DASH);

# Added code to limit support estension line (JQ 03.04.2019)
  def calc_SupportExtension = if SExtend
                          then (bn - PLBar) * SSlope + PLL
                          else double.NaN;
  plot line_SupportExtension = if bn <= (Currentbar + ExtensionLengthBars)
                                   and calc_SupportExtension[1] >= (lowestall(vLow) * (1-(lowerExtensionPercentLimit/100)))
                                   and calc_SupportExtension[1] <= (Highestall(vHigh) * (1 + (upperExtensionPercentLimit/100)))
                               then calc_supportExtension else double.nan;
       line_SupportExtension.SetDefaultColor(color.LIGHT_GRAY); #was 7
       line_SupportExtension.SetStyle(Curve.Short_DASH);
       line_SupportExtension.setLineWeight(1);

  plot BarNumbersBelow = bn;
       BarNumbersBelow.SetDefaultColor(GetColor(0));
       BarNumbersBelow.setHiding(!showBarNumbers);
       BarNumbersBelow.SetPaintingStrategy(PaintingStrategy.VALUES_BELOW);

  plot PivotDot = if !isNaN(pivotHigh)
                  then pivotHigh
                  else if !isNaN(pivotLow)
                  then pivotLow
                  else double.NaN;
       pivotDot.SetDefaultColor(GetColor(7));
       pivotDot.SetPaintingStrategy(PaintingStrategy.POINTS);
       pivotDot.SetLineWeight(3);

# End Code

Shareable Link

https://tos.mx/WhZxG6

Video Tutorial

Hi Ben.

I saw this comment in the scripts -> Use of the variable reduce data calls to tos iData server

True statement?

Thanks!
 
See if this helps. This is the study in the first post now with multi-timeframe capability.

The chart displayed below has a 1min chart, 1min and 5min versions of the script below.
I tried having the daily levels show up on the smaller time frames, but they are never the same level as show on the daily chart. I have tried changing the "n" value and still can't get them to match up. Any advice on how to get it to match up correctly?

Also do you know if it's possible to have older S/R levels stay on the chart?

Below is the original script in post #1 that will draw additional pivots and lines, limited by the number input at show_x_pivots

Regrettably, the multi-timeframe additon, using the standard methodology, does not work well with this indicator. If possible to get matches between charts and timeframes, especially as in your example, would likely take much more logic than the standard method. If you find that higher level charts would be useful, then it would be best at this time to create a grid with multiple charts.

The image shows pivots and lines based upon input show_x_pivots = 8; The extended dashed lines are left with the original last 2 pivots being used for highs/lows

Screenshot 2023-10-28 142949.png
Code:
#ProjectionPivots_v03_JQ
#03.04.2019
#Original Code and Concept by Mobius:
# V01.08.2012 Projection Pivots
# mobius

# Notes:
# 03.04.2019 added linits on extensions
# 03.05.2019 adjusted limits on extensions by adding user input upper and lower extenion percent limits
# 10.28.2023 Added ability to plot additional pivots and lines, limited by # input atan show_x_pivots

#declare Once_Per_Bar;
#Inputs
input show_x_pivots = 8;
input n = 21;
input showLines = yes;
input showValues = no;
input showBarNumbers = no;
input ExtensionLengthBars = 20; # added to control length of Entension
input UpperExtensionPercentLimit = 5;
input LowerExtensionPercentLimit = 5;
input DisplayLabel = yes;    #JQ 7.8.2018 added
AddLabel (DisplayLabel, "Projection Pivots n:" + n + " " , Color.WHITE);    #JQ 7.8.2018 added

 
# Universal Header _v030429019 _JQ
#     code from various sources including Mobius, NoLongerNube and others
# Comment out unnecessary portions to preserve tos memory and enhance speed

# Universal Definitions using Padawan variable naming convention (JQ) v03.04.2019
# iData Definitions
def vHigh = high;  # creates the variable vHigh.  Use of the variable reduce data calls to tos iData server
#    def initHigh =  CompoundValue(1, high, high);  # creates and initialized variable for High
def vLow = low;
#    def initLow = CompoundValue(1, low, low);
def vOpen = open;
#    def initOpen = CompoundValue(1, open, open);
def vClose = close;
#    def initClose = CompoundValue(1, close, close);
def vVolume = volume;
#    def initVolume = CompoundValue(1, volume, volume);
def nan = Double.NaN;
# Bar Time & Date
def bn = BarNumber();
def currentBar = HighestAll(if !IsNaN(vHigh) then bn else nan);
#    def Today = GetDay() ==GetLastDay();
#    def time = GetTime();
#    def GlobeX = GetTime() < RegularTradingStart(GetYYYYMMDD());
    # def globeX_v2 = if time crosses below RegularTradingEnd(GetYYYYMMDD()) then bn else GlobeX[1];
#    def RTS  = RegularTradingStart(GetYYYYMMDD());
#    def RTE  = RegularTradingEnd(GetYYYYMMDD());
#    def RTH = GetTime() > RegularTradingStart(GetYYYYMMDD());
#    def RTH_v2 = if time crosses above RegularTradingStart(GetYYYYMMDD()) then bn else RTH[1];

# bars that start and end the sessions  #(borrowed from nube)
#    def rthStartBar    = CompoundValue(1,
#                         if   !IsNaN(vClose)
#                         &&   time crosses above RegularTradingStart(GetYYYYMMDD())
#                         then bn
#                         else rthStartBar[1], 0);
#    def rthEndBar      = CompoundValue(1,
#                         if   !IsNaN(vClose)
#                         &&   time crosses above RegularTradingEnd(GetYYYYMMDD())
#                         then bn
#                         else rthEndBar[1], 1);
#    def globexStartBar = CompoundValue(1,
#                         if   !IsNaN(vClose)
#                         &&   time crosses below RegularTradingEnd(GetYYYYMMDD())
#                         then bn
#                         else globexStartBar[1], 1);
#    def rthSession = if   bn crosses above rthStartBar #+ barsExtendedBeyondSession
#                     then 1
#                     else if   bn crosses above rthEndBar #+ barsExtendedBeyondSession
#                          then 0
#                     else rthSession[1];

# Bubble Locations
def x_AxisLastExpansionBar = BarNumber() == HighestAll(BarNumber());  #corrected 11.12.2018 (JQ)
        # syntax: addChartBubble(x_AxisLastExpansionBar, y-axis coordinate," text", Color.LIME); #verified 12.25.2018 (JQ)

def PH;
def PL;
def hh = fold i = 1 to n + 1
            with p = 1
            while p
            do vHigh > GetValue(vHigh, -i);
PH = if (bn > n and
                vHigh == Highest(vHigh, n) and
                hh)
            then vHigh
            else Double.NaN;
def ll = fold j = 1 to n + 1
            with q = 1
            while q
            do vLow < GetValue(low, -j);
PL = if (bn > n and
                vLow == Lowest(vLow, n) and
                ll)
            then vLow
            else Double.NaN;
def PHBar = if !IsNaN(PH)
               then bn
               else PHBar[1];
def PLBar = if !IsNaN(PL)
               then bn
               else PLBar[1];
def PHL = if !IsNaN(PH)
             then PH
             else PHL[1];
def priorPHBar = if PHL != PHL[1]
                    then PHBar[1]
                    else priorPHBar[1];
def PLL = if !IsNaN(PL)
             then PL
             else PLL[1];
def priorPLBar = if PLL != PLL[1]
                    then PLBar[1]
                    else priorPLBar[1];
def HighPivots = bn >= HighestAll(priorPHBar);


def LowPivots = bn >= HighestAll(priorPLBar);
def FirstRpoint = if HighPivots
                     then bn - PHBar
                     else 0;
def PriorRpoint = if HighPivots
                     then bn - priorPHBar
                     else 0;
def RSlope = (GetValue(PH, FirstRpoint) - GetValue(PH, PriorRpoint))
                       / (PHBar - priorPHBar);
def FirstSpoint = if LowPivots
                     then bn - PLBar
                     else 0;
def PriorSpoint = if LowPivots
                     then bn - priorPLBar
                     else 0;
def SSlope = (GetValue(PL, FirstSpoint) - GetValue(PL, PriorSpoint))
                   / (PLBar - priorPLBar);
def RExtend = if bn == HighestAll(PHBar)
                 then 1
                 else RExtend[1];
def SExtend = if bn == HighestAll(PLBar)
                 then 1
                 else SExtend[1];

#Count PivotHighs to be used to Limit Plots
def datacounth = if !IsNaN(PH) then datacounth[1] + 1 else datacounth[1];

plot pivotHigh = if HighestAll(datacounth) - datacounth <= show_x_pivots - 1 then
                   PH
                   else Double.NaN;
pivotHigh.SetDefaultColor(GetColor(1));
pivotHigh.SetPaintingStrategy(PaintingStrategy.VALUES_ABOVE);
pivotHigh.SetHiding(!showValues);

plot pivotHighLine = if HighestAll(datacounth) - datacounth <= show_x_pivots - 1
#if PHL > 0 and HighPivots
                       then PHL
                       else Double.NaN;
pivotHighLine.SetPaintingStrategy(PaintingStrategy.DASHES);  # Mobius original was DASHES
pivotHighLine.SetDefaultColor(Color.UPTICK);    #JQ 7.8.2018 added
pivotHighLine.SetHiding(!showLines);

plot RLine = pivotHigh;
RLine.EnableApproximation();
RLine.SetDefaultColor(Color.LIGHT_GRAY);
RLine.SetStyle(Curve.SHORT_DASH);

# Added code to limit resistance estension line (JQ 03.04.2019) to last 2 PivotHighs
def calc_ResistanceExtension = if RExtend
                    then (bn - PHBar) * RSlope + PHL
                    else Double.NaN;
plot line_ResistanceExtension = if bn <= (currentBar + ExtensionLengthBars)
                                   and calc_ResistanceExtension[1] >=  (LowestAll(vLow) * (1 - (LowerExtensionPercentLimit / 100)))
                                   and calc_ResistanceExtension[1] <= (HighestAll(vHigh) * (1 + (UpperExtensionPercentLimit / 100)))
                               then calc_ResistanceExtension else Double.NaN;
line_ResistanceExtension.SetStyle(Curve.SHORT_DASH);
line_ResistanceExtension.SetDefaultColor(Color.LIGHT_GRAY); #was 7
line_ResistanceExtension.SetLineWeight(1);

# Low Plots

#Count PivotLows to be used to Limit Plots
def datacountl = if !IsNaN(PL) then datacounth[1] + 1 else datacounth[1];

plot pivotLow = if HighestAll(datacountl) - datacountl <= show_x_pivots - 1
#if LowPivots
                  then PL
                  else Double.NaN;
pivotLow.SetDefaultColor(GetColor(4));
pivotLow.SetPaintingStrategy(PaintingStrategy.VALUES_BELOW);
pivotLow.SetHiding(!showValues);

plot pivotLowLine = if HighestAll(datacountl) - datacountl <= show_x_pivots - 1
#if PLL > 0 and  LowPivots
                      then PLL
                      else Double.NaN;
pivotLowLine.SetPaintingStrategy(PaintingStrategy.DASHES);  # Mobius original was DASHES
pivotLowLine.SetDefaultColor(Color.DOWNTICK);#  #  JQ 7.8.2018 added
pivotLowLine.SetHiding(!showLines);

plot SupportLine = pivotLow;
SupportLine.EnableApproximation();
SupportLine.SetDefaultColor(Color.LIGHT_GRAY);
SupportLine.SetStyle(Curve.SHORT_DASH);

# Added code to limit support estension line (JQ 03.04.2019) to last 2 PivotLows
def calc_SupportExtension = if SExtend
                          then (bn - PLBar) * SSlope + PLL
                          else Double.NaN;
plot line_SupportExtension = if bn <= (currentBar + ExtensionLengthBars)
                                   and calc_SupportExtension[1] >= (LowestAll(vLow) * (1 - (LowerExtensionPercentLimit / 100)))
                                   and calc_SupportExtension[1] <= (HighestAll(vHigh) * (1 + (UpperExtensionPercentLimit / 100)))
                               then calc_SupportExtension else Double.NaN;
line_SupportExtension.SetDefaultColor(Color.LIGHT_GRAY); #was 7
line_SupportExtension.SetStyle(Curve.SHORT_DASH);
line_SupportExtension.SetLineWeight(1);

plot BarNumbersBelow = bn;
BarNumbersBelow.SetDefaultColor(GetColor(0));
BarNumbersBelow.SetHiding(!showBarNumbers);
BarNumbersBelow.SetPaintingStrategy(PaintingStrategy.VALUES_BELOW);

plot PivotDot = if !IsNaN(pivotHigh)
                  then pivotHigh
                  else if !IsNaN(pivotLow)
                  then pivotLow
                  else Double.NaN;
PivotDot.SetDefaultColor(GetColor(7));
PivotDot.SetPaintingStrategy(PaintingStrategy.POINTS);
PivotDot.SetLineWeight(3);

# End Code
 
Last edited:
Below is the original script in post #1 that will draw additional pivots and lines, limited by the number input at show_x_pivots

Regrettably, the multi-timeframe additon, using the standard methodology, does not work well with this indicator. If possible to get matches between charts and timeframes, especially as in your example, would likely take much more logic the standard method. If you find that higher level charts would be useful, then it would be best at this time to create a grid with multiple charts.

The image shows pivots and lines based upon input show_x_pivots = 8; The extended dashed lines are left with the original last 2 pivots being used for highs/lows

would it be difficult to convert this auto pivot indicator so that it detects the high and low on the chart and uses that as the high and low pivots? otherwise you have to constantly adjust it. just wondering if it's possible?

My point is not to draw multi time frame pivots. Just where to start drawing the pivot. Like for example, I want the n value to start at the beginning of last month, or the beginning of last quarter or even at the beginning of last year.
 
Last edited by a moderator:
would it be difficult to convert this auto pivot indicator so that it detects the high and low on the chart and uses that as the high and low pivots? otherwise you have to constantly adjust it. just wondering if it's possible?

My point is not to draw multi time frame pivots. Just where to start drawing the pivot. Like for example, I want the n value to start at the beginning of last month, or the beginning of last quarter or even at the beginning of last year.

What you describe appears to be a trendline.

The following code will link the highestall(high) and lowestall{low dependent on the selection of the period at input type. It will then draw a trendline based upon the highestall(high)/lowestall(low) within the type selected. Make sure your chart has a long enough timeframe to cover the type selected.

Screenshot 2023-11-13 044522.png
Code:
#Trendline_HHLL_Period_Selected_at_Input_Type

input type = {default Chart, Day, Week, Month, Quarter, Year};
input back = 1;
input showvertical = yes;
input showlabel    = yes;

def hh;
def ll;
def begin;
def bn     = BarNumber();
def cond1;
def cond2;

#Days
def ymd = GetYYYYMMDD();
def ok  = !IsNaN(close);
def capture  = ok and ymd != ymd[1];
def dayCount = CompoundValue(1, if capture then dayCount[1] + 1 else dayCount[1], 0);
def thisDay  = (HighestAll(dayCount) - dayCount) + 1 ;

#Weeks
def wk = GetWeek();
def capturewk  = ok and wk != wk[1];
def wkCount = CompoundValue(1, if capturewk then wkCount[1] + 1 else wkCount[1], 0);
def thisweek  = (HighestAll(wkCount) - wkCount) + 1 ;

#Months
def mo = GetMonth();
def capturemo  = ok and mo != mo[1];
def moCount = CompoundValue(1, if capturemo  then moCount[1] + 1 else moCount[1], 0);
def thismo  = (HighestAll(moCount) - moCount) + 1 ;

#Quarters
def quarter = if GetMonth() == 1 then 1 else if GetMonth() == 4 then 2 else if GetMonth() == 7 then 3 else if GetMonth() == 10 then 4 else quarter[1];
def captureqtr  = ok and quarter != quarter[1];
def qtrCount = CompoundValue(1, if captureqtr then qtrCount[1] + 1 else qtrCount[1], 0);
def thisqtr  = (HighestAll(qtrCount) - qtrCount) + 1 ;

#Years
def yr = GetYear();
def captureyr  = ok and yr != yr[1];
def yrCount = CompoundValue(1, if captureyr then yrCount[1] + 1 else yrCount[1], 0);
def thisyr  = (HighestAll(yrCount) - yrCount) + 1 ;

switch (type) {
case Chart:
    hh = high == HighestAll(high);
    ll = low == LowestAll(low);
    begin = if highestall(cond2)>highestall(cond1) then hh else ll;

case Day:
    hh = high == if thisDay == back then high(period = AggregationPeriod.DAY) else hh[1];
    ll = low  == if thisDay == back then low(period = AggregationPeriod.DAY) else ll[1];
    begin = thisDay[1] == back + 1 and thisDay == back;

case Week:
    hh = high == if thisweek == back then high(period = AggregationPeriod.WEEK) else hh[1];
    ll = low  == if thisweek == back then low(period = AggregationPeriod.WEEK) else ll[1];
    begin = thisweek[1] == back + 1 and thisweek == back;

case Month:
    hh = high == if thismo == back then high(period = AggregationPeriod.MONTH) else hh[1];
    ll = low  == if thismo == back then low(period = AggregationPeriod.MONTH) else ll[1];
    begin = thismo[1] == back + 1 and thismo == back;

case Quarter:
    hh = high == if thisqtr == back then high(period = AggregationPeriod.QUARTER) else hh[1];
    ll = low  == if thisqtr == back then low(period = AggregationPeriod.QUARTER) else ll[1];
    begin = thisqtr[1] == back + 1 and thisqtr == back;

case Year:
    hh = high == if thisyr == back then high(period = AggregationPeriod.YEAR) else hh[1];
    ll = low  == if thisyr == back then low(period = AggregationPeriod.YEAR) else ll[1];
    begin = thisyr[1] == back + 1 and thisyr == back;

}
;

 cond1  = if hh then bn else cond1[1];
 cond2  = if ll then bn else cond2[1];
AddVerticalLine(showvertical and begin, "Begin   " + type, Color.WHITE);
AddLabel(showlabel, "HH/LL Basis " + type, Color.YELLOW);

plot  line     = if bn == HighestAll(cond1) then high else if bn == HighestAll(cond2) then low else Double.NaN;
line.EnableApproximation();
line.SetDefaultColor(Color.WHITE);
line.SetLineWeight(2);
 
shouldn't there be one trendline connect to the two most highest points through the period and another connecting to the two lowest points throughout the period with pivots connecting as well?
 
If you're having trouble with drawing trend lines, support and resistance levels then this indicator can help. It's called Projection Pivots, developed by Mobius for ThinkorSwim.

Upon adding the indicator, it will plot several trend lines, support, and resistance channels based on critical pivot points of the stock.

View attachment 4495

What I normally do is load this up at the end of each trading day and plot new S/R areas onto my chart based on the suggestion of the Projection Pivots indicator. I would also do this at the end of the week as well. It's important that you have these levels up to date on your chart.

thinkScript Code

Rich (BB code):
#ProjectionPivots_v03_JQ
#03.04.2019
#Original Code and Concept by Mobius:
# V01.08.2012 Projection Pivots
# mobius

# Notes:
# 03.04.2019 added linits on extensions
# 03.05.2019 adjusted limits on extensions by adding user input upper and lower extenion percent limits

#declare Once_Per_Bar;
#Inputs
input n = 21;
input showLines = yes;
input showValues = no;
input showBarNumbers = no;
input ExtensionLengthBars = 20; # added to control length of Entension
input UpperExtensionPercentLimit = 5;
input LowerExtensionPercentLimit = 5;
input DisplayLabel = yes;    #JQ 7.8.2018 added
    addlabel (DisplayLabel, "Projection Pivots n:" + n + " " , color.WHITE);    #JQ 7.8.2018 added

 
# Universal Header _v030429019 _JQ
#     code from various sources including Mobius, NoLongerNube and others
# Comment out unnecessary portions to preserve tos memory and enhance speed

# Universal Definitions using Padawan variable naming convention (JQ) v03.04.2019
# iData Definitions
    def vHigh = high;  # creates the variable vHigh.  Use of the variable reduce data calls to tos iData server
#    def initHigh =  CompoundValue(1, high, high);  # creates and initialized variable for High
    def vLow = low;
#    def initLow = CompoundValue(1, low, low);
    def vOpen = open;
#    def initOpen = CompoundValue(1, open, open);
    def vClose = close;
#    def initClose = CompoundValue(1, close, close);
    def vVolume = volume;
#    def initVolume = CompoundValue(1, volume, volume);
    def nan = Double.NaN;
# Bar Time & Date
    def bn = BarNumber();
    def currentBar = HighestAll(if !IsNaN(vHigh) then bn else nan);
#    def Today = GetDay() ==GetLastDay();
#    def time = GetTime();
#    def GlobeX = GetTime() < RegularTradingStart(GetYYYYMMDD());
    # def globeX_v2 = if time crosses below RegularTradingEnd(GetYYYYMMDD()) then bn else GlobeX[1];
#    def RTS  = RegularTradingStart(GetYYYYMMDD());
#    def RTE  = RegularTradingEnd(GetYYYYMMDD());
#    def RTH = GetTime() > RegularTradingStart(GetYYYYMMDD());
#    def RTH_v2 = if time crosses above RegularTradingStart(GetYYYYMMDD()) then bn else RTH[1];

# bars that start and end the sessions  #(borrowed from nube)
#    def rthStartBar    = CompoundValue(1,
#                         if   !IsNaN(vClose)
#                         &&   time crosses above RegularTradingStart(GetYYYYMMDD())
#                         then bn
#                         else rthStartBar[1], 0);
#    def rthEndBar      = CompoundValue(1,
#                         if   !IsNaN(vClose)
#                         &&   time crosses above RegularTradingEnd(GetYYYYMMDD())
#                         then bn
#                         else rthEndBar[1], 1);
#    def globexStartBar = CompoundValue(1,
#                         if   !IsNaN(vClose)
#                         &&   time crosses below RegularTradingEnd(GetYYYYMMDD())
#                         then bn
#                         else globexStartBar[1], 1);
#    def rthSession = if   bn crosses above rthStartBar #+ barsExtendedBeyondSession
#                     then 1
#                     else if   bn crosses above rthEndBar #+ barsExtendedBeyondSession
#                          then 0
#                     else rthSession[1];

# Bubble Locations
    def x_AxisLastExpansionBar = BarNumber() == HighestAll(BarNumber());  #corrected 11.12.2018 (JQ)
        # syntax: addChartBubble(x_AxisLastExpansionBar, y-axis coordinate," text", Color.LIME); #verified 12.25.2018 (JQ)

def PH;
   def PL;
   def hh = fold i = 1 to n + 1
            with p = 1
            while p
            do vHigh > getValue(vHigh, -i);
       PH = if (bn > n and
                vHigh == highest(vHigh, n) and
                hh)
            then vHigh
            else double.NaN;
   def ll = fold j = 1 to n + 1
            with q = 1
            while q
            do vLow < getValue(low, -j);
       PL = if (bn > n and
                vLow == lowest(vLow, n) and
                ll)
            then vLow
            else double.NaN;
   def PHBar = if !isNaN(PH)
               then bn
               else PHBar[1];
   def PLBar = if !isNaN(PL)
               then bn
               else PLBar[1];
   def PHL = if !isNaN(PH)
             then PH
             else PHL[1];
   def priorPHBar = if PHL != PHL[1]
                    then PHBar[1]
                    else priorPHBar[1];
   def PLL = if !isNaN(PL)
             then PL
             else PLL[1];
   def priorPLBar = if PLL != PLL[1]
                    then PLBar[1]
                    else priorPLBar[1];
   def HighPivots = bn >= highestAll(priorPHBar);
   def LowPivots = bn >= highestAll(priorPLBar);
   def FirstRpoint = if HighPivots
                     then bn - PHBar
                     else 0;
   def PriorRpoint = if HighPivots
                     then bn - PriorPHBar
                     else 0;
   def RSlope = (getvalue(PH, FirstRpoint) - getvalue(PH, PriorRpoint))
                       / (PHBar - PriorPHBar);
   def FirstSpoint = if LowPivots
                     then bn - PLBar
                     else 0;
   def PriorSpoint = if LowPivots
                     then bn - PriorPLBar
                     else 0;
   def SSlope = (getvalue(PL, FirstSpoint) - getvalue(PL, PriorSpoint))
                   / (PLBar - PriorPLBar);
   def RExtend = if bn == highestall(PHBar)
                 then 1
                 else RExtend[1];
   def SExtend = if bn == highestall(PLBar)
                 then 1
                 else SExtend[1];

  plot pivotHigh = if HighPivots
                   then PH
                   else double.NaN;
       pivotHigh.SetDefaultColor(GetColor(1));
       pivotHigh.setPaintingStrategy(PaintingStrategy.VALUES_ABOVE);
       pivotHigh.setHiding(!showValues);

  plot pivotHighLine = if PHL > 0 and
                          HighPivots
                       then PHL
                       else double.NaN;
       pivotHighLine.SetPaintingStrategy(PaintingStrategy.DASHES);  # Mobius original was DASHES
       pivotHighLine.setDefaultColor(color.uptick);    #JQ 7.8.2018 added
       pivotHighLine.setHiding(!showLines);

  plot RLine = pivotHigh;
       RLine.enableApproximation();
       RLine.SetDefaultColor(Color.LIGHT_GRAY);
       RLine.SetStyle(Curve.Short_DASH);

# Added code to limit resistance estension line (JQ 03.04.2019)
  def calc_ResistanceExtension = if RExtend
                    then (bn - PHBar) * RSlope + PHL
                    else double.NaN;
  plot line_ResistanceExtension = if bn <= (Currentbar + ExtensionLengthBars)
                                   and calc_ResistanceExtension[1] >=  (lowestall(vLow) * (1-(lowerExtensionPercentLimit/100)))
                                   and calc_ResistanceExtension[1] <= (Highestall(vHigh) * (1 + (upperExtensionPercentLimit/100)))
                               then calc_ResistanceExtension else double.nan;
       line_ResistanceExtension.SetStyle(Curve.Short_DASH);
       line_ResistanceExtension.SetDefaultColor(color.LIGHT_GRAY); #was 7
       line_ResistanceExtension.setLineWeight(1);

# Low Plots
  plot pivotLow = if LowPivots
                  then PL
                  else double.NaN;
       pivotLow.setDefaultColor(GetColor(4));
       pivotLow.setPaintingStrategy(PaintingStrategy.VALUES_BELOW);
       pivotLow.setHiding(!showValues);

  plot pivotLowLine = if PLL > 0 and
                         LowPivots
                      then PLL
                      else double.NaN;
       pivotLowLine.SetPaintingStrategy(PaintingStrategy.DASHES);  # Mobius original was DASHES
       pivotLowLine.setDefaultColor(color.DOWNTICK);#  #  JQ 7.8.2018 added
       pivotLowLine.setHiding(!showLines);

  plot SupportLine = pivotLow;
       SupportLine.enableApproximation();
       SupportLine.SetDefaultColor(color.LIGHT_GRAY);
       SUpportLine.SetStyle(Curve.Short_DASH);

# Added code to limit support estension line (JQ 03.04.2019)
  def calc_SupportExtension = if SExtend
                          then (bn - PLBar) * SSlope + PLL
                          else double.NaN;
  plot line_SupportExtension = if bn <= (Currentbar + ExtensionLengthBars)
                                   and calc_SupportExtension[1] >= (lowestall(vLow) * (1-(lowerExtensionPercentLimit/100)))
                                   and calc_SupportExtension[1] <= (Highestall(vHigh) * (1 + (upperExtensionPercentLimit/100)))
                               then calc_supportExtension else double.nan;
       line_SupportExtension.SetDefaultColor(color.LIGHT_GRAY); #was 7
       line_SupportExtension.SetStyle(Curve.Short_DASH);
       line_SupportExtension.setLineWeight(1);

  plot BarNumbersBelow = bn;
       BarNumbersBelow.SetDefaultColor(GetColor(0));
       BarNumbersBelow.setHiding(!showBarNumbers);
       BarNumbersBelow.SetPaintingStrategy(PaintingStrategy.VALUES_BELOW);

  plot PivotDot = if !isNaN(pivotHigh)
                  then pivotHigh
                  else if !isNaN(pivotLow)
                  then pivotLow
                  else double.NaN;
       pivotDot.SetDefaultColor(GetColor(7));
       pivotDot.SetPaintingStrategy(PaintingStrategy.POINTS);
       pivotDot.SetLineWeight(3);

# End Code

Shareable Link

https://tos.mx/WhZxG6

Video Tutorial

After seeing someone on youtube with "zones" above and below their trendlines in Tradingview I attempted to plot the above code with similar zones to spot trendline liquidity sweeps. Had some issues with getting a consistent zone thickness based on the price of the underlying but this seems to work reasonably well (can adjust T1-T11 if too thick or thin). I tried different formulas with slope calcualations and didn't seem to have desired outcome. Guessing maybe a formula including the fold function (which I'm not sure I fully understand) may do the trick to make zone % consistent, however, this works decent for my use but primarily just trade /NQ. Hope it is helpful and if someone knows how to get a more consistent zone thickness between securities please feel free to adjust/correct the code. Also the top or bottom of the zone only goes to the current candle and is not extended, feel free to correct that as well. Happy trading. Code below:

Ruby:
#ProjectionPivots_v03_JQ
#03.04.2019
#Original Code and Concept by Mobius:
# V01.08.2012 Projection Pivots
# mobius

# Notes:
# 03.04.2019 added linits on extensions
# 03.05.2019 adjusted limits on extensions by adding user input upper and lower extenion percent limits
# 01.26.2024 GoLo added Trendline zones above resistance trendline and below support trendline to reflect a "buffer" to help filter trendline liquidity sweeps. All thanks to original creators and Lux Algo for similar coding in Hypertrend Indicator

#declare Once_Per_Bar;
#Inputs
input n = 4;
input showLines = yes;
input showValues = no;
input showBarNumbers = no;
input ExtensionLengthBars = 20; # added to control length of Entension
input UpperExtensionPercentLimit = 5;
input LowerExtensionPercentLimit = 5;
input DisplayLabel = yes; #JQ 7.8.2018 added
AddLabel (DisplayLabel, "Projection Pivots n:" + n + " " , Color.WHITE); #JQ 7.8.2018 added


# Universal Header _v030429019 _JQ
# code from various sources including Mobius, NoLongerNube and others
# Comment out unnecessary portions to preserve tos memory and enhance speed

# Universal Definitions using Padawan variable naming convention (JQ) v03.04.2019
# iData Definitions
def vHigh = high; # creates the variable vHigh. Use of the variable reduce data calls to tos iData server
# def initHigh = CompoundValue(1, high, high); # creates and initialized variable for High
def vLow = low;
# def initLow = CompoundValue(1, low, low);
def vOpen = open;
# def initOpen = CompoundValue(1, open, open);
def vClose = close;
# def initClose = CompoundValue(1, close, close);
def vVolume = volume;
# def initVolume = CompoundValue(1, volume, volume);
def nan = Double.NaN;
# Bar Time & Date
def bn = BarNumber();
def currentBar = HighestAll(if !IsNaN(vHigh) then bn else nan);
# def Today = GetDay() ==GetLastDay();
# def time = GetTime();
# def GlobeX = GetTime() < RegularTradingStart(GetYYYYMMDD());
# def globeX_v2 = if time crosses below RegularTradingEnd(GetYYYYMMDD()) then bn else GlobeX[1];
# def RTS = RegularTradingStart(GetYYYYMMDD());
# def RTE = RegularTradingEnd(GetYYYYMMDD());
# def RTH = GetTime() > RegularTradingStart(GetYYYYMMDD());
# def RTH_v2 = if time crosses above RegularTradingStart(GetYYYYMMDD()) then bn else RTH[1];

# bars that start and end the sessions #(borrowed from nube)
# def rthStartBar = CompoundValue(1,
# if !IsNaN(vClose)
# && time crosses above RegularTradingStart(GetYYYYMMDD())
# then bn
# else rthStartBar[1], 0);
# def rthEndBar = CompoundValue(1,
# if !IsNaN(vClose)
# && time crosses above RegularTradingEnd(GetYYYYMMDD())
# then bn
# else rthEndBar[1], 1);
# def globexStartBar = CompoundValue(1,
# if !IsNaN(vClose)
# && time crosses below RegularTradingEnd(GetYYYYMMDD())
# then bn
# else globexStartBar[1], 1);
# def rthSession = if bn crosses above rthStartBar #+ barsExtendedBeyondSession
# then 1
# else if bn crosses above rthEndBar #+ barsExtendedBeyondSession
# then 0
# else rthSession[1];

# Bubble Locations
def x_AxisLastExpansionBar = BarNumber() == HighestAll(BarNumber()); #corrected 11.12.2018 (JQ)
# syntax: addChartBubble(x_AxisLastExpansionBar, y-axis coordinate," text", Color.LIME); #verified 12.25.2018 (JQ)

def PH;
def PL;
def hh = fold i = 1 to n + 1
with p = 1
while p
do vHigh > GetValue(vHigh, -i);
PH = if (bn > n and
vHigh == Highest(vHigh, n) and
hh)
then vHigh
else Double.NaN;
def ll = fold j = 1 to n + 1
with q = 1
while q
do vLow < GetValue(low, -j);
PL = if (bn > n and
vLow == Lowest(vLow, n) and
ll)
then vLow
else Double.NaN;
def PHBar = if !IsNaN(PH)
then bn
else PHBar[1];
def PLBar = if !IsNaN(PL)
then bn
else PLBar[1];
def PHL = if !IsNaN(PH)
then PH
else PHL[1];
def priorPHBar = if PHL != PHL[1]
then PHBar[1]
else priorPHBar[1];
def PLL = if !IsNaN(PL)
then PL
else PLL[1];
def priorPLBar = if PLL != PLL[1]
then PLBar[1]
else priorPLBar[1];
def HighPivots = bn >= HighestAll(priorPHBar);
def LowPivots = bn >= HighestAll(priorPLBar);
def FirstRpoint = if HighPivots
then bn - PHBar
else 0;
def PriorRpoint = if HighPivots
then bn - priorPHBar
else 0;
def RSlope = (GetValue(PH, FirstRpoint) - GetValue(PH, PriorRpoint))
/ (PHBar - priorPHBar);
def FirstSpoint = if LowPivots
then bn - PLBar
else 0;
def PriorSpoint = if LowPivots
then bn - priorPLBar
else 0;
def SSlope = (GetValue(PL, FirstSpoint) - GetValue(PL, PriorSpoint))
/ (PLBar - priorPLBar);
def RExtend = if bn == HighestAll(PHBar)
then 1
else RExtend[1];
def SExtend = if bn == HighestAll(PLBar)
then 1
else SExtend[1];

plot pivotHigh = if HighPivots
then PH
else Double.NaN;
pivotHigh.SetDefaultColor(GetColor(1));
pivotHigh.SetPaintingStrategy(PaintingStrategy.VALUES_ABOVE);
pivotHigh.SetHiding(!showValues);

plot pivotHighLine = if PHL > 0 and
HighPivots
then PHL
else Double.NaN;
pivotHighLine.SetPaintingStrategy(PaintingStrategy.DASHES); # Mobius original was DASHES
pivotHighLine.SetDefaultColor(Color.UPTICK); #JQ 7.8.2018 added
pivotHighLine.SetHiding(!showLines);

plot RLine = pivotHigh;
RLine.EnableApproximation();
RLine.SetDefaultColor(Color.red);
RLine.SetStyle(Curve.firm);

# Added code to limit resistance estension line (JQ 03.04.2019)
def calc_ResistanceExtension = if RExtend
then (bn - PHBar) * RSlope + PHL
else Double.NaN;
plot line_ResistanceExtension = if bn <= (currentBar + ExtensionLengthBars)
and calc_ResistanceExtension[1] >= (LowestAll(vLow) * (1 - (LowerExtensionPercentLimit / 100)))
and calc_ResistanceExtension[1] <= (HighestAll(vHigh) * (1 + (UpperExtensionPercentLimit / 100)))
then calc_ResistanceExtension else Double.NaN;
line_ResistanceExtension.SetStyle(Curve.SHORT_DASH);
line_ResistanceExtension.SetDefaultColor(Color.red); #was 7
line_ResistanceExtension.SetLineWeight(1);

# Low Plots
plot pivotLow = if LowPivots
then PL
else Double.NaN;
pivotLow.SetDefaultColor(GetColor(4));
pivotLow.SetPaintingStrategy(PaintingStrategy.VALUES_BELOW);
pivotLow.SetHiding(!showValues);

plot pivotLowLine = if PLL > 0 and
LowPivots
then PLL
else Double.NaN;
pivotLowLine.SetPaintingStrategy(PaintingStrategy.DASHES); # Mobius original was DASHES
pivotLowLine.SetDefaultColor(Color.DOWNTICK);# # JQ 7.8.2018 added
pivotLowLine.SetHiding(!showLines);

plot SupportLine = pivotLow;
SupportLine.EnableApproximation();
SupportLine.SetDefaultColor(Color.green);
SupportLine.SetStyle(Curve.firm);

# Added code to limit support estension line (JQ 03.04.2019)
def calc_SupportExtension = if SExtend
then (bn - PLBar) * SSlope + PLL
else Double.NaN;
plot line_SupportExtension = if bn <= (currentBar + ExtensionLengthBars)
and calc_SupportExtension[1] >= (LowestAll(vLow) * (1 - (LowerExtensionPercentLimit / 100)))
and calc_SupportExtension[1] <= (HighestAll(vHigh) * (1 + (UpperExtensionPercentLimit / 100)))
then calc_SupportExtension else Double.NaN;
line_SupportExtension.SetDefaultColor(Color.green); #was 7
line_SupportExtension.SetStyle(Curve.SHORT_DASH);
line_SupportExtension.SetLineWeight(1);

plot BarNumbersBelow = bn;
BarNumbersBelow.SetDefaultColor(GetColor(0));
BarNumbersBelow.SetHiding(!showBarNumbers);
BarNumbersBelow.SetPaintingStrategy(PaintingStrategy.VALUES_BELOW);

plot PivotDot = if !IsNaN(pivotHigh)
then pivotHigh
else if !IsNaN(pivotLow)
then pivotLow
else Double.NaN;
PivotDot.SetDefaultColor(GetColor(7));
PivotDot.SetPaintingStrategy(PaintingStrategy.POINTS);
PivotDot.SetLineWeight(3);

# End Code

#===================================== Plot Trendline Zones ======================================


DefineGlobalColor("ResistanceBand", color.pink);
DefineGlobalColor("SupportBand", color.light_GREEN);

input t1=1.0;
input t2 = 2.0;
input t3 = 2.0;
input t4 = 2.0;
input t5 = 2.0;
input t6 = 4;
input t7 = 5;
input t8 = 6;
input t9 = 8;
input t10 = 15;
input t11 = 25;


input showTrendZone= yes;
input showTrendZoneCloud = yes;
#input width = 4; # 'Width %'
def widthPercentage = if close > 0 and close < 10 then t1
else if close >= 10 and close < 20 then t2
else if close >= 20 and close < 50 then t3
else if close >= 50 and close < 100 then t4
else if close >= 100 and close < 200 then t5
else if close >= 200 and close < 300 then t6
else if close >= 300 and close < 500 then t7
else if close >= 500 and close < 750 then t8
else if close >= 750 and close < 1500 then t9
else if close >= 1500 and close < 5000 then t10
else if close >= 5000 and close < 30000 then t11
else 4 ; # 'Width %'

def Resistwidth = widthPercentage / 100;
def Supportwidth = widthPercentage / 100;

# ================================= Resistance Zones ===============================

# **************************************** Resistance Line Upper Zone

def upper = if HighPivots
then PH + Resistwidth
else Double.NaN;

plot upper_ = if showTrendZone then upper else Double.NaN ;
upper_.EnableApproximation();
upper_.SetDefaultColor(Color.RED);
upper_.SetStyle(Curve.firm);

# **************************************** Resistance Line Extension Zone

def upperext = if RExtend
then ((bn - PHBar) * RSlope + PHL) + Resistwidth
else Double.NaN;

plot upper_ext = if showTrendZone then upperext else Double.NaN ;
upper_ext.EnableApproximation();
upper_ext.SetDefaultColor(Color.RED);
upper_ext.SetStyle(Curve.SHORT_DASH);

# ================================= Support Zones ===============================

# **************************************** Support Line Lower Zone

def lower = if LowPivots
then PL - Supportwidth
else Double.NaN;


plot lower_ = if showTrendZone then lower else Double.NaN ;
lower_.EnableApproximation();
lower_.SetDefaultColor(Color.green);
lower_.SetStyle(Curve.short_DASH);

# **************************************** Support Line Extension Zone

def lowerext = if SExtend
then ((bn - PLBar) * SSlope + PLL) - Supportwidth
else Double.NaN;

plot lower_ext = if showTrendZone then lowerext else Double.NaN ;
#plot upper_ext = upperext ;
lower_ext.EnableApproximation();
lower_ext.SetDefaultColor(Color.green);
lower_ext.SetStyle(Curve.SHORT_DASH);

# ---------------------------------------- Add Cloud -----------------------------------------

AddCloud(if ShowTrendZoneCloud then upper_ext else Double.NaN, line_ResistanceExtension, GlobalColor("ResistanceBand"), GlobalColor("ResistanceBand"));

AddCloud(if ShowTrendZoneCloud then lower_ext else Double.NaN, line_SupportExtension, GlobalColor("SupportBand"), GlobalColor("SupportBand"));
 

Attachments

  • Trendline Zones.PNG
    Trendline Zones.PNG
    45.8 KB · Views: 414
Last edited by a moderator:
@soary Sorry. Must have been in my studies so long I thought it was standard to ToS. Here it is. Adjust the n value to your needs.

Code:
# Pivot_Array (***Please copy and paste this name to study name above***)
# Mobius
# V01.09.13.2017
#hint: Plots the most recent 4 resistance pivots and support pivots. \n For scanning: Find the study in list of studies then select either BearScan or BullScan as the left side entry in the Scan Wizard and equal to as the center definition and close price as the right side entry.

# User Inputs
input n = 3; #hint n: periods used for pivot calculations.

# Internal Script Reference
script LinePlot {
    input BarID = 0;
    input Value = 0;
    input BarOrigin = 0;
    def ThisBar = HighestAll(BarOrigin);
    def ValueLine = if BarOrigin == ThisBar
                then Value
                else Double.NaN;
    plot P = if ThisBar - BarID <= BarOrigin
             then HighestAll(ValueLine)
             else Double.NaN;
}
# Variables
def o = open;
def h = high;
def l = low;
def c = close;
def bar = BarNumber();
def BBar = bar == HighestAll(bar);
# Parent High
def ParentHigh = HighestAll(h);
def ParentHBarOrigin = if h == ParentHigh
                       then bar
                       else ParentHBarOrigin[1];
def ParentHBarID = bar - HighestAll(ParentHBarOrigin);
# R1
def hh = fold i = 1 to n + 1
         with p = 1
         while p
         do h > GetValue(h, -i);
def PivotH = if (bar > n and
                 h == Highest(h, n) and
                 hh)
            then h
            else Double.NaN;
def PHValue = if !IsNaN(PivotH)
              then PivotH
              else PHValue[1];
def PHBarOrigin = if !IsNaN(PivotH)
                  then bar
                  else PHBarOrigin[1];
def PHBarID = bar - PHBarOrigin;
# R2
def R2PHValue = if PHBarOrigin != PHBarOrigin[1]
              then PHValue[1]
              else R2PHValue[1];
def R2PHBarOrigin = if PHBarOrigin != PHBarOrigin[1]
                  then PHBarOrigin[1]
                  else R2PHBarOrigin[1];
def R2PHBarID = bar - R2PHBarOrigin;
# R3
def R3PHValue = if R2PHBarOrigin != R2PHBarOrigin[1]
              then R2PHValue[1]
              else R3PHValue[1];
def R3PHBarOrigin = if R2PHBarOrigin != R2PHBarOrigin[1]
                  then R2PHBarOrigin[1]
                  else R3PHBarOrigin[1];
def R3PHBarID = bar - R3PHBarOrigin;
# R4
def R4PHValue = if R3PHBarOrigin != R3PHBarOrigin[1]
              then R3PHValue[1]
              else R4PHValue[1];
def R4PHBarOrigin = if R3PHBarOrigin != R3PHBarOrigin[1]
                  then R3PHBarOrigin[1]
                  else R4PHBarOrigin[1];
def R4PHBarID = bar - R4PHBarOrigin;

# Parent Low
def ParentLow = LowestAll(l);
def ParentLBarOrigin = if l == ParentLow
                       then bar
                       else ParentLBarOrigin[1];
def ParentLBarID = bar - HighestAll(ParentLBarOrigin);
# S1
def ll = fold j = 1 to n + 1
         with q = 1
         while q
         do l < GetValue(l, -j);
def PivotL = if (bar > n and
                 l == Lowest(l, n) and
                 ll)
             then l
             else Double.NaN;
def PLValue = if !IsNaN(PivotL)
              then PivotL
              else PLValue[1];
def PLBarOrigin = if !IsNaN(PivotL)
                  then bar
                  else PLBarOrigin[1];
def PLBarID = bar - PLBarOrigin;
# S2
def S2PLValue = if PLBarOrigin != PLBarOrigin[1]
              then PLValue[1]
              else S2PLValue[1];
def S2PLBarOrigin = if PLBarOrigin != PLBarOrigin[1]
                  then PLBarOrigin[1]
                  else S2PLBarOrigin[1];
def S2PLBarID = bar - S2PLBarOrigin;
# S3
def S3PLValue = if S2PLBarOrigin != S2PLBarOrigin[1]
              then S2PLValue[1]
              else S3PLValue[1];
def S3PLBarOrigin = if S2PLBarOrigin != S2PLBarOrigin[1]
                  then S2PLBarOrigin[1]
                  else S3PLBarOrigin[1];
def S3PLBarID = bar - S3PLBarOrigin;
# S4
def S4PLValue = if S3PLBarOrigin != S3PLBarOrigin[1]
              then S3PLValue[1]
              else S4PLValue[1];
def S4PLBarOrigin = if S3PLBarOrigin != S3PLBarOrigin[1]
                  then S3PLBarOrigin[1]
                  else S4PLBarOrigin[1];
def S4PLBarID = bar - S4PLBarOrigin;

# Plots
plot PR1 = LinePlot(BarID = ParentHBarID,
                    Value = ParentHigh,
                    BarOrigin = HighestAll(ParentHBarOrigin));
     PR1.SetDefaultColor(Color.GREEN);
#addChartBubble(Bar == HighestAll(ParentHBarOrigin), ParentHigh, "High", color.yellow, 1);
plot R1 = LinePlot(BarID = PHBarID,
                   Value = PHValue,
                   BarOrigin = PHBarOrigin);
     R1.SetDefaultColor(Color.GREEN);
addChartBubble(Bar == HighestAll(PHBarOrigin), PHvalue, "R1", color.green, 1);
plot R2 = LinePlot(BarID = R2PHBarID,
                   Value = R2PHValue,
                   BarOrigin = R2PHBarOrigin);
     R2.SetDefaultColor(Color.GREEN);
addChartBubble(Bar == HighestAll(R2PHBarOrigin), PHvalue, "R2", color.green, 1);
plot R3 = LinePlot(BarID = R3PHBarID,
                   Value = R3PHValue,
                   BarOrigin = R3PHBarOrigin);
     R3.SetDefaultColor(Color.GREEN);
addChartBubble(Bar == HighestAll(R3PHBarOrigin), PHvalue, "R3", color.green, 1);
plot R4 = LinePlot(BarID = R4PHBarID,
                   Value = R4PHValue,
                   BarOrigin = R4PHBarOrigin);
     R4.SetDefaultColor(Color.GREEN);
addChartBubble(Bar == HighestAll(R4PHBarOrigin), PHvalue, "R4", color.green, 1);

plot PS1 = LinePlot(BarID = ParentLBarID,
                   Value = ParentLow,
                   BarOrigin = HighestAll(ParentLBarOrigin));
     PS1.SetDefaultColor(Color.RED);
AddChartBubble(Bar == HighestAll(ParentLBarOrigin), ParentLow, "Low", Color.Yellow, 0);
plot S1 = LinePlot(BarID = PLBarID,
                   Value = PLValue,
                   BarOrigin = PLBarOrigin);
     S1.SetDefaultColor(Color.RED);
addChartBubble(Bar == HighestAll(PLBarOrigin), PLvalue, "S1", color.red, 0);
plot S2 = LinePlot(BarID = S2PLBarID,
                   Value = S2PLValue,
                   BarOrigin = S2PLBarOrigin);
     S2.SetDefaultColor(Color.RED);
addChartBubble(Bar == HighestAll(S2PLBarOrigin), PLvalue, "S2", color.red, 0);
plot S3 = LinePlot(BarID = S3PLBarID,
                   Value = S3PLValue,
                   BarOrigin = S3PLBarOrigin);
     S3.SetDefaultColor(Color.RED);
addChartBubble(Bar == HighestAll(S3PLBarOrigin), PLvalue, "S3", color.red, 0);
plot S4 = LinePlot(BarID = S4PLBarID,
                   Value = S4PLValue,
                   BarOrigin = S4PLBarOrigin);
     S4.SetDefaultColor(Color.RED);
addChartBubble(Bar == HighestAll(S4PLBarOrigin), PLvalue, "S4", color.red, 0);
# Signals
def UpSignal;
def DnSignal;
if close crosses above R4
{
    UpSignal = low;
}
else if close crosses above R3
{
    UpSignal = low;
}
else if close crosses above R2
{
    UpSignal = low;
}
else if close crosses above R1
{
    UpSignal = low;
}
else
{
    UpSignal = UpSignal[1];
}
plot UpArrows = if low == UpSignal
                then low
                else double.nan;
     UpArrows.SetPaintingStrategy(PaintingStrategy.Arrow_UP);
     UpArrows.SetDefaultColor(Color.CYAN);
if close crosses below S1
{
    DnSignal = high;
}
else if close crosses below S2
{
    DnSignal = high;
}
else if close crosses below S3
{
    DnSignal = high;
}
else if close crosses below S4
{
    DnSignal = high;
}
else
{
    DnSignal = DnSignal[1];
}
plot DnArrow = if high == DnSignal
               then high
               else double.nan;
DnArrow.SetPaintingStrategy(PaintingStrategy.Arrow_DOWN);
DnArrow.SetDefaultColor(Color.YELLOW);
plot BearScan = if (close crosses below S1) OR
                   (close crosses below S2)
                then close
                else double.nan;
plot BullScan = if (close crosses above R1) OR
                   (close crosses above R2)
                then close
                else double.nan;
# End Code Fractal Array
Is it possible to add a auto trendline from "R4" to "R1" with right extension. And the same with "S4" to "S1"?
 

Similar threads

Not the exact question you're looking for?

Start a new thread and receive assistance from our community.

87k+ Posts
159 Online
Create Post

Similar threads

Similar threads

The Market Trading Game Changer

Join 2,500+ subscribers inside the useThinkScript VIP Membership Club
  • Exclusive indicators
  • Proven strategies & setups
  • Private Discord community
  • ‘Buy The Dip’ signal alerts
  • Exclusive members-only content
  • Add-ons and resources
  • 1 full year of unlimited support

Frequently Asked Questions

What is useThinkScript?

useThinkScript is the #1 community of stock market investors using indicators and other tools to power their trading strategies. Traders of all skill levels use our forums to learn about scripting and indicators, help each other, and discover new ways to gain an edge in the markets.

How do I get started?

We get it. Our forum can be intimidating, if not overwhelming. With thousands of topics, tens of thousands of posts, our community has created an incredibly deep knowledge base for stock traders. No one can ever exhaust every resource provided on our site.

If you are new, or just looking for guidance, here are some helpful links to get you started.

What are the benefits of VIP Membership?
VIP members get exclusive access to these proven and tested premium indicators: Buy the Dip, Advanced Market Moves 2.0, Take Profit, and Volatility Trading Range. In addition, VIP members get access to over 50 VIP-only custom indicators, add-ons, and strategies, private VIP-only forums, private Discord channel to discuss trades and strategies in real-time, customer support, trade alerts, and much more. Learn all about VIP membership here.
How can I access the premium indicators?
To access the premium indicators, which are plug and play ready, sign up for VIP membership here.
Back
Top