Volume Stats Format, Watchlist, Scan, Label for ThinkOrSwim

@Idan With out a separate Volume sub-graph, there isn't much you can do. Having said that you could have some space between Volume and price graphs. You could go to settings, wheel icon on top of your charts, and select price access, set Expansion Area, "% Down" to as much as 30. This should make it look cleaner.

for your 2nd question, it already looks like you have color coded bars for your volume graphs, if you are looking for Buy Vs Sell Labels color coded. Pick the latest code posted or a you can add a separate study for that, you can find the code for that few comments about, I have posted code for the same.

Look here for separate study. https://usethinkscript.com/threads/custom-thinkscript-volume-stats-for-thinkorswim.970/post-29090
 

Join useThinkScript to post your question to a community of 21,000+ developers and traders.

@SuryaKiranC Ditto @Eli sentiment. We have so much to learn! o_O

For the Newbies trying to learn the script, can we get a brief/short 1.4 version clarification on each of the labels displayed?
The script I posted on pp3 didn't have BUY: #(n%) nor SELL labels so I'm confused what that indication is for (the current bar?)?
It is 11p now and those labels are not on so I'm probably early with the question might find out in the morning.
On pp3 I mentioned using first hour 930-1030 cumulative volume in comparison to avg 30 days 930-1030 cumulative volume hoping to see some kind of volume forecast correlation.
Have you encounter this strategy as a indication before?
The new script is so much more sophisticated.
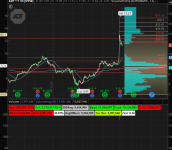
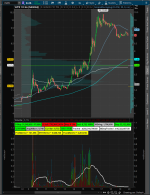
Below is how it looks for ADT.

ALOsRA5.png
5s6TkH8.png

khl1FGx.png
 

Attachments

  • ALOsRA5.png
    ALOsRA5.png
    69.9 KB · Views: 564
@jngy2k Here is the breakdown.

First Off all Buy/Sell Volume used to be a separate script with colored histogram on volume bars, I have added it to this one on request.
  • W/D Buy/Sell Volume Higher timeframe volumes, if you are on mins charts automatically shows Current days Buys/Sell Volumes and percentage. if you are on 1D charts shows 1W Buy/Sell Volumes and percentage. you need to enable this by setting "yes" for "show higher vol stats" ## Note Available from version 1.5.1 from next page only.
  • Buy/Sell volume always shows the % of Buy vs Sell on the current candle in any given timeframe. When the ticker is done trading they are not displaying any info, except for higher timeframes, 1D and above.
  • 30DAvg, This is self explained. Just incase 30 Days is what the script default and this is changeable, at script properties, no need to edit code. Incase, if somebody prefers a different length.
  • Day: is todays Volume, during the day along with Pre/Post market hours this will keep showing the day volume. And is "RED" till it cross 30D Avg, "LIME" on cross, "GREEN" on 150% of 30D Avg volume.
  • Day-1 - Day-4 are "Day minus 1" to "Day minus 4", basically last 4 days in the order the candles would appear on 1D charts, and are visible by default on 1D charts, Ex: 1Y 1D, 180 1D, or any other 1D time frames you may have configured, These are disabled by default on Lower Timeframes, but can be enabled as script properties if somebody prefers to see them on lower time frame charts, Ex: 1m, 5m, 15m or 1H.
  • Unlabeled White box next to "Day" is volume in % for someone who prefers, and is compared with 30D Avg, or defined Avg if someone has a custom length.
  • 30BarAvg, is again self explained, basically 30Bars on your timeframe, it is redundant when you are on a 1D chart. unless you have. As of now both Avg Days and number of Bars use the same input variable in script called "length" hence, if you change the property of the script and define length to 45 or 60, the AvgBar count would change too.
  • Both DayAvg and BarAvg labels are dynamic and represent the input value for "length". Should anybody were to change the length property it will display appropriate value in the label.
  • CurBar, is literally what it says, volume on current bar on your chart timeframe.
  • rVol, is Relative Volume basically used by some traders to gaze the % of volume in comparison to previous trading session. it's round value of (DayVol / 30Day Avg)
  • PreMktVol, is Pre-Market Volume of the day, starting at 4:00 AM EST.
  • RTH1HrVol, is Real Trade Hours 1st hour Volume.
  • PostMktVol, is after 4:00 PM EST Volume, till extended hours of trading is closed.
  • Pre/RTH1Hr/PostVol(s) are displayed only on lower timeframe charts, Ex: 1m, 5m, 15m, 1H or 4H.
Hope that helps. Following is are the list of improvement, I want to do, at sometime.
  • Want to be able to identify futures tickers and have a different time period definitions for Pre/Post Volume calculations as they trade differently.
  • Want to be able to compare the volume against the previous days same time frame of same time period of the previous day, to be able to make trade judgements. Ex: AAPL, 9:30AM - 11:30 AM is 20% volume of previous session, and today same time period is more 30%, We could anticipate it's possibly a hight volume day.
Let me know if you think I skipped any details.

**Note : Additional details added for newer version here instead of repeating this post.
 
Last edited:
@natcom2020 not sure, Why I don't see your updates on the thread, but saw your response with screenshot in email. You are trying to create it as a strategy.

Please create it as a study not as a strategy.
 
@natcom2020 BTW, if you are upto it. test with the new code. None of the old functionality is removed, other than few additions. Version 1.5 in this page. Let me know if you have any feedback.
 
@liightz Can you try the code posted here in Page 5, version 1.5 should have the 30DayAVG line plotted for you on 1Y 1D Charts, and 30Bar average on smaller timeframes. Let me know if this is what you are looking for.
 
@OptionsTrader Updated the code, basically a bit of clean up. If you have grabbed the code earlier, please refresh your code again from the above comment and give it a short.

I'm having a little trouble making sense of it, could you elaborate on how to read the DevDecrease and increase? is it a calculation of a deviation from the current volume or does it factor in the average of the last 30 days?
 
@OptionsTrader look at the following piece of code, it uses 60 Bars, depends on the timeframe you are they can be 60 min or 60 days.

Code:
############### Buying and Selling Volume Study
#DPL CRITERIA #
###############
input Audible_Alert = yes;
def Deviation_Length = 60;
def Deviate = 2;
def volumestdev = RelativeVolumeStDev(length = Deviation_Length);
def abovedev = volumestdev >= Deviate;
def belowdev = volumestdev <= Deviate;
 
Hello, I am wondering if there's any way to include an intraday time element in the volume stats? I am a new coder and struggling to find a solution, any help would be appreciated.

Below is what I currently run, values used as an example:

Daily Avg(30 days): 10,000,000 | Today: 3,000,000 | 33%

The above does not factor in time, I would like to know the volume relative to the time period.

Below would be an example:

10:30am
Daily Avg at Time(30 days): 2,500,000 | Today: 5,000,000 | 200%

The above shows that at the current time of 10:30am, the volume is 200% above the 30 day average for that time period. With the relative volume updating every 5 minutes or so.

10:35am
Daily Avg at Time(30 days): 2,600,000 | Today: 5,500,000 | 211%

Thank you.
 
@nfxDEV That's next on my list. should be possible but need to figure our few things to keep code clean. if you want to collaborate. Let me know.

Read my description comment few pages back, how to interpret the indicator labels. I have what's next there.
 
@nfxDEV That's next on my list. should be possible but need to figure our few things to keep code clean. if you want to collaborate. Let me know.

Read my description comment few pages back, how to interpret the indicator labels. I have what's next there.

I'd definitely be up for collaborating, if you have Discord add me there. nfxDEV#3000
 
Minor changes, Higher time frame label can now show the frame configured.


Code:
# Volume Labels
# Version 1.5.1
# Created: 06/23/20 # Modified on 08/26/20

# Modified by: Surya Kiran C ## Included rVolume label and Changed length as input. ## Additionally Pre-Market, 1Hr Volume, AfterHour, 5 Day Volume labels are added.

# Version 1.5 Changes
# Change 1) Higher Time Frame Buying Vs Selling, Please make sure to configure VolPeriod higher than typical chart frame used.
# Change 2) Added 30Day Average White Line to VolumeBar, for 1Y 1D, and a 30BarAvg line for lower timeframes, Just to indicate if the current bar is above or below Average line.
# Version 1.5.1 Changes.
# Minor, Higher timeframe has labels indicating the timeframe.

declare on_volume; # Declared on_volume, if you need to use only labels as a top study comment # Selling Volume # & # Buying Volume # along with this line.

input length = 30;
input ShowDayAvg = yes;
input ShowTodayVolume = yes;
input PreviousDayVolume = no;
input ShowPercentOfDayAvg = yes;
input UnusualVolumePercent = 200;
input ShowBarAvg = yes;
input ShowCurrentBar = yes;
input ShowrVol = yes;
input ShowDollarTraded = yes;
input ShowDaysDollarTraded = yes;
input VolStatsPeriod = AggregationPeriod.DAY;

input PreMktVol = yes;
input RTH1HrVol = yes;
input PostMktVol = yes;

def VolDayAvg = Average(volume(period = "DAY")[1], length);
def AvgBars = Average(volume[1], length);

def Vol1 = volume(period = "DAY")[1];
def Vol2 = volume(period = "DAY")[2];
def Vol3 = volume(period = "DAY")[3];
def Vol4 = volume(period = "DAY")[4];
def Vol5 = volume(period = "DAY")[5];

def VolDayAvg1 = VolDayAvg[1];
def VolDayAvg2 = VolDayAvg[2];
def VolDayAvg3 = VolDayAvg[3];
def VolDayAvg4 = VolDayAvg[4];

def Vol = volume(period = "DAY");
def CurVol = volume;

def DollarVolume = hl2 * Vol;
def AvgHL2 = Average(hl2[1], length);
def DaysDollarvol = VolDayAvg * AvgHL2;

def rVol = Vol / VolDayAvg;
def PercentOfDayAvg = Round((rVol * 100), 2);

############### Buying and Selling Volume Study
#DPL CRITERIA #
###############
input Audible_Alert = yes;
def Deviation_Length = 60;
def Deviate = 2;
def volumestdev = RelativeVolumeStDev(length = Deviation_Length);
def abovedev = volumestdev >= Deviate;
def belowdev = volumestdev <= Deviate;

############
# DPL BARS #
############
def increase = volume > volume[1];
def devincrease = increase and abovedev;
def decrease = volume < volume[1];
def devdecrease = decrease and abovedev;

##############################
# UPTICK / DOWNTICK CRITERIA #
##############################
def O = open;
def H = high;
def C = close;
def L = low;
def V = volume;
def Buying = V * (C - L) / (H - L);
def Selling = V * (H - C) / (H - L);

###############################################
# For Higher Frame UPTICK / DOWNTICK CRITERIA #
###############################################
def HO = open(period = VolStatsPeriod);
def HH = high(period = VolStatsPeriod);
def HC = close(period = VolStatsPeriod);
def HL = low(period = VolStatsPeriod);
def HV = volume(period = VolStatsPeriod);
def HBuying = HV * (HC - HL) / (HH - HL);
def HSelling = HV * (HH - HC) / (HH - HL);

##################
# Selling Volume #
##################
plot SV = Selling;
SV.DefineColor("Decrease", Color.DARK_RED);
SV.DefineColor("DevDecrease", Color.LIGHT_RED);
SV.AssignValueColor(if devdecrease then SV.Color("DevDecrease") else SV.Color("Decrease"));
SV.SetPaintingStrategy(PaintingStrategy.HISTOGRAM);
SV.HideTitle();
SV.HideBubble();
SV.SetLineWeight(5);

#################
# Buying Volume #
#################
plot BV = Buying;
BV.DefineColor("Increase", Color.DARK_GREEN);
BV.DefineColor("DevIncrease", Color.GREEN);
BV.AssignValueColor(if devincrease then BV.Color("DevIncrease") else BV.Color("Increase"));
BV.SetPaintingStrategy(PaintingStrategy.HISTOGRAM);
BV.HideTitle();
BV.HideBubble();
BV.SetLineWeight(5);

#################
#  Volume %     #
#################
def totVol = Round(Buying, 0) + Round(Selling, 0) ;
def buyPercent  = ( Round(Buying, 0)  / totVol ) * 100;
def sellPercent = ( Round(Selling, 0) / totVol ) * 100;

#################
#  Volume %     #
#################
def HtotVol = Round(HBuying, 0) + Round(HSelling, 0) ;
def HbuyPercent  = ( Round(HBuying, 0)  / HtotVol ) * 100;
def HsellPercent = ( Round(HSelling, 0) / HtotVol ) * 100;

########################
# Adding Volume Labels #
########################

#Higher Time Frame Buying & Selling Volumes#

input ShowHigherVolStats = no;

AddLabel(if GetAggregationPeriod() >= VolStatsPeriod then 0 else if ShowHigherVolStats then 1 else 1, (if VolStatsPeriod == AggregationPeriod.MONTH then "M" else if VolStatsPeriod == AggregationPeriod.WEEK then "W" else if VolStatsPeriod == AggregationPeriod.FOUR_DAYS then "4D" else if VolStatsPeriod == AggregationPeriod.THREE_DAYS then "3D" else if VolStatsPeriod == AggregationPeriod.TWO_DAYS then "2D" else if VolStatsPeriod  == AggregationPeriod.DAY then "D" else if VolStatsPeriod == AggregationPeriod.FOUR_HOURS then "4H" else if VolStatsPeriod == AggregationPeriod.TWO_HOURS then "2H" else if VolStatsPeriod == AggregationPeriod.HOUR then "60m"else if VolStatsPeriod == AggregationPeriod.THIRTY_MIN then "30m" else if VolStatsPeriod == AggregationPeriod.TWENTY_MIN then "20m" else if VolStatsPeriod  == AggregationPeriod.FIFTEEN_MIN then "15m" else if VolStatsPeriod == AggregationPeriod.TEN_MIN then "10m" else if VolStatsPeriod == AggregationPeriod.FIVE_MIN then "5m" else if VolStatsPeriod == AggregationPeriod.FOUR_MIN then "4m" else if VolStatsPeriod  == AggregationPeriod.THREE_MIN then "3m" else if VolStatsPeriod == AggregationPeriod.TWO_MIN then "2m" else if VolStatsPeriod  == AggregationPeriod.MIN then "1m" else "")+ " Buy: " + Round(HBuying, 0) + "  " + Round(HbuyPercent, 2) + "% ", (if HBuying > HSelling then Color.GREEN else Color.RED)) ;
AddLabel(if GetAggregationPeriod() >= VolStatsPeriod then 0 else if ShowHigherVolStats then 1 else 1, (if VolStatsPeriod == AggregationPeriod.MONTH then "M" else if VolStatsPeriod == AggregationPeriod.WEEK then "W" else if VolStatsPeriod == AggregationPeriod.FOUR_DAYS then "4D" else if VolStatsPeriod == AggregationPeriod.THREE_DAYS then "3D" else if VolStatsPeriod == AggregationPeriod.TWO_DAYS then "2D" else if VolStatsPeriod  == AggregationPeriod.DAY then "D" else if VolStatsPeriod == AggregationPeriod.FOUR_HOURS then "4H" else if VolStatsPeriod == AggregationPeriod.TWO_HOURS then "2H" else if VolStatsPeriod == AggregationPeriod.HOUR then "60m"else if VolStatsPeriod == AggregationPeriod.THIRTY_MIN then "30m" else if VolStatsPeriod == AggregationPeriod.TWENTY_MIN then "20m" else if VolStatsPeriod  == AggregationPeriod.FIFTEEN_MIN then "15m" else if VolStatsPeriod == AggregationPeriod.TEN_MIN then "10m" else if VolStatsPeriod == AggregationPeriod.FIVE_MIN then "5m" else if VolStatsPeriod == AggregationPeriod.FOUR_MIN then "4m" else if VolStatsPeriod  == AggregationPeriod.THREE_MIN then "3m" else if VolStatsPeriod == AggregationPeriod.TWO_MIN then "2m" else if VolStatsPeriod  == AggregationPeriod.MIN then "1m" else "")+ " Sell: " + Round(HSelling, 0) + " " + Round(HsellPercent, 2) + "% ", (if HSelling > HBuying then Color.GREEN else Color.RED)) ;

#Chart Time Frame Buying & Selling Volumes#

input Show_Labels = yes;

AddLabel(Show_Labels, "Buy: " + Round(Buying, 0) + "  " + Round(buyPercent, 2) + "% ", if Buying > Selling then Color.GREEN else Color.RED);
AddLabel(Show_Labels, "Sell: " + Round(Selling, 0) + " " + Round(sellPercent, 2) + "% ", if Selling > Buying then Color.GREEN else Color.RED);

######################## End of Buying & Selling Labels Study
AddLabel(ShowDayAvg, length + "DAvg: " + Round(VolDayAvg, 0) + "  ", Color.LIGHT_GRAY);
AddLabel(if GetAggregationPeriod() >= AggregationPeriod.DAY then 1 else if PreviousDayVolume then 1 else 0, "Day4: " + Vol4 + " ", (if Vol4 >= VolDayAvg4 and Vol5 then Color.GREEN else if Vol4 >= Vol5 then Color.LIME else Color.RED));
AddLabel(if GetAggregationPeriod() >= AggregationPeriod.DAY then 1 else if PreviousDayVolume then 1 else 0, "Day3: " + Vol3 + " ", (if Vol3 >= VolDayAvg3 and Vol4 then Color.GREEN else if Vol3 >= Vol4 then Color.LIME else Color.RED));
AddLabel(if GetAggregationPeriod() >= AggregationPeriod.DAY then 1 else if PreviousDayVolume then 1 else 0, "Day2: " + Vol2 + " ", (if Vol2 >= VolDayAvg2 and Vol3 then Color.GREEN else if Vol2 >= Vol3 then Color.LIME else Color.RED));
AddLabel(if GetAggregationPeriod() >= AggregationPeriod.DAY then 1 else if PreviousDayVolume then 1 else 0, "Day1: " + Vol1 + " ", (if Vol1 >= VolDayAvg1 and Vol2 then Color.GREEN else if Vol1 >= Vol2 then Color.LIME else Color.RED));
AddLabel(ShowTodayVolume,  "Day: " + Vol + " ", (if PercentOfDayAvg >= UnusualVolumePercent then Color.GREEN else if PercentOfDayAvg >= 100 then Color.LIME else Color.RED));
AddLabel(ShowPercentOfDayAvg, PercentOfDayAvg + "%", (if PercentOfDayAvg >= UnusualVolumePercent then Color.GREEN else if PercentOfDayAvg >= 100 then Color.LIME else Color.WHITE) );
AddLabel(ShowBarAvg, "Avg" + length  + "Bars: " + Round(AvgBars, 0) + " ", Color.LIGHT_GRAY);
AddLabel(ShowCurrentBar, "Cur Bar: " + CurVol + " ", (if CurVol >= AvgBars then Color.GREEN else Color.LIME));
AddLabel(ShowrVol, "rVol :" + Round(rVol, 2), (if rVol >= 2 then Color.GREEN else if rVol > 1 then Color.LIME else Color.WHITE));
AddLabel(ShowDollarTraded, "Traded : " + AsDollars(DollarVolume) + "  ", Color.WHITE);
AddLabel(ShowDaysDollarTraded, length + "DayTraded : " + AsDollars(DaysDollarvol) + "  ", Color.WHITE);

def AvgLine = VolDayAvg[0];
plot line = (if GetAggregationPeriod() >= AggregationPeriod.DAY then AvgLine else  AvgBars);
line.SetDefaultColor(Color.WHITE);
line.SetLineWeight(2);


#Pre, 1Hr RTH, AfterHours Volumes.
input PrestartTime = 0400;
input PreendTime = 0929;

def PreMkt = SecondsFromTime(PrestartTime) >= 0 and SecondsTillTime(PreendTime) >= 0;
def PreVolMins = if PreMkt and !PreMkt[1] then volume
                else if PreMkt then PreVolMins[1] + volume
                else PreVolMins[1];
AddLabel(if GetAggregationPeriod() >= AggregationPeriod.DAY then 0 else if PreMktVol then 1 else 0, "PreMktVol = " + PreVolMins + "  ", Color.YELLOW);
# End Volume PreMarket

input RTH1HrstartTime = 0930;
input RTH1HrendTime = 1029;

def RTH1Hr = SecondsFromTime(RTH1HrstartTime) >= 0 and SecondsTillTime(RTH1HrendTime) >= 0;
def RTH1HrMins = if RTH1Hr and !RTH1Hr[1] then volume
                else if RTH1Hr then RTH1HrMins[1] + volume
                else RTH1HrMins[1];
AddLabel(if GetAggregationPeriod() >= AggregationPeriod.DAY then 0 else if RTH1HrVol then 1 else 0, "RTH1HrVol = " + RTH1HrMins + "  ", Color.YELLOW);
#End Volume RTH First 60 Mins

input PoststartTime = 1600;
input PostendTime = 2000;

def PostMkt = SecondsFromTime(PoststartTime) >= 0 and SecondsTillTime(PostendTime) >= 0;
def PostVolMins = if PostMkt and !PostMkt[1] then volume
                else if PostMkt then PostVolMins[1] + volume
                else PostVolMins[1];
AddLabel(if GetAggregationPeriod() >= AggregationPeriod.DAY then 0 else if PostMktVol then 1 else 0, "PostMktVol = " + PostVolMins + "  ", Color.YELLOW);
# End Volume PostMarket
 
Last edited:
@SuryaKiranC

Volume Indicator v1.5.1

Left image is the indicator default; right image is my preferred settings.
The default is Super Crowded with labels.
I think the most important edge of the indicator is the ability to compare cumulative volume to stock's float in order to hypothesize a trend.
Having the overall buy/sell volume for the day is a huge plus.

I've been using the indicator in a strategy and there is an edge here.
For low float stocks with a short bias, as the chart develops the volume indicator confirms my short bias when volume does not exceed the float.
With Traded $ amount added, maybe there is more of an edge in comparing this to market cap.

I'm new to coding and the script is written very clean and organized and easy to learn.

It would be pretty cool if we can write the vol stats period to appear automatically on change of time period of the chart instead of manually.

Kn5mcjH.png
NEL3x4d.png
 

Attachments

  • Kn5mcjH.png
    Kn5mcjH.png
    113.7 KB · Views: 387
Last edited:
@jngy2k I was thinking the same. on changing the chart period, to make the higher stats change automatically.

I didn't follow the question about removed label though, was it something you removed? or happened automatically, when you changed to 3m frame?
 
@jngy2k I was thinking the same. on changing the chart period, to make the higher stats change automatically.

I didn't follow the question about removed label though, was it something you removed? or happened automatically, when you changed to 3m frame?

Yeah on the right I contemplate removing the current 1 min buy/sell %. Because this indicator presents a bit too much info for intraday trading.
I may remove day volume too. It is because this information can be seen on the lvl 2 montage and tape.

A question I have is, the code that calculate and accumulates the D Buy/Sell delays the chart from loading while it adds up the data on my TOS. Anyone else have that problem??
 
I am not seeing a delay, but perhaps I need to load up 2 charts for the same ticker with and without Higher frame Volume labels at the same time and compare. @jngy2k
 
@jngy2k Most of the labels are configured as selectable, also should be able to take out the labels we don't care about by simply commenting out the AddLabel statement in the code. with out removing the code, so any dependents will not fail.
 
@jngy2k so I can make the Higher Frame autoswitch for you, tell me what would you like to see, ex if you are on 1m what would you want the higher frame to be, define the following for me Will you?

1m == HigherFrame?
2m == HigherFrame?
3m == HigherFrame?
4m == HigherFrame?
5m == HigherFrame?
10m == HigherFrame?
15m == HigherFrame?
20m == HigherFrame?
60m == HigherFrame?
2h == HigherFrame?
4h == HigherFrame?
1D == HigherFrame?
1W == HigherFrame?

I guess that should do it.
 
@SuryaKiranC i've been intraday testing and data tracking the volume to find a edge on the higher frame and i can't find a predictive edge in itself. I've settle with only the buy/sell vol, rvol, and pre, and 1st hour vol in conjunction with the tos volume bars.

A better addition to the Vol indicator will be Float Rotation highlighting the volume bar where Day Volume exceeded Float.
So the cumulative vol from 4am-now is greater than > float = highlight volume bar.
But there is no data script for Float of a company in TOS. So maybe use Outstanding Shares.
Or if Day Dollar traded (cumulative vol*price) is greater than > Market Cap then = highlight volume bar.
Float rotation will be a good volume indicator to show if price movement will be exhausted soon or if float rotation increase rapidly will continue trend. Especially in conjunction with D Buy/Sell.*

edit:
while typing post found this and will see if it works https://usethinkscript.com/threads/float-rotation-indicator-for-thinkorswim.1319/page-2

KY23AUG.png
 

Similar threads

Not the exact question you're looking for?

Start a new thread and receive assistance from our community.

87k+ Posts
546 Online
Create Post

Similar threads

Similar threads

The Market Trading Game Changer

Join 2,500+ subscribers inside the useThinkScript VIP Membership Club
  • Exclusive indicators
  • Proven strategies & setups
  • Private Discord community
  • ‘Buy The Dip’ signal alerts
  • Exclusive members-only content
  • Add-ons and resources
  • 1 full year of unlimited support

Frequently Asked Questions

What is useThinkScript?

useThinkScript is the #1 community of stock market investors using indicators and other tools to power their trading strategies. Traders of all skill levels use our forums to learn about scripting and indicators, help each other, and discover new ways to gain an edge in the markets.

How do I get started?

We get it. Our forum can be intimidating, if not overwhelming. With thousands of topics, tens of thousands of posts, our community has created an incredibly deep knowledge base for stock traders. No one can ever exhaust every resource provided on our site.

If you are new, or just looking for guidance, here are some helpful links to get you started.

What are the benefits of VIP Membership?
VIP members get exclusive access to these proven and tested premium indicators: Buy the Dip, Advanced Market Moves 2.0, Take Profit, and Volatility Trading Range. In addition, VIP members get access to over 50 VIP-only custom indicators, add-ons, and strategies, private VIP-only forums, private Discord channel to discuss trades and strategies in real-time, customer support, trade alerts, and much more. Learn all about VIP membership here.
How can I access the premium indicators?
To access the premium indicators, which are plug and play ready, sign up for VIP membership here.
Back
Top