Hello,
I dont remember where I found the following code, if it was here or outside. However, I'm pretty bad with all this coding and stuff and don't understand how to do the following.
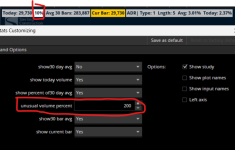
Im asking for help to create a watchlist filter from the following code for specifically the unusual volume % shown. I've attached an image of the percentage I'm requesting for reference.
Heres the code:
# Box Volume Stats
# Version 1.0
# Created by: Enigma
# Created: 05/18/17
declare lower;
#Inputs
input Show30DayAvg = yes;
input ShowTodayVolume = yes;
input ShowPercentOf30DayAvg = yes;
input UnusualVolumePercent = 200;
input Show30BarAvg = yes;
input ShowCurrentBar = yes;
#Volume Data
def volLast30DayAvg = (volume(period = "DAY")[1] + volume(period = "DAY")[2] + volume(period = "DAY")[3] + volume(period = "DAY")[4] + volume(period = "DAY")[5] + volume(period = "DAY")[6] + volume(period = "DAY")[7] + volume(period = "DAY")[8] + volume(period = "DAY")[9] + volume(period = "DAY")[10] + volume(period = "DAY")[11] + volume(period = "DAY")[12] + volume(period = "DAY")[13] + volume(period = "DAY")[14] + volume(period = "DAY")[15] + volume(period = "DAY")[16] + volume(period = "DAY")[17] + volume(period = "DAY")[18] + volume(period = "DAY")[19] + volume(period = "DAY")[20] + volume(period = "DAY")[21] + volume(period = "DAY")[22] + volume(period = "DAY")[23] + volume(period = "DAY")[24] + volume(period = "DAY")[25] + volume(period = "DAY")[26] + volume(period = "DAY")[27] + volume(period = "DAY")[28] + volume(period = "DAY")[29] + volume(period = "DAY")[30]) / 30;
def today = volume(period = "DAY");
def percentOf30Day = Round((today / volLast30DayAvg) * 100, 0);
#def avg30Bars = VolumeAvg(30).VolAvg;
def avg30Bars = (volume[1] + volume[2] + volume[3] + volume[4] + volume[5] + volume[6] + volume[7] + volume[8] + volume[9] + volume[10] + volume[11] + volume[12] + volume[13] + volume[14] + volume[15] + volume[16] + volume[17] + volume[18] + volume[19] + volume[20] + volume[21] + volume[22] + volume[23] + volume[24] + volume[25] + volume[26] + volume[27] + volume[28] + volume[29] + volume[30]) / 30;
def curVolume = volume;
# Labels
AddLabel(Show30DayAvg, "Daily Avg: " + Round(volLast30DayAvg, 0), Color.LIGHT_GRAY);
AddLabel(ShowTodayVolume, "Today: " + today, (if percentOf30Day >= UnusualVolumePercent then Color.GREEN else if percentOf30Day >= 100 then Color.ORANGE else Color.LIGHT_GRAY));
AddLabel(ShowPercentOf30DayAvg, percentOf30Day + "%", (if percentOf30Day >= UnusualVolumePercent then Color.GREEN else if percentOf30Day >= 100 then Color.ORANGE else Color.WHITE) );
AddLabel(Show30BarAvg, "Avg 30 Bars: " + Round(avg30Bars, 0), Color.LIGHT_GRAY);
AddLabel(ShowCurrentBar, "Cur Bar: " + curVolume, (if curVolume >= avg30Bars then Color.GREEN else Color.ORANGE));
Thanks in advance for the help.