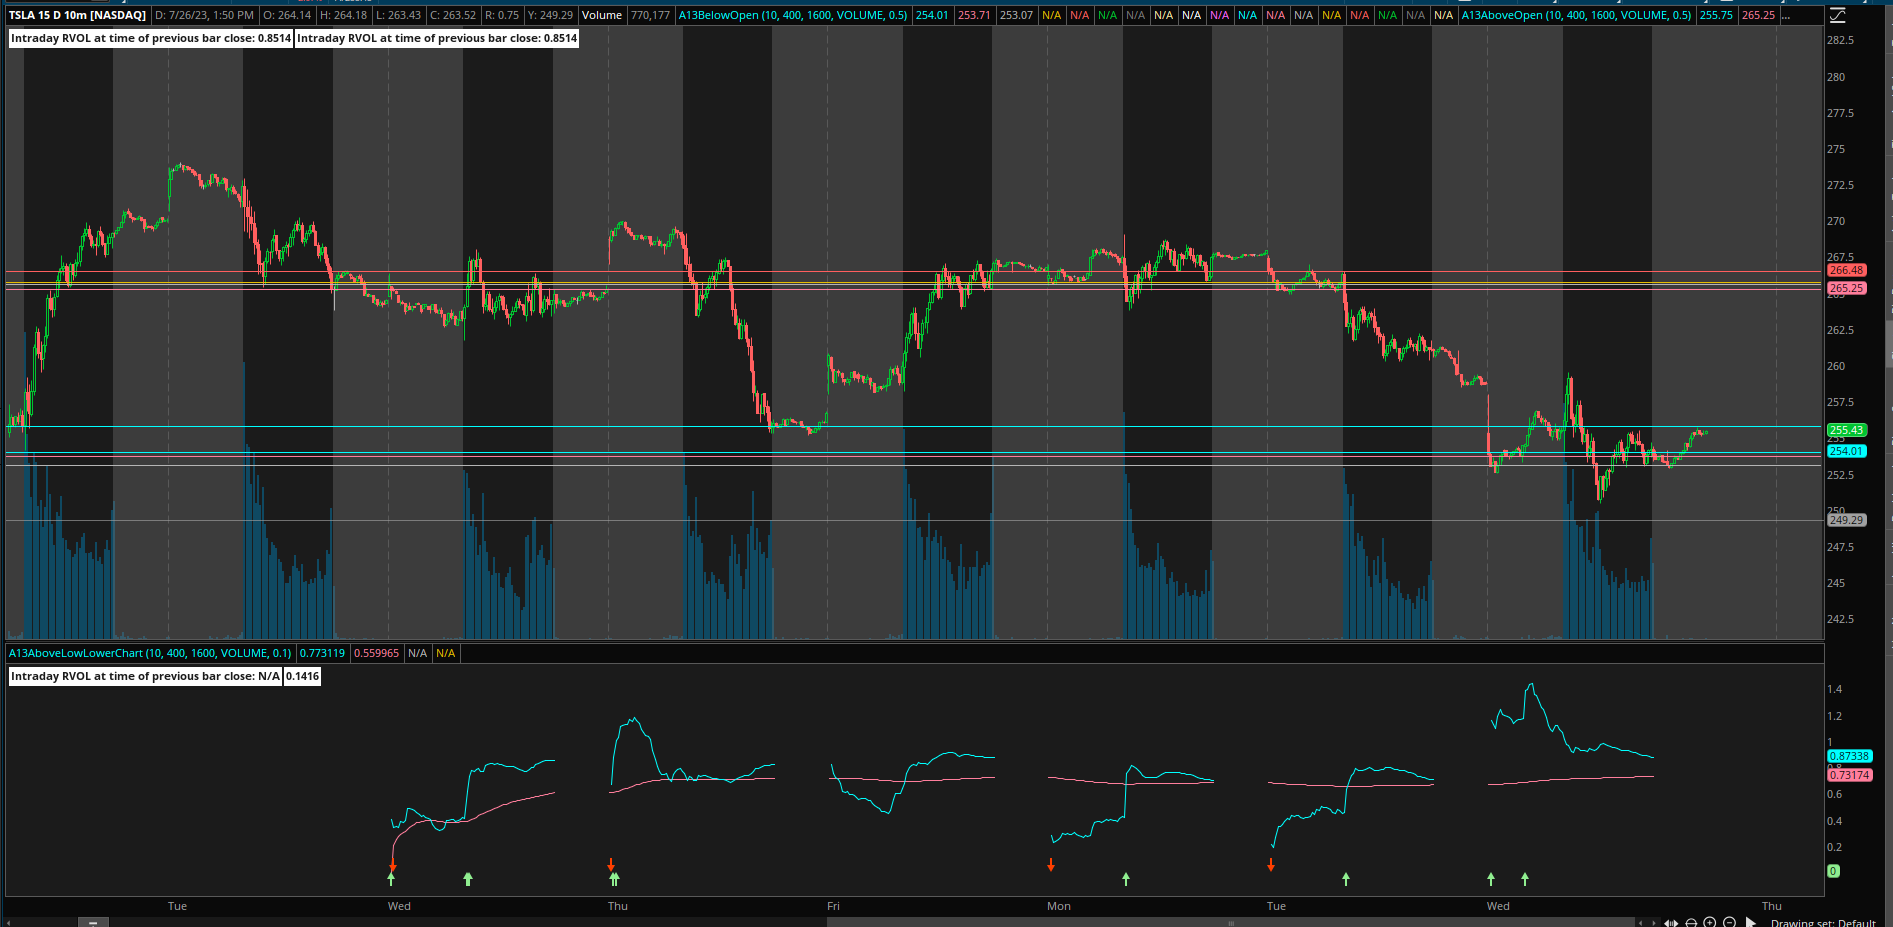
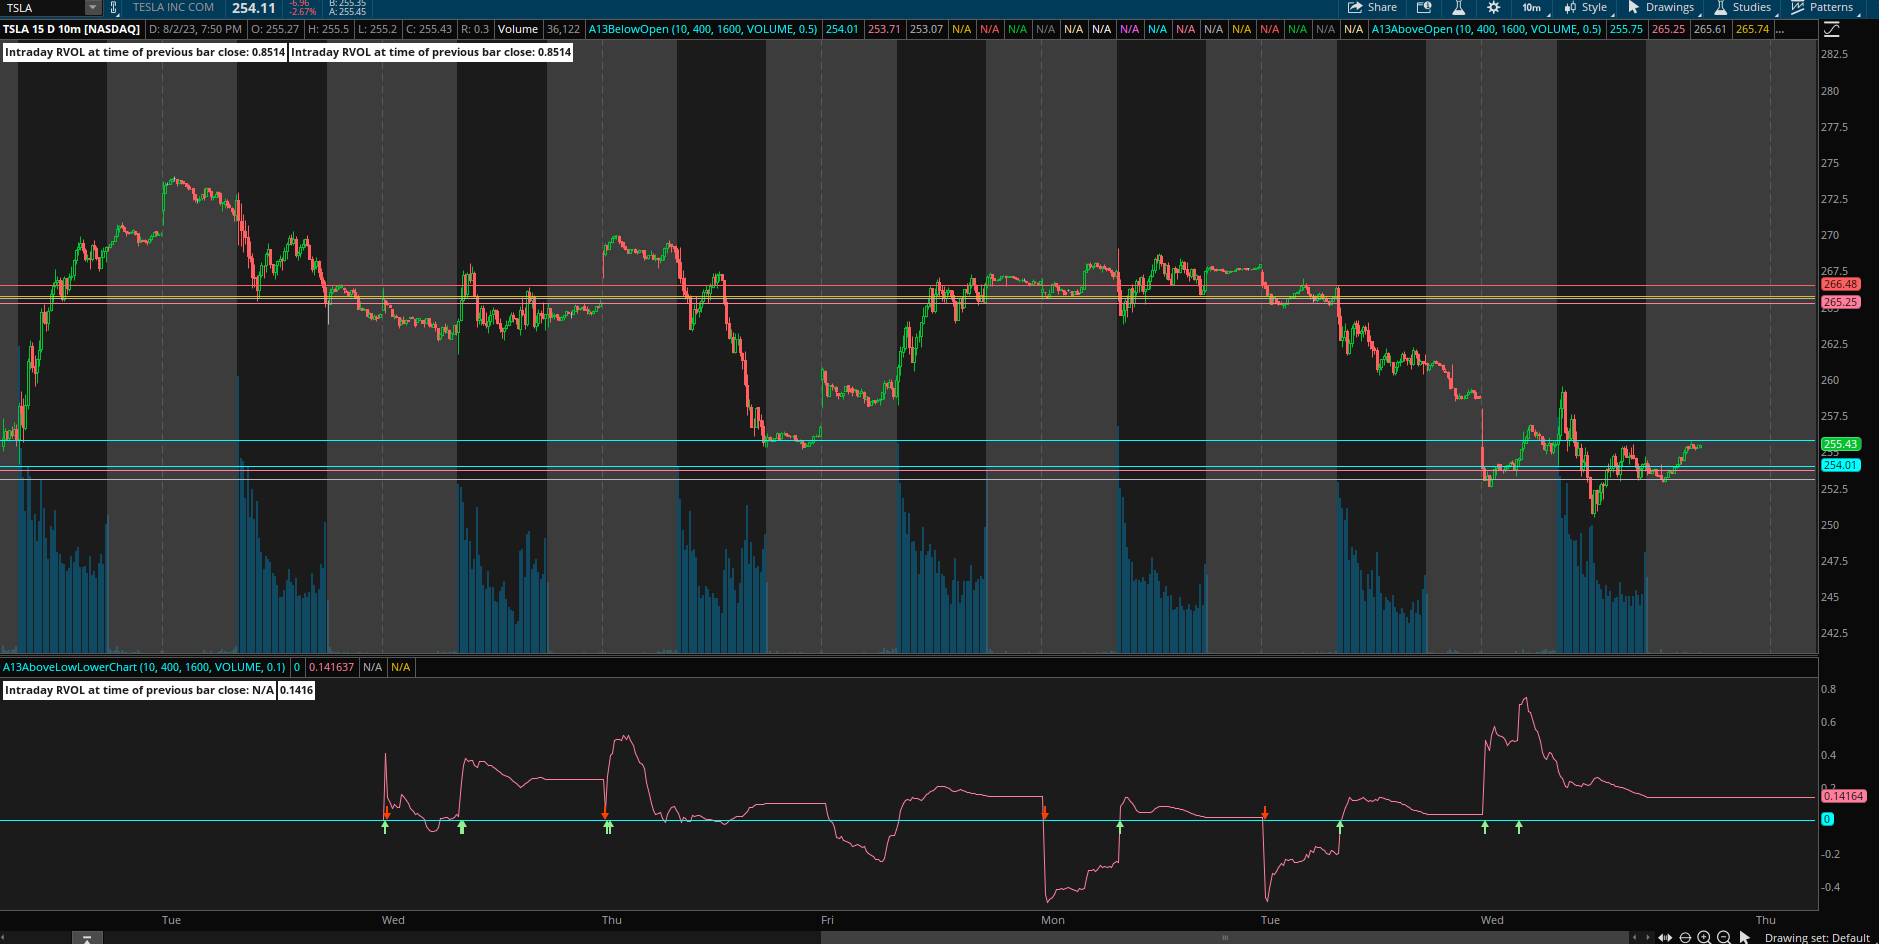
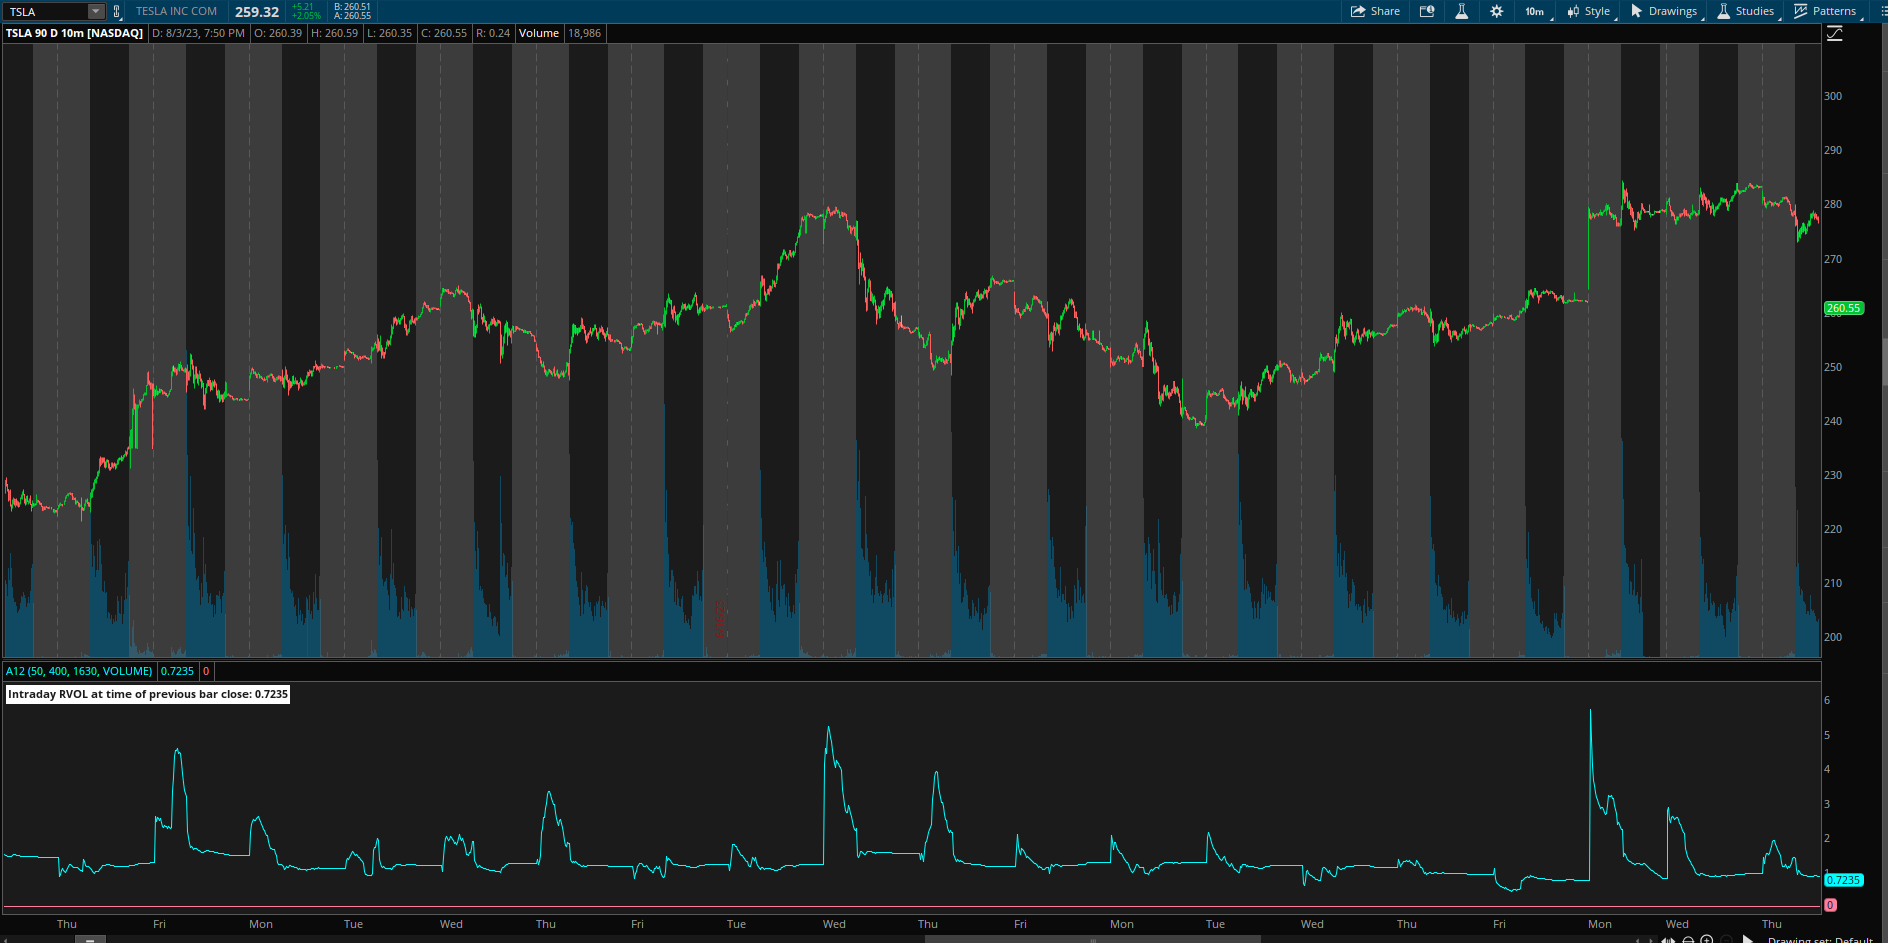
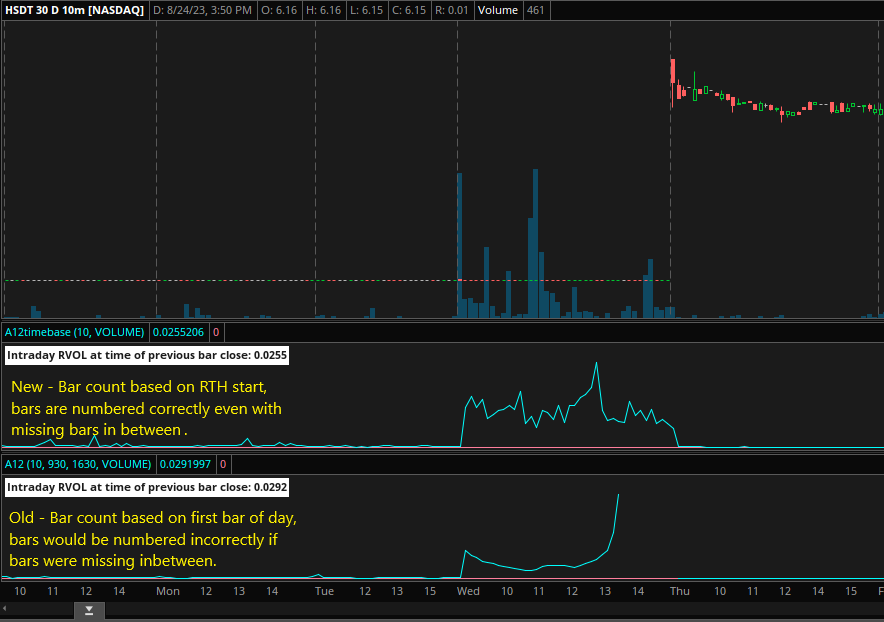
Here is a modified version of Trade Idea's Intraday Averaged RVOL that will plot without changing the times, but the calculations will be a little off due to the missing bars.
Ruby:
declare lower;
input Number_Of_Signals_To_Be_Averaged = 10;
input Value_To_Be_Averaged = volume;

def Active = 1;
def bar = BarNumber();
def BarNum = if !IsNaN(close) then bar else BarNum[1];
def VBar = HighestAll(BarNum);

#################
def NumberedBars;
if GetDay() <> GetDay()[1] {
NumberedBars = 0;
}else{
NumberedBars = NumberedBars[1] + 1;}

def FirstDayStart = CompoundValue(1,if GetDay() <> GetDay()[1] then 1 else FirstDayStart[1],0);
def TotalSignalCount = if Bar == 1 and GetDay() == GetDay()[1] then 0 else if TotalSignalCount[1] == 0 and FirstDayStart then 1 else if NumberedBars == 1 then TotalSignalCount[1] + 1 else TotalSignalCount[1];
################

def DayRunningTotal;
if !FirstDayStart or !Active{
    DayRunningTotal = 0;
} else if NumberedBars == 0 {
    DayRunningTotal = Value_To_Be_Averaged;
} else if Active {
    DayRunningTotal = DayRunningTotal[1] + Value_To_Be_Averaged;
} else {
    DayRunningTotal = 0;
}

def SignalRangeTotal = fold r = 1 to VBar with intr = 0 do if GetValue(NumberedBars,r) == NumberedBars then intr + GetValue(DayRunningTotal,r) else intr;
def TotalToBeRemoved = fold t = 1 to VBar with intt = 0 do if GetValue(NumberedBars,t) == NumberedBars and GetValue(TotalSignalCount,t) < TotalSignalCount - Number_Of_Signals_To_Be_Averaged then intt + GetValue(DayRunningTotal,t) else intt;
def RangeAverage = Round((SignalRangeTotal-TotalToBeRemoved)/Number_Of_Signals_To_Be_Averaged,0);

plot RVOL = if !IsNaN(close) and Active and TotalSignalCount > Number_Of_Signals_To_Be_Averaged and DayRunningTotal[1]/ RangeAverage[1] > 0 then DayRunningTotal[1] / RangeAverage[1] else double.nan;

plot zero = 0;

addlabel(yes,"Intraday RVOL at time of previous bar close: " + RVOL,color.white);
Last edited by a moderator: