Trade Ideas Intraday , single bar , Relative Volume RVOL For ThinkOrSwim

Svanoy

Expert
VIP
Lifetime
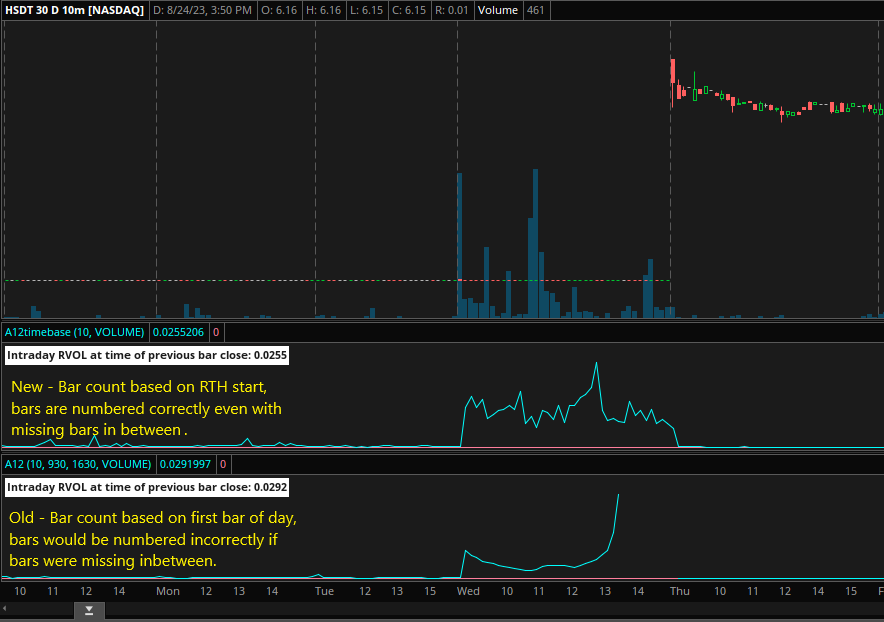
Here is a modified version of Trade Idea's Intraday Averaged RVOL that will plot without changing the times, but the calculations will be a little off due to the missing bars.
Ruby:
declare lower;
input Number_Of_Signals_To_Be_Averaged = 10;
input Value_To_Be_Averaged = volume;

def Active = 1;
def bar = BarNumber();
def BarNum = if !IsNaN(close) then bar else BarNum[1];
def VBar = HighestAll(BarNum);

#################
def NumberedBars;
if GetDay() <> GetDay()[1] {
NumberedBars = 0;
}else{
NumberedBars = NumberedBars[1] + 1;}

def FirstDayStart = CompoundValue(1,if GetDay() <> GetDay()[1] then 1 else FirstDayStart[1],0);
def TotalSignalCount = if Bar == 1 and GetDay() == GetDay()[1] then 0 else if TotalSignalCount[1] == 0 and FirstDayStart then 1 else if NumberedBars == 1 then TotalSignalCount[1] + 1 else TotalSignalCount[1];
################

def DayRunningTotal;
if !FirstDayStart or !Active{
    DayRunningTotal = 0;
} else if NumberedBars == 0 {
    DayRunningTotal = Value_To_Be_Averaged;
} else if Active {
    DayRunningTotal = DayRunningTotal[1] + Value_To_Be_Averaged;
} else {
    DayRunningTotal = 0;
}

def SignalRangeTotal = fold r = 1 to VBar with intr = 0 do if GetValue(NumberedBars,r) == NumberedBars then intr + GetValue(DayRunningTotal,r) else intr;
def TotalToBeRemoved = fold t = 1 to VBar with intt = 0 do if GetValue(NumberedBars,t) == NumberedBars and GetValue(TotalSignalCount,t) < TotalSignalCount - Number_Of_Signals_To_Be_Averaged then intt + GetValue(DayRunningTotal,t) else intt;
def RangeAverage = Round((SignalRangeTotal-TotalToBeRemoved)/Number_Of_Signals_To_Be_Averaged,0);

plot RVOL = if !IsNaN(close) and Active and TotalSignalCount > Number_Of_Signals_To_Be_Averaged and DayRunningTotal[1]/ RangeAverage[1] > 0 then DayRunningTotal[1] / RangeAverage[1] else double.nan;

plot zero = 0;

addlabel(yes,"Intraday RVOL at time of previous bar close: " + RVOL,color.white);
 
Last edited by a moderator:

Join useThinkScript to post your question to a community of 21,000+ developers and traders.

@Svanoy You are a legend.
That Rvol indicator is nearly perfect. I know for a fact there is nothing like this on this forum and this will certainly have some people interested in it. its been a long journey and for you to come in and crush it. its awesome. I will always refer to this indicator as the "Svanoy Rvol"

Ive included a few examples below of what my results are, the main problem is If you get a large volume day in the data it ruins the calculation.

Examples
SIX - Nearly perfect (trade ideas Rvol 3.7, Svanoy Rvol - 3.36)
SYM - Close but no cigar ( trade ideas 3.9, Svanoy Rvol 2.9
ZI - Day 1 massive Rvol ( Trade ideas 16.2, Svanoy Rvol 17.8 )and it was suprising very close, close enough (the example here is using historical data and think or swim on demand. it is a previous day and the time im using on my trade ideas is 4:30am hawaii time, 10:30 eastern.
ZI - Day 2 - Way off - (Trade ideas 5.6, Svanoy Rvol 2.3)

My thinking:

1. Currently its taking a 10 day average which may or may not cause results to be off if there is a massive volume day, throwing off the average. (maybe think can be solved by putting the previous day data on a moving average?) maybe also taking a 20 day sample and then putting that on a moving average would give a more consistent result.

2. Is it possible to use this on a chart with premarket data? is there a way to use a chart with premarket data and have it disregard that premarket data? If you have afterhours data on the chart it ruins the results.

3. Can you add a chart label to this?

Near perfect SIX.png
Underestimate sym.png
ZI day 1 accurate.png
Screenshot 2023-08-02 at 10.16.46 AM.png
 
Last edited by a moderator:
@sawyersweetman
2. Is it possible to use this on a chart with premarket data? is there a way to use a chart with premarket data and have it disregard that premarket data? If you have afterhours data on the chart it ruins the results.
Use the original code in post #6 and set the time of the first bar of the day to 0930.

After hours data ruins the calculations because sometimes bars have no data therefore not always plotted, adding data validation to the code would fix that.

As I stated in my prior post:
Without data validation the calculations will be slightly off if bars are missing from some days on the chart.

Look at something with higher volumes that have regular trading hours like futures contracts and you will see the difference.

1. Currently its taking a 10 day average which may or may not cause results to be off if there is a massive volume day, throwing off the average. (maybe think can be solved by putting the previous day data on a moving average?) maybe also taking a 20 day sample and then putting that on a moving average would give a more consistent result.

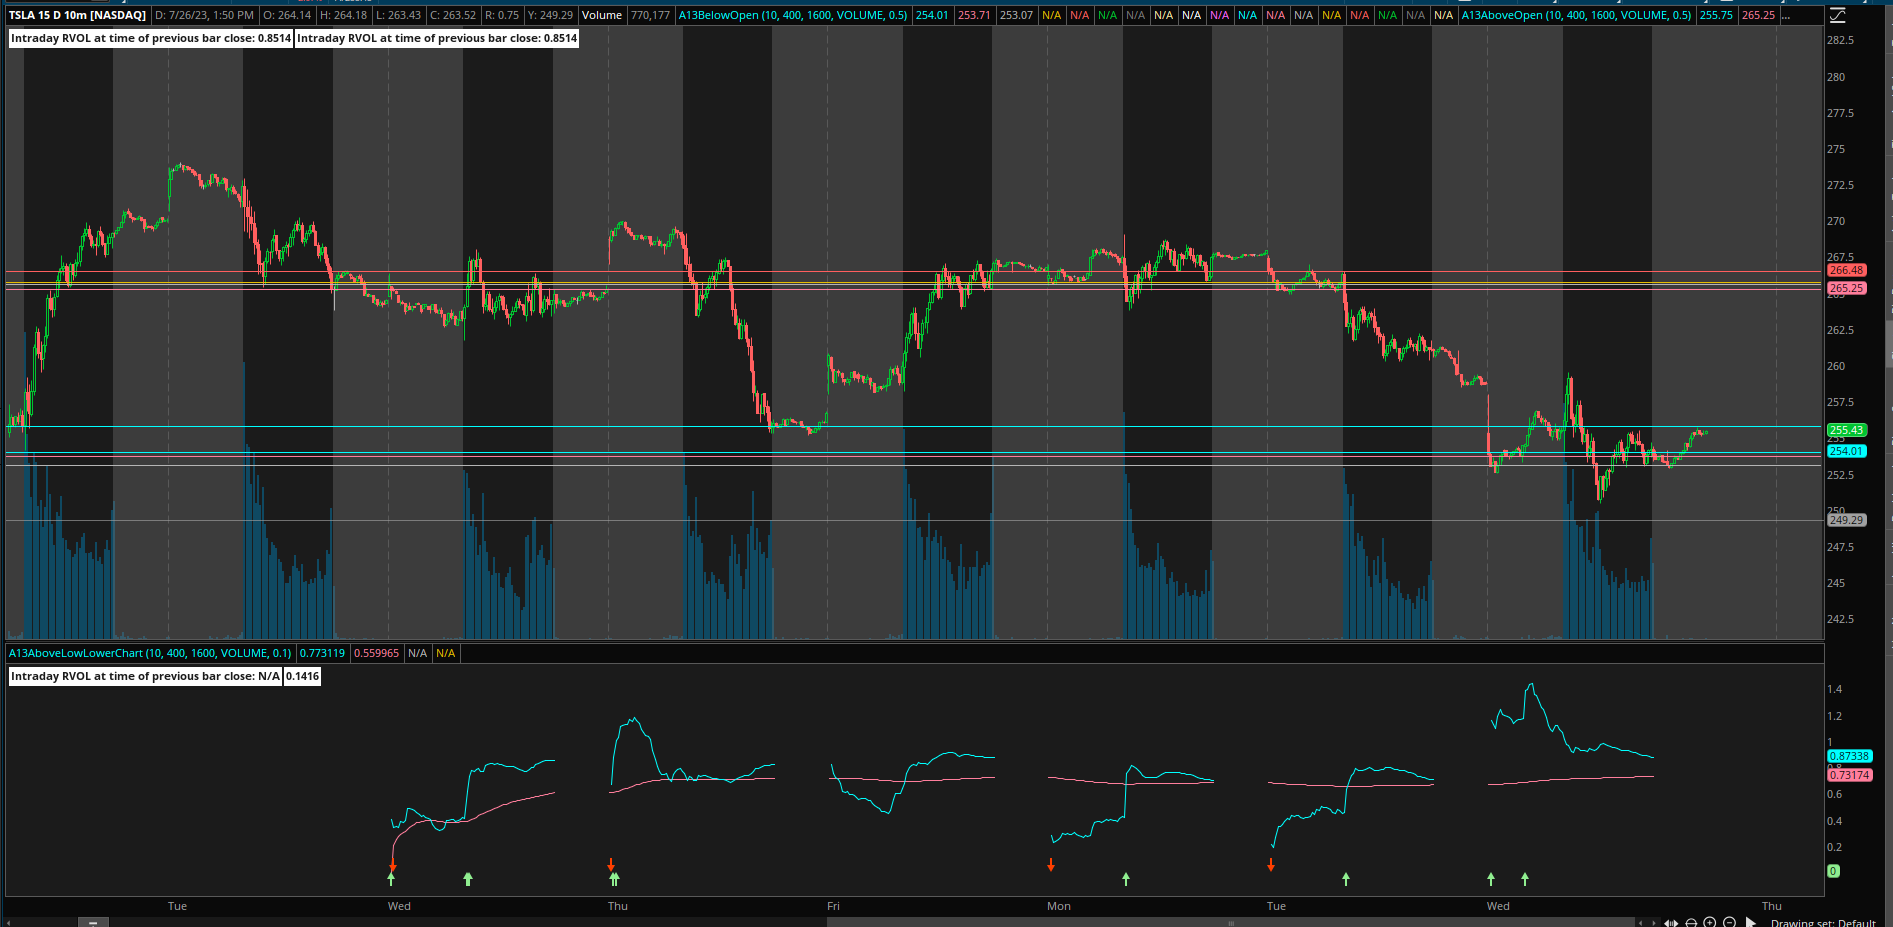
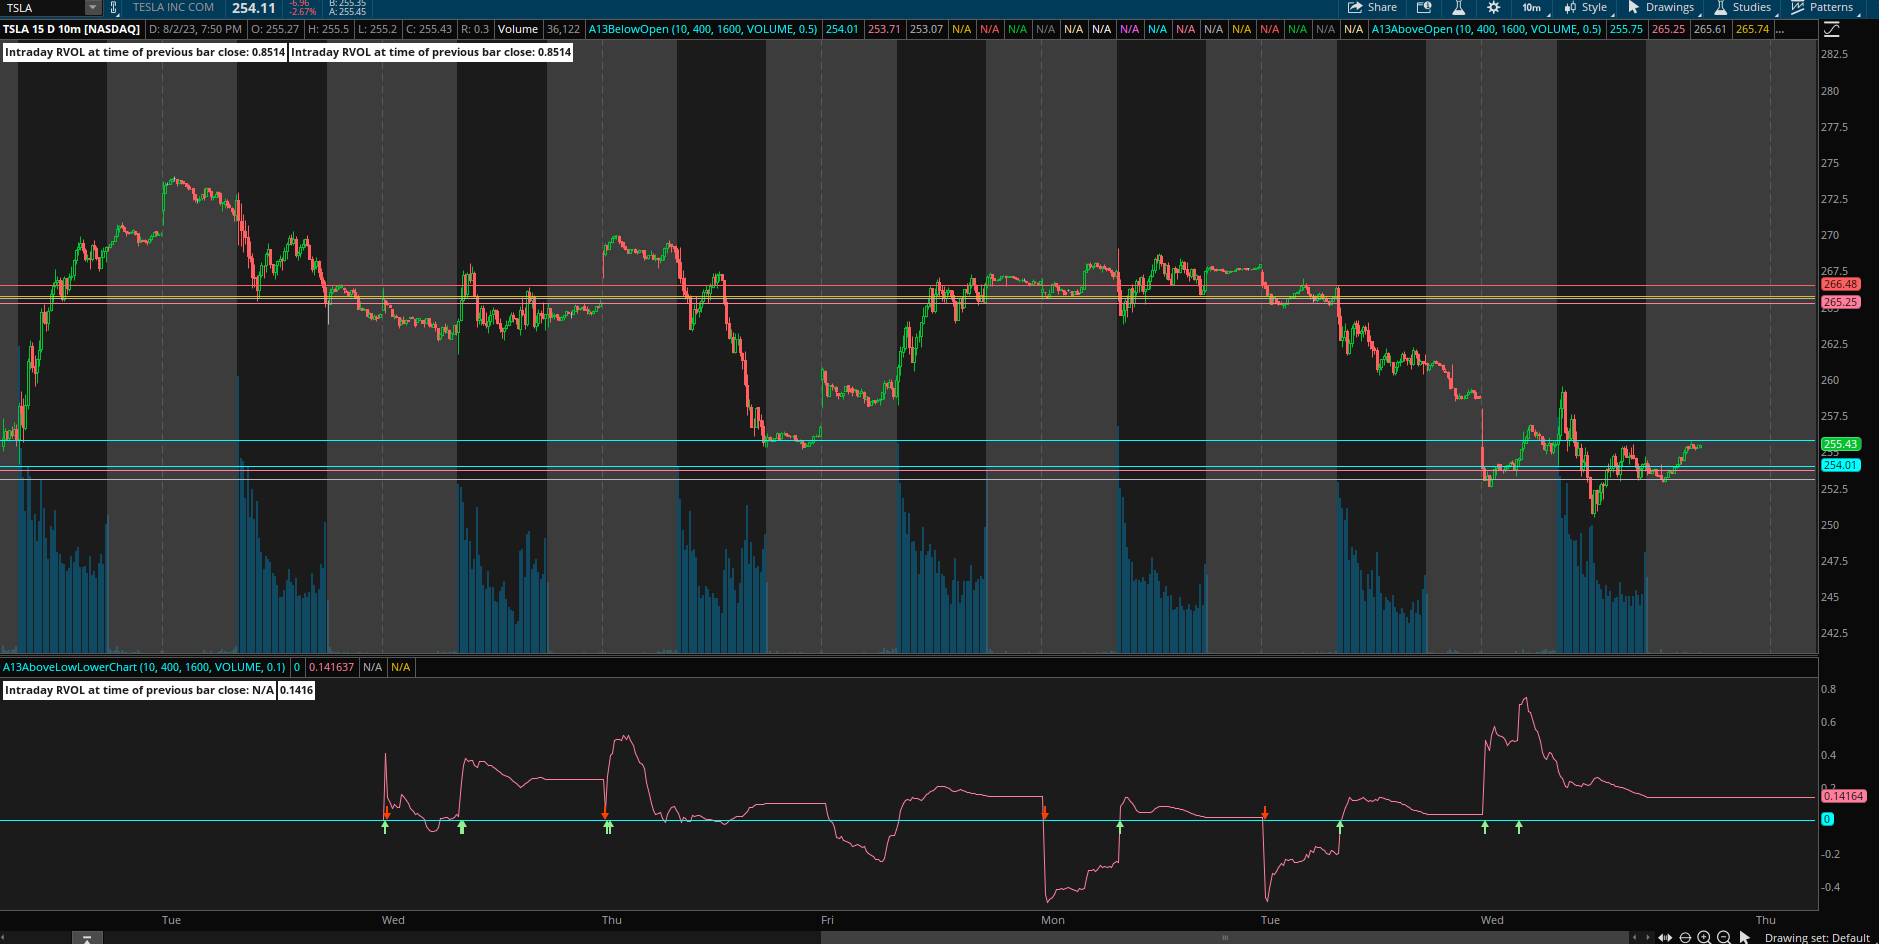
Had been messing around with it looking at averages, normalizing to a zero line, and price levels.

YWuuzUS.png

Ot3S0wq.png
 
what do you mean set my first bar to 9:30? Do you mean change my timezone so the first bar says 9:30?

Currently first bar is 3:30

Note DXC massive Rvol today.

@Svanoy
Can you make it so the sample size is 20 days or 50 days? I think that is a easier way of smoothing out the average so you dont get the Scewed results after a massive volume day.
the moving average is also a great idea to smooth out that average but it might be problem to have such a small sample size. a single outlier screws the output
 

Attachments

  • Screenshot 2023-08-03 at 5.14.22 PM.png
    Screenshot 2023-08-03 at 5.14.22 PM.png
    85.7 KB · Views: 282
@sawyersweetman
Sorry, didn't think about you being in a different time zone.
Change the input 'Time_Of_First_Bar_Of_Day' to the time of the first bar of RTH.
This will minimize the amount of missing bars.
 
@Svanoy got it, thank you sir. the longer average does seem to smooth out the results.


conclusion below:

Changing the data The 'Number_Of_Signals_To_Be_Averaged' input is the sample size. to 50 really helps if you need that day 2 to be more accurate. if you only want to trade day 1, maybe use a lower average

Ill include a picture of an example on PENN, Day 1 at 10am est Rvol on trade ideas was 43.5. Svanoy Rvol was 32.4

Day 2 Trade ideas Rvol was 7, Svanoy Rvol was 7.7

after comparing trade ideas on multiple examples its clear that this works very well. It can over estimate or under estimate relative to trade ideas but for me its very important that the day 2,3,4 etc. is more accurate. Usually on day 1 the Rvol is 3, 5, 10, 20 etc. so as long as the svanoy Rvol is in the ball park on day 1 it should be a reliable indicator of weather or not its in play. If svanoy Rvol is over 3, its gonna be in play, anything over that is obviously in play.
For day 2 same thing, i want day 2 to be 2+, ideally over 3. anything over that is obviously in play.

NOTE: i would not use it with Extended hours on as it skews the data tremendously and

Its a great indicator, im most likely going to add a dynamic chart label with colors ranging from red to green depending on the Rvol reading. Ill probably post about it later.

A big thank you for @Svanoy for making quick work of this and good luck to whoever wants to use it.
 

Attachments

  • Screenshot 2023-08-10 at 11.54.51 AM.png
    Screenshot 2023-08-10 at 11.54.51 AM.png
    470.7 KB · Views: 310
  • Screenshot 2023-08-10 at 11.57.59 AM.png
    Screenshot 2023-08-10 at 11.57.59 AM.png
    462.2 KB · Views: 317
Can someone please explain how this RVOL study works (the one by Svanoy) because i am not sure i understand it?
Let´s say i use a 180 days 2 hours chart and i want to use this RVOL study to see how the current day volume is comparing against the time period i have selected, in my case 180 days. What exactly is it comparing to?
I think you are saying you want to compare the volume Today on a 2 hour chart to the average volume at the same time using the last 180days as a reference period?

If thats what you are doing, then this is the correct indicator you would want to change the "number of signals to be averaged" to 180 days and you would need a 2h 200d chart or something more then 180 days.

this will show you what the RVOL is on that 2H candle relative to the previous 180d average, BUT its going to update every 2 hours, so it will not exactly show you what the RVOL is on that 2h bar but it will show you what the Rvol is at the same time of day and update every 2 hours

So just change the reference data as described and it should do that. Maybe @Svanoy with jump in if i am wrong.

I will give some unsolicited advice
1. Dont use after hours data on that chart
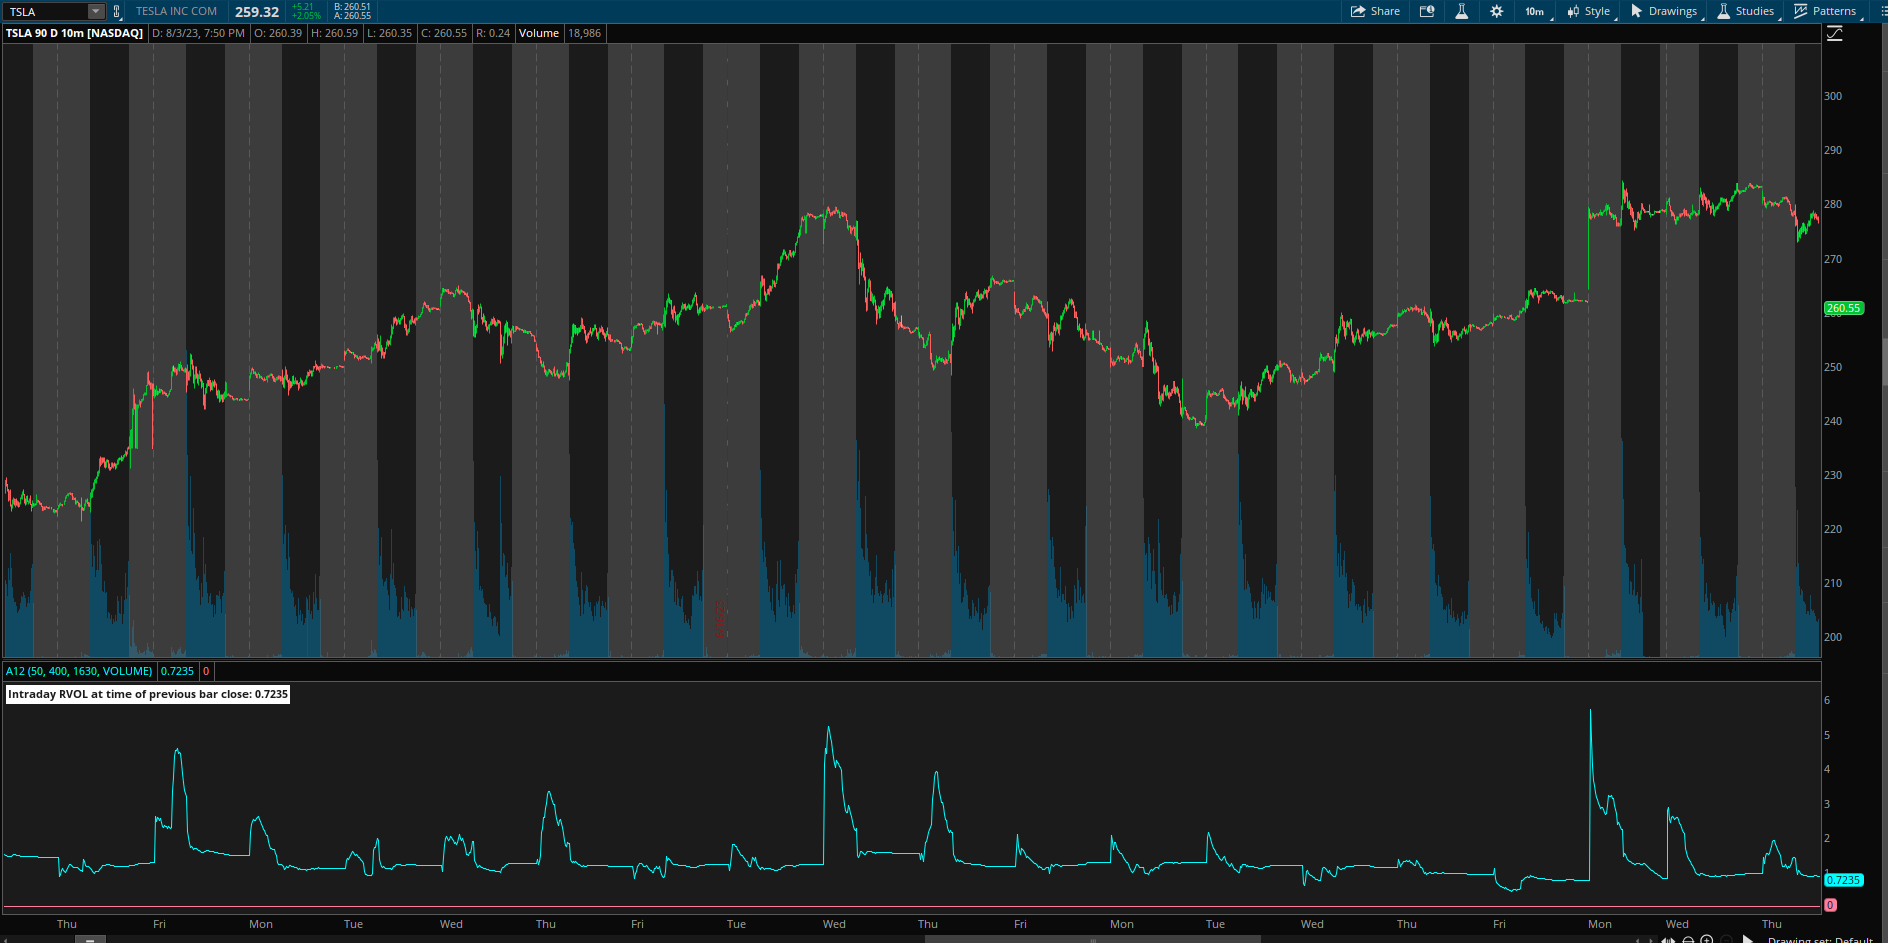
2. i am personally using this with a 60 "number of signal bars to be averaged" and i use it on a 5m 90d chart. This provides an update every 5ms and gives a really nice Rvol that i find useful and similar to a trade ideas or finviz Rvol which is the standard.
3.This calculation really slows down TOS so i run this calculation on a separate instance of TOS (open TOS again, double click the app if you are on windows and run it again. if on mac, in terminal " open -n -a thinkorswim" to open another instance. i then just make as many charts as i want and i use the linking to link it with the same number on my OTHER instance, the one that im trading on so it doesn't lag. I hope that makes sense. Its fairly common for guys to run multiple instances to correct for lag if you are running many charts or in this case a intensive calculation.

Comparing the volume done thus far today, to the volume done in previous days up until the same time as today
 
Last edited by a moderator:
is it possible to create a scan based on this study to plot when the first 5 minutes (9:30-9:35 candle ) volume is greater than the average volume of the same candle of the last 5 days ?
 
is it possible to create a scan based on this study to plot when the first 5 minutes (9:30-9:35 candle ) volume is greater than the average volume of the same candle of the last 5 days ?
Yes but i wouldn't recommend using only a 5 day reference period. it will work for day 1 but if there is large volume on day 2, the result wont reflect that in the case of a 5 day reference. im using a 60 day reference for best results. Standard Rvol calculation is usually a 20day but i believe the calculation is more complex which irons out the days following a high volume day. so in this case, longer reference period for best results.

another point, if you want to get the Rvol ASAP then you could use it on a 1m chart also. that calculation is going to slow down TOS so run it on a separate instance
which script in this post I can use it for scan ?
 
@sawyersweetman

Finally got around to adding 'Some' data validation.
This does slightly change the calculations. (should be for the better)

Thought you might want to look at it to see if it gives you better results

gwst6yS.png

Ruby:
declare lower;

input Number_Of_Signals_To_Be_Averaged = 10;
input Value_To_Be_Averaged = volume;
def bar = BarNumber();
def BarNum = if !IsNaN(close) then bar else BarNum[1];
def VBar = HighestAll(BarNum);

def NumberedBars;
if (GetTime()[1] - (RegularTradingStart(GetYYYYMMDD()[1])) > GetTime() - (RegularTradingStart(GetYYYYMMDD()))
                or GetTime()[1] - (RegularTradingStart(GetYYYYMMDD()[1])) < 0)
            and GetTime() - (RegularTradingStart(GetYYYYMMDD())) > 0 {
    NumberedBars = (GetTime() - (RegularTradingStart(GetYYYYMMDD()) + 1)) / GetAggregationPeriod();
}else {
    NumberedBars = NumberedBars[1] + (Gettime() - GetTime()[1]) / GetAggregationPeriod();
}

def StartCount = (GetTime() - (RegularTradingStart(GetYYYYMMDD()) + 1)) / GetAggregationPeriod();
def FirstDayStart = CompoundValue(1,if StartCount[1] > StartCount then 1 else FirstDayStart[1],0);
def TotalSignalCount = if !FirstDayStart then 0 else if TotalSignalCount[1] == 0 and FirstDayStart then 1 else if StartCount[1] > StartCount then TotalSignalCount[1] + 1 else TotalSignalCount[1];


    def DayRunningTotal;
if !FirstDayStart {
    DayRunningTotal = 0;
} else if NumberedBars[1] > NumberedBars {
    DayRunningTotal = Value_To_Be_Averaged;
} else {
    DayRunningTotal = DayRunningTotal[1] + Value_To_Be_Averaged;
}

def SignalRangeTotal = fold r = 1 to VBar with intr = 0 do if GetValue(NumberedBars, r) == NumberedBars then intr + GetValue(DayRunningTotal, r) else intr;
    
def TotalToBeRemoved = fold t = 1 to VBar with intt = 0 do if GetValue(NumberedBars, t) == NumberedBars and GetValue(TotalSignalCount, t) < TotalSignalCount - Number_Of_Signals_To_Be_Averaged then intt + GetValue(DayRunningTotal, t) else intt;

def RangeAverage = Round((SignalRangeTotal - TotalToBeRemoved) / Number_Of_Signals_To_Be_Averaged, 0);

def RVOL = if !IsNaN(close) and TotalSignalCount > Number_Of_Signals_To_Be_Averaged and DayRunningTotal[1] / RangeAverage[1] > 0 then DayRunningTotal[1] / RangeAverage[1] else RVOL[1];

plot RVOLP = RVOL;

plot zero = 0;

AddLabel(yes, "Intraday RVOL at time of previous bar close: " + RVOL, Color.WHITE);
 
Here is a modified version of Trade Idea's Intraday Averaged RVOL that will plot without changing the times, but the calculations will be a little off due to the missing bars.
Ruby:
declare lower;
input Number_Of_Signals_To_Be_Averaged = 10;
input Value_To_Be_Averaged = volume;

def Active = 1;
def bar = BarNumber();
def BarNum = if !IsNaN(close) then bar else BarNum[1];
def VBar = HighestAll(BarNum);

#################
def NumberedBars;
if GetDay() <> GetDay()[1] {
NumberedBars = 0;
}else{
NumberedBars = NumberedBars[1] + 1;}

def FirstDayStart = CompoundValue(1,if GetDay() <> GetDay()[1] then 1 else FirstDayStart[1],0);
def TotalSignalCount = if Bar == 1 and GetDay() == GetDay()[1] then 0 else if TotalSignalCount[1] == 0 and FirstDayStart then 1 else if NumberedBars == 1 then TotalSignalCount[1] + 1 else TotalSignalCount[1];
################

def DayRunningTotal;
if !FirstDayStart or !Active{
    DayRunningTotal = 0;
} else if NumberedBars == 0 {
    DayRunningTotal = Value_To_Be_Averaged;
} else if Active {
    DayRunningTotal = DayRunningTotal[1] + Value_To_Be_Averaged;
} else {
    DayRunningTotal = 0;
}

def SignalRangeTotal = fold r = 1 to VBar with intr = 0 do if GetValue(NumberedBars,r) == NumberedBars then intr + GetValue(DayRunningTotal,r) else intr;
def TotalToBeRemoved = fold t = 1 to VBar with intt = 0 do if GetValue(NumberedBars,t) == NumberedBars and GetValue(TotalSignalCount,t) < TotalSignalCount - Number_Of_Signals_To_Be_Averaged then intt + GetValue(DayRunningTotal,t) else intt;
def RangeAverage = Round((SignalRangeTotal-TotalToBeRemoved)/Number_Of_Signals_To_Be_Averaged,0);

plot RVOL = if !IsNaN(close) and Active and TotalSignalCount > Number_Of_Signals_To_Be_Averaged and DayRunningTotal[1]/ RangeAverage[1] > 0 then DayRunningTotal[1] / RangeAverage[1] else double.nan;

plot zero = 0;

addlabel(yes,"Intraday RVOL at time of previous bar close: " + RVOL,color.white);
Hi, my coding is limited to cut & paste & tinker. So apologies for the very basic questions:
Can this study be used on the Hourly chart?
Does it/ would it compare & plot, for example, the RVOL at 10-11am for a given day against the volume for that same 10-11 hour block back over the reference period?
Thank you
 
Well again, great script, works perfect on the chart. However, still irrelevant for intraday scanning and thus scanning in general. It returns wrong numbers in scanner. My guess is that when it's used with intraday scan (15 min for example) scan can't go back X days. If anyone had found workaround it would be great
 

Similar threads

Not the exact question you're looking for?

Start a new thread and receive assistance from our community.

87k+ Posts
202 Online
Create Post

Similar threads

Similar threads

The Market Trading Game Changer

Join 2,500+ subscribers inside the useThinkScript VIP Membership Club
  • Exclusive indicators
  • Proven strategies & setups
  • Private Discord community
  • ‘Buy The Dip’ signal alerts
  • Exclusive members-only content
  • Add-ons and resources
  • 1 full year of unlimited support

Frequently Asked Questions

What is useThinkScript?

useThinkScript is the #1 community of stock market investors using indicators and other tools to power their trading strategies. Traders of all skill levels use our forums to learn about scripting and indicators, help each other, and discover new ways to gain an edge in the markets.

How do I get started?

We get it. Our forum can be intimidating, if not overwhelming. With thousands of topics, tens of thousands of posts, our community has created an incredibly deep knowledge base for stock traders. No one can ever exhaust every resource provided on our site.

If you are new, or just looking for guidance, here are some helpful links to get you started.

What are the benefits of VIP Membership?
VIP members get exclusive access to these proven and tested premium indicators: Buy the Dip, Advanced Market Moves 2.0, Take Profit, and Volatility Trading Range. In addition, VIP members get access to over 50 VIP-only custom indicators, add-ons, and strategies, private VIP-only forums, private Discord channel to discuss trades and strategies in real-time, customer support, trade alerts, and much more. Learn all about VIP membership here.
How can I access the premium indicators?
To access the premium indicators, which are plug and play ready, sign up for VIP membership here.
Back
Top