#// This source code is subject to the terms of the Mozilla Public License 2.0 at https://mozilla.org/MPL/2.0/
#// © Ankit_1618
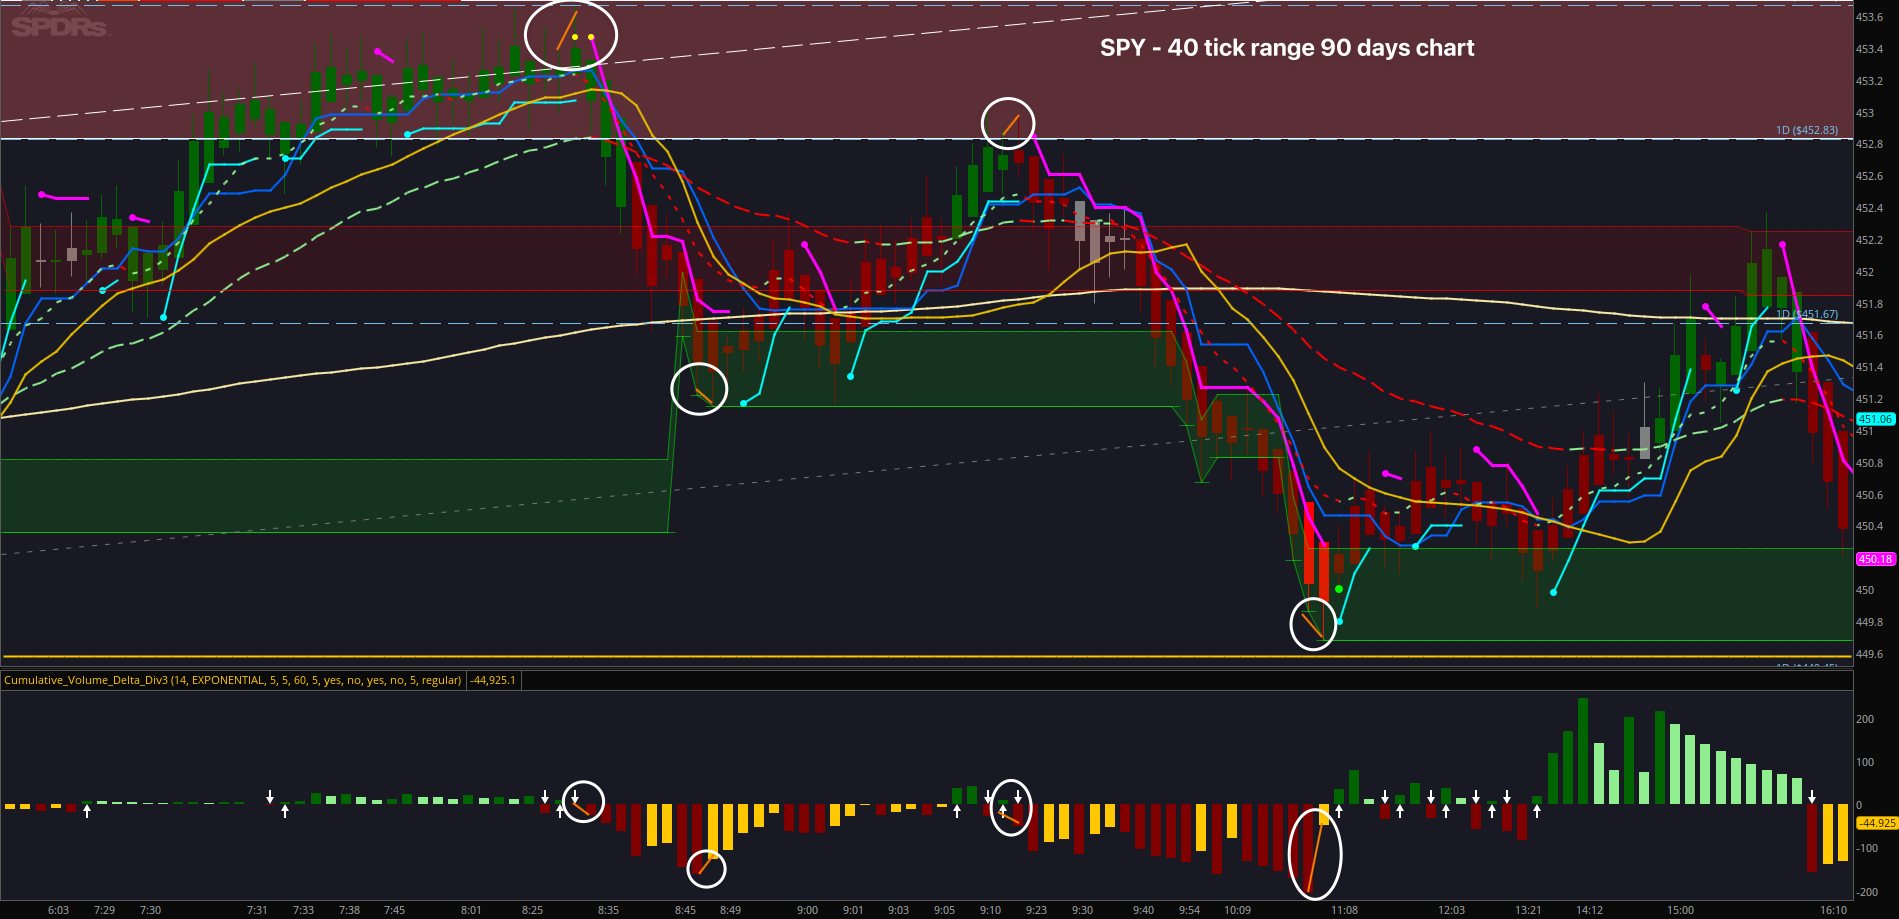
#study("Cumulative Volume Delta")
# Converted by Sam4Cok@Samer800 - Request from useThinkScript.com member
declare Lower;
input cumulation_length = 14;
input movAvgType = AverageType.EXPONENTIAL;
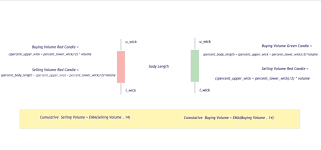
def upper_wick = if close>open then high-close else high-open;
def lower_wick = if close>open then open-low else close-low;
def spread = high-low;
def body_length = spread - (upper_wick + lower_wick);
def percent_upper_wick = upper_wick/spread;
def percent_lower_wick = lower_wick/spread;
def percent_body_length = body_length/spread;
def buying_volume = if close>open then
(percent_body_length + (percent_upper_wick + percent_lower_wick)/2)*volume else
((percent_upper_wick + percent_lower_wick)/2) * volume;
def selling_volume = if close<open then
(percent_body_length + (percent_upper_wick + percent_lower_wick)/2)*volume else
((percent_upper_wick + percent_lower_wick)/2) * volume;
def cumulative_buying_volume = MovingAverage(movAvgType, buying_volume,cumulation_length);
def cumulative_selling_volume = MovingAverage(movAvgType, selling_volume,cumulation_length);
#AddCloud(cumulative_buying_volume, cumulative_selling_volume, Color.DARK_GREEN, Color.DARK_RED, yes);
def volume_strength_wave = if cumulative_buying_volume > cumulative_selling_volume then
cumulative_buying_volume else cumulative_selling_volume;
def ema_volume_strength_wave = MovingAverage(movAvgType, volume_strength_wave , cumulation_length);
def emaVol = ema_volume_strength_wave;
#emaVol.SetDefaultColor(Color.GRAY);
def cumulative_volume_delta = cumulative_buying_volume - cumulative_selling_volume;
plot CumVolDeltaHist = cumulative_volume_delta;#, color= cumulative_volume_delta>0 ? color.green : COLOR.DARK_RED, style=plot.style_columns, transp=61)
#CumVolDeltaHist.AssignValueColor(if cumulative_volume_delta>0 then Color.GREEN else COLOR.DARK_RED);
CumVolDeltaHist.SetPaintingStrategy(PaintingStrategy.SQUARED_HISTOGRAM);
CumVolDeltaHist.DefineColor("Positive and Up", Color.dark_GREEN);
CumVolDeltaHist.DefineColor("Positive and Down", Color.light_green);
CumVolDeltaHist.DefineColor("Negative and Down", COLOR.DARK_RED);
CumVolDeltaHist.DefineColor("Negative and Up", Color.orange);
CumVolDeltaHist.AssignValueColor(if CumVolDeltaHist >= 0 then if CumVolDeltaHist > CumVolDeltaHist[1] then CumVolDeltaHist.Color("Positive and Up") else CumVolDeltaHist.Color("Positive and Down") else if CumVolDeltaHist < CumVolDeltaHist[1] then CumVolDeltaHist.Color("Negative and Down") else CumVolDeltaHist.Color("Negative and Up"));
plot UpSignal = if CumVolDeltaHist crosses above 0 then 0 else Double.NaN;
plot DownSignal = if CumVolDeltaHist crosses below 0 then 0 else Double.NaN;
UpSignal.SetDefaultColor(Color.WHITE);
UpSignal.SetPaintingStrategy(PaintingStrategy.ARROW_UP);
Upsignal.setlineWeight(1);
DownSignal.SetDefaultColor(Color.WHITE);
DownSignal.SetPaintingStrategy(PaintingStrategy.ARROW_DOWN);
Downsignal.setlineWeight(1);
Upsignal.HideBubble();
Upsignal.HideTitle();
Downsignal.HideBubble();
Downsignal.HideTitle();
#----Div-----------
input LookBackRight = 5; # "Pivot Lookback Right"
input LookBackLeft = 5; # "Pivot Lookback Left"
input MaxLookback = 60; # "Max of Lookback Range"
input MinLookback = 5; # "Min of Lookback Range"
input DivBull = yes; # "Plot Bullish"
input DivHiddenBull = no; # "Plot Hidden Bullish"
input DivBear = yes; # "Plot Bearish"
input DivHiddenBear = no; # "Plot Hidden Bearish"
def divSrc = cumulative_volume_delta;
def h = high;
def l = low;
script FindPivots {
input dat = close; # default data or study being evaluated
input HL = 0; # default high or low pivot designation, -1 low, +1 high
input lbL = 5; # default Pivot Lookback Left
input lbR = 1; # default Pivot Lookback Right
##############
def _nan; # used for non-number returns
def _BN; # the current barnumber
def _VStop; # confirms that the lookforward period continues the pivot trend
def _V; # the Value at the actual pivot point
##############
_BN = BarNumber();
_nan = Double.NaN;
_VStop = if !isNaN(dat) and lbr > 0 and lbl > 0 then
fold a = 1 to lbR + 1 with b=1 while b do
if HL > 0 then dat > GetValue(dat,-a) else dat < GetValue(dat,-a) else _nan;
if (HL > 0) {
_V = if _BN > lbL + 1 and dat == Highest(dat, lbL + 1) and _VStop
then dat else _nan;
} else {
_V = if _BN > lbL + 1 and dat == Lowest(dat, lbL + 1) and _VStop
then dat else _nan;
}
plot result = if !IsNaN(_V) and _VStop then _V else _nan;
}
#_inRange(cond) =>
script _inRange {
input cond = yes;
input rangeUpper = 60;
input rangeLower = 5;
def bars = if cond then 0 else bars[1] + 1;
def inrange = (rangeLower <= bars) and (bars <= rangeUpper);
plot retrun = inRange;
}
def pl = findpivots(divSrc,-1, LookBackLeft, LookBackRight);
def ph = findpivots(divSrc, 1, LookBackLeft, LookBackRight);
def plFound = if !isNaN(pl) then 1 else 0;
def phFound = if !isNaN(ph) then 1 else 0;
def vlFound1 = if plFound then divSrc else vlFound1[1];
def vlFound_ = if vlFound1==0 then divSrc[1] else vlFound1;
def vlFound = if vlFound_!=vlFound_[1] then vlFound_[1] else vlFound[1];
#valuewhen(plFound, divSrc, MinLookback, MaxLookback, 1);
def vhFound1 = if phFound then divSrc else vhFound1[1];
def vhFound_ = if vhFound1==0 then divSrc[1] else vhFound1;
def vhFound = if vhFound_!=vhFound_[1] then vhFound_[1] else vhFound[1];
#valuewhen(phFound, divSrc, MinLookback, MaxLookback, 1);
def plPrice1 = if plFound then l else plPrice1[1];
def plPrice_ = if plPrice1 == 0 then l[1] else plPrice1;
def plPrice = if plPrice_!=plPrice_[1] then plPrice_[1] else plPrice[1];
#valuewhen(plFound, l, MinLookback, MaxLookback, 1);
def phPrice1 = if phFound then h else phPrice1[1];
def phPrice_ = if phPrice1==0 then h[1] else phPrice1;
def phPrice = if phPrice_!=phPrice_[1] then phPrice_[1] else phPrice[1];
#valuewhen(phFound, h, MinLookback, MaxLookback, 1);
#// Regular Bullish
def inRangePl = _inRange(plFound[1],MaxLookback,MinLookback);
def oscHL = divSrc > vlFound and inRangePl;
def priceLL = l < plPrice;
def bullCond = DivBull and plFound and oscHL and priceLL;
#// Hidden Bullish
def oscLL = divSrc < vlFound and inRangePl;
def priceHL = l > plPrice;
def hiddenBullCond = DivHiddenBull and plFound and oscLL and priceHL;
#// Regular Bearish
def inRangePh = _inRange(phFound[1],MaxLookback,MinLookback);
def oscLH = divSrc < vhFound and inRangePh;
def priceHH = h > phPrice;
def bearCond = DivBear and phFound and oscLH and priceHH;
#// Hidden Bearish
def oscHH = divSrc > vhFound and inRangePh;
def priceLH = h < phPrice;
def hiddenBearCond = DivHiddenBear and phFound and oscHH and priceLH;
#------ Bubbles
#addchartbubble(bullCond, divSrc, "D", color.GREEN, no);
#addchartbubble(bearCond, divSrc, "D", CreateColor(156,39,176), yes);
#addchartbubble(hiddenBullCond, divSrc, "H", color.DARK_green, no);
#addchartbubble(hiddenBearCond, divSrc, "H", color.DARK_red, yes);
#----End
# DIVERGENCE
input divergenceLength = 5; #hint divergenceLength: The number of bars used to calculate divergences.
input divergenceType = {default regular, reverse}; #hint divergenceType: The type of divergence. A regular divergence is when price is making higher highs (or lower lows), while the indicator is making lower highs (or higher lows). A reverse divergence (also called a hidden divergence) is when the indicator is making higher highs (or lower lows), while price is making lower highs (or higher lows).
#Hint: The output of this indicator is for informational and educational use only, is not an investment recommendation or advice, and should not be relied upon in making the decision to buy or sell a security or pursue a particular investment strategy.
def xDownBars;
def xUpBars;
def xDowns;
def xUps;
def hiBars;
def loBars;
def pivotTop;
def pivotBottom;
def hiInd;
def loInd;
def hiPrice;
def loPrice;
plot bearishd;
plot bullishd;
def K = CumVolDeltaHist;
def Over_Boughta = 5;
def Over_Solda = -5;
#K.SetDefaultColor(color.white);
#K.SetLineWeight(2);
def ind;
ind = k;
# Bearish
pivotTop =
if
divergenceType == divergenceType.regular
then
ind[1] > over_Boughta and ind[1] == Highest(ind, divergenceLength + 1)
else
ind[1] >= 50 and
ind[1] == highest(ind, divergenceLength + 1) and
ind[1] == highest(ind, divergenceLength+1)[-divergenceLength+1];
if pivotTop
then {
hiBars = 1;
hiInd = ind[1];
hiPrice = max(high[2], max(high[1], high[0]));
}
else {
hiBars = hiBars[1] + 1;
hiInd = hiInd[1];
hiPrice = hiPrice[1];
}
if ind[1] crosses below Over_Boughta
then {
xDownBars = 1;
xDowns = xDowns[1] + 1;
}
else {
xDownBars = xDownBars[1] + 1;
xDowns = if pivotTop[1] then 0 else xDowns[1];
}
def bearCond1;
switch (divergenceType) {
case regular:
bearCond1 =
ind[1] >= 0 and
ind < ind[1] and
high[1] == Highest(high, divergenceLength + 1) and
hiBars[1] > xDownBars[1] and
xDowns == 1 and
close < close[1] and
hiPrice[1] < high[1] and
hiInd[1] > ind[1];
case reverse:
bearCond1 =
ind[1] >= 0 and
ind < ind[1] and
# high[1] == Highest(high, divergenceLength) and
# hiBars[1] > xDownBars[1] and
# xDowns == 1 and
close < close[1] and
hiPrice[1] > high[1] and hiPrice[1] > high and
hiInd[1] < ind[1];}
bearishd =
if
bearCond
then
ind[1]
else
Double.NaN;;
bearishd.SetPaintingStrategy(PaintingStrategy.ARROW_DOWN);
bearishd.SetDefaultColor(Color.CYAN);
bearishd.setLineWeight(2);
bearishd.hideTitle();
bearishd.hideBubble();
def countBear = if bearCond[-1] then countBear[1] + 1 else countBear[1];
def recentBear = countBear == HighestAll(countBear);
def secHigh = highestAll(if bearCond[-1] and recentBear then ind else Double.NaN);
#def firstHigh = highestAll(if bearCond and recentBear and ind[1] == secHigh then hiInd[1] else double.NaN);
def FH_bar = highestAll(if recentBear and bearCond[-1] and ind == secHigh then getvalue(barNumber(), hibars) else double.NaN);
plot bearTrendline =
if
recentBear and bearCond[-1] and ind == secHigh
then
max(ind[1], ind[0])
else
# if pivotTop and hiInd == firstHigh
if
FH_bar == barNumber()
then
ind
else
double.NaN;
bearTrendline.EnableApproximation();
bearTrendline.setDefaultColor(COLOR.DARK_RED);
bearTrendline.setLineWeight(4);
bearTrendline.hideBubble();
bearTrendline.hideTitle();
#Bullish
pivotBottom =
if
divergenceType == divergenceType.regular
then
ind[1] < over_Solda and ind[1] == lowest(ind, divergenceLength + 1)
else
ind[1] <= 50 and
ind[1] == lowest(ind, divergenceLength+1) and
ind[1] == lowest(ind, divergenceLength+1)[-divergenceLength+1];
if pivotBottom
then {
loBars = 1;
loInd = ind[1];
loPrice = min(low[2], min(low[1], low[0]));
}
else {
loBars = loBars[1] + 1;
loInd = loInd[1];
loPrice = loPrice[1];
}
if ind[1] crosses above over_Solda
then {
xUpBars = 1;
xUps = xUps[1] + 1;
}
else {
xUpBars = xUpBars[1] + 1;
xUps = if pivotBottom[1] then 0 else xUps[1];
}
def bullCond1;
switch (divergenceType){
case regular:
bullCond1 =
ind[1] <= 0 and
ind > ind[1] and
low[1] == Lowest(low, divergenceLength + 1) and
loBars[1] > xUpBars[1] and
xUps == 1 and
close > close[1] and
loPrice[1] > low[1] and
loInd[1] < ind[1];
case reverse:
bullCond1 =
ind[1] <= 0 and
ind > ind[1] and
# low[1] == Lowest(low, divergenceLength) and
# loBars[1] > xUpBars[1] and
# xUps == 1 and
close > close[1] and
loPrice[1] < low[1] and loPrice[1] < low and
loInd[1] > ind[1];}
bullishd =
if
bullCond
then
ind[1]
else
Double.NaN;
bullishd.SetPaintingStrategy(PaintingStrategy.ARROW_UP);
bullishd.SetDefaultColor(Color.CYAN);
bullishd.setLineWeight(2);
bullishd.HideTitle();
bullishd.HideBubble();
def countBull = if bullCond[-1] then countBull[1] + 1 else countBull[1];
def recentBull = countBull == HighestAll(countBull);
def secLow = highestAll(if bullCond[-1] and recentBull then ind else Double.NaN);
#def firstLow = highestAll(if bullCond and recentBull and ind[1] == secLow then loInd[1] else double.NaN);
def FL_bar = highestAll(if recentBull and bullCond[-1] and ind == secLow then getvalue(barNumber(), lobars) else double.NaN);
plot bullTrendline =
if
recentBull and bullCond[-1] and ind == secLow
then
min(ind[1], ind[0])
else
if
# pivotBottom and loInd == firstLow
FL_bar == barNumber()
then
ind[0]
else
double.NaN;
bullTrendline.EnableApproximation();
bullTrendline.setDefaultColor(color.GREEN);
bullTrendline.setLineWeight(4);
bullTrendline.hideBubble();
bullTrendline.hideTitle();