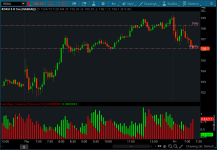
This indicator helps you identify the beginning and end of a trend using volume and price.
This is somewhat similar to the other buy/sell volume pressure indicator.

For up bars...
If you have a large price range with low volume , that's very bullish.
If you have a small price range with low volume , that's bullish.
For down bars...
If you have a large price range with low volume , that's very bearish.
If you have a small price range with low volume , that's bearish.
You can set the moving average period, 14 is the default.
This is somewhat similar to the other buy/sell volume pressure indicator.
thinkScript Code
Code:
# Hersheys Volume Pressure v1
# Assembled by BenTen at useThinkScript.com
# Converted from https://www.tradingview.com/script/sagqjOJG-Hersheys-Volume-Pressure-v1/

declare lower;

input abc = 14;
def upforce = if open < close then (close - open) / volume else 0;
def downforce = if open > close then (open - close) / volume else 0;
def d = expAverage(downforce, abc);
def u = expAverage(upforce, abc);

plot line1 = d;
plot line2 = u;

line1.SetPaintingStrategy(PaintingStrategy.HISTOGRAM);
line1.assignValueColor(Color.red);
line2.SetPaintingStrategy(PaintingStrategy.HISTOGRAM);
line2.assignValueColor(Color.green);