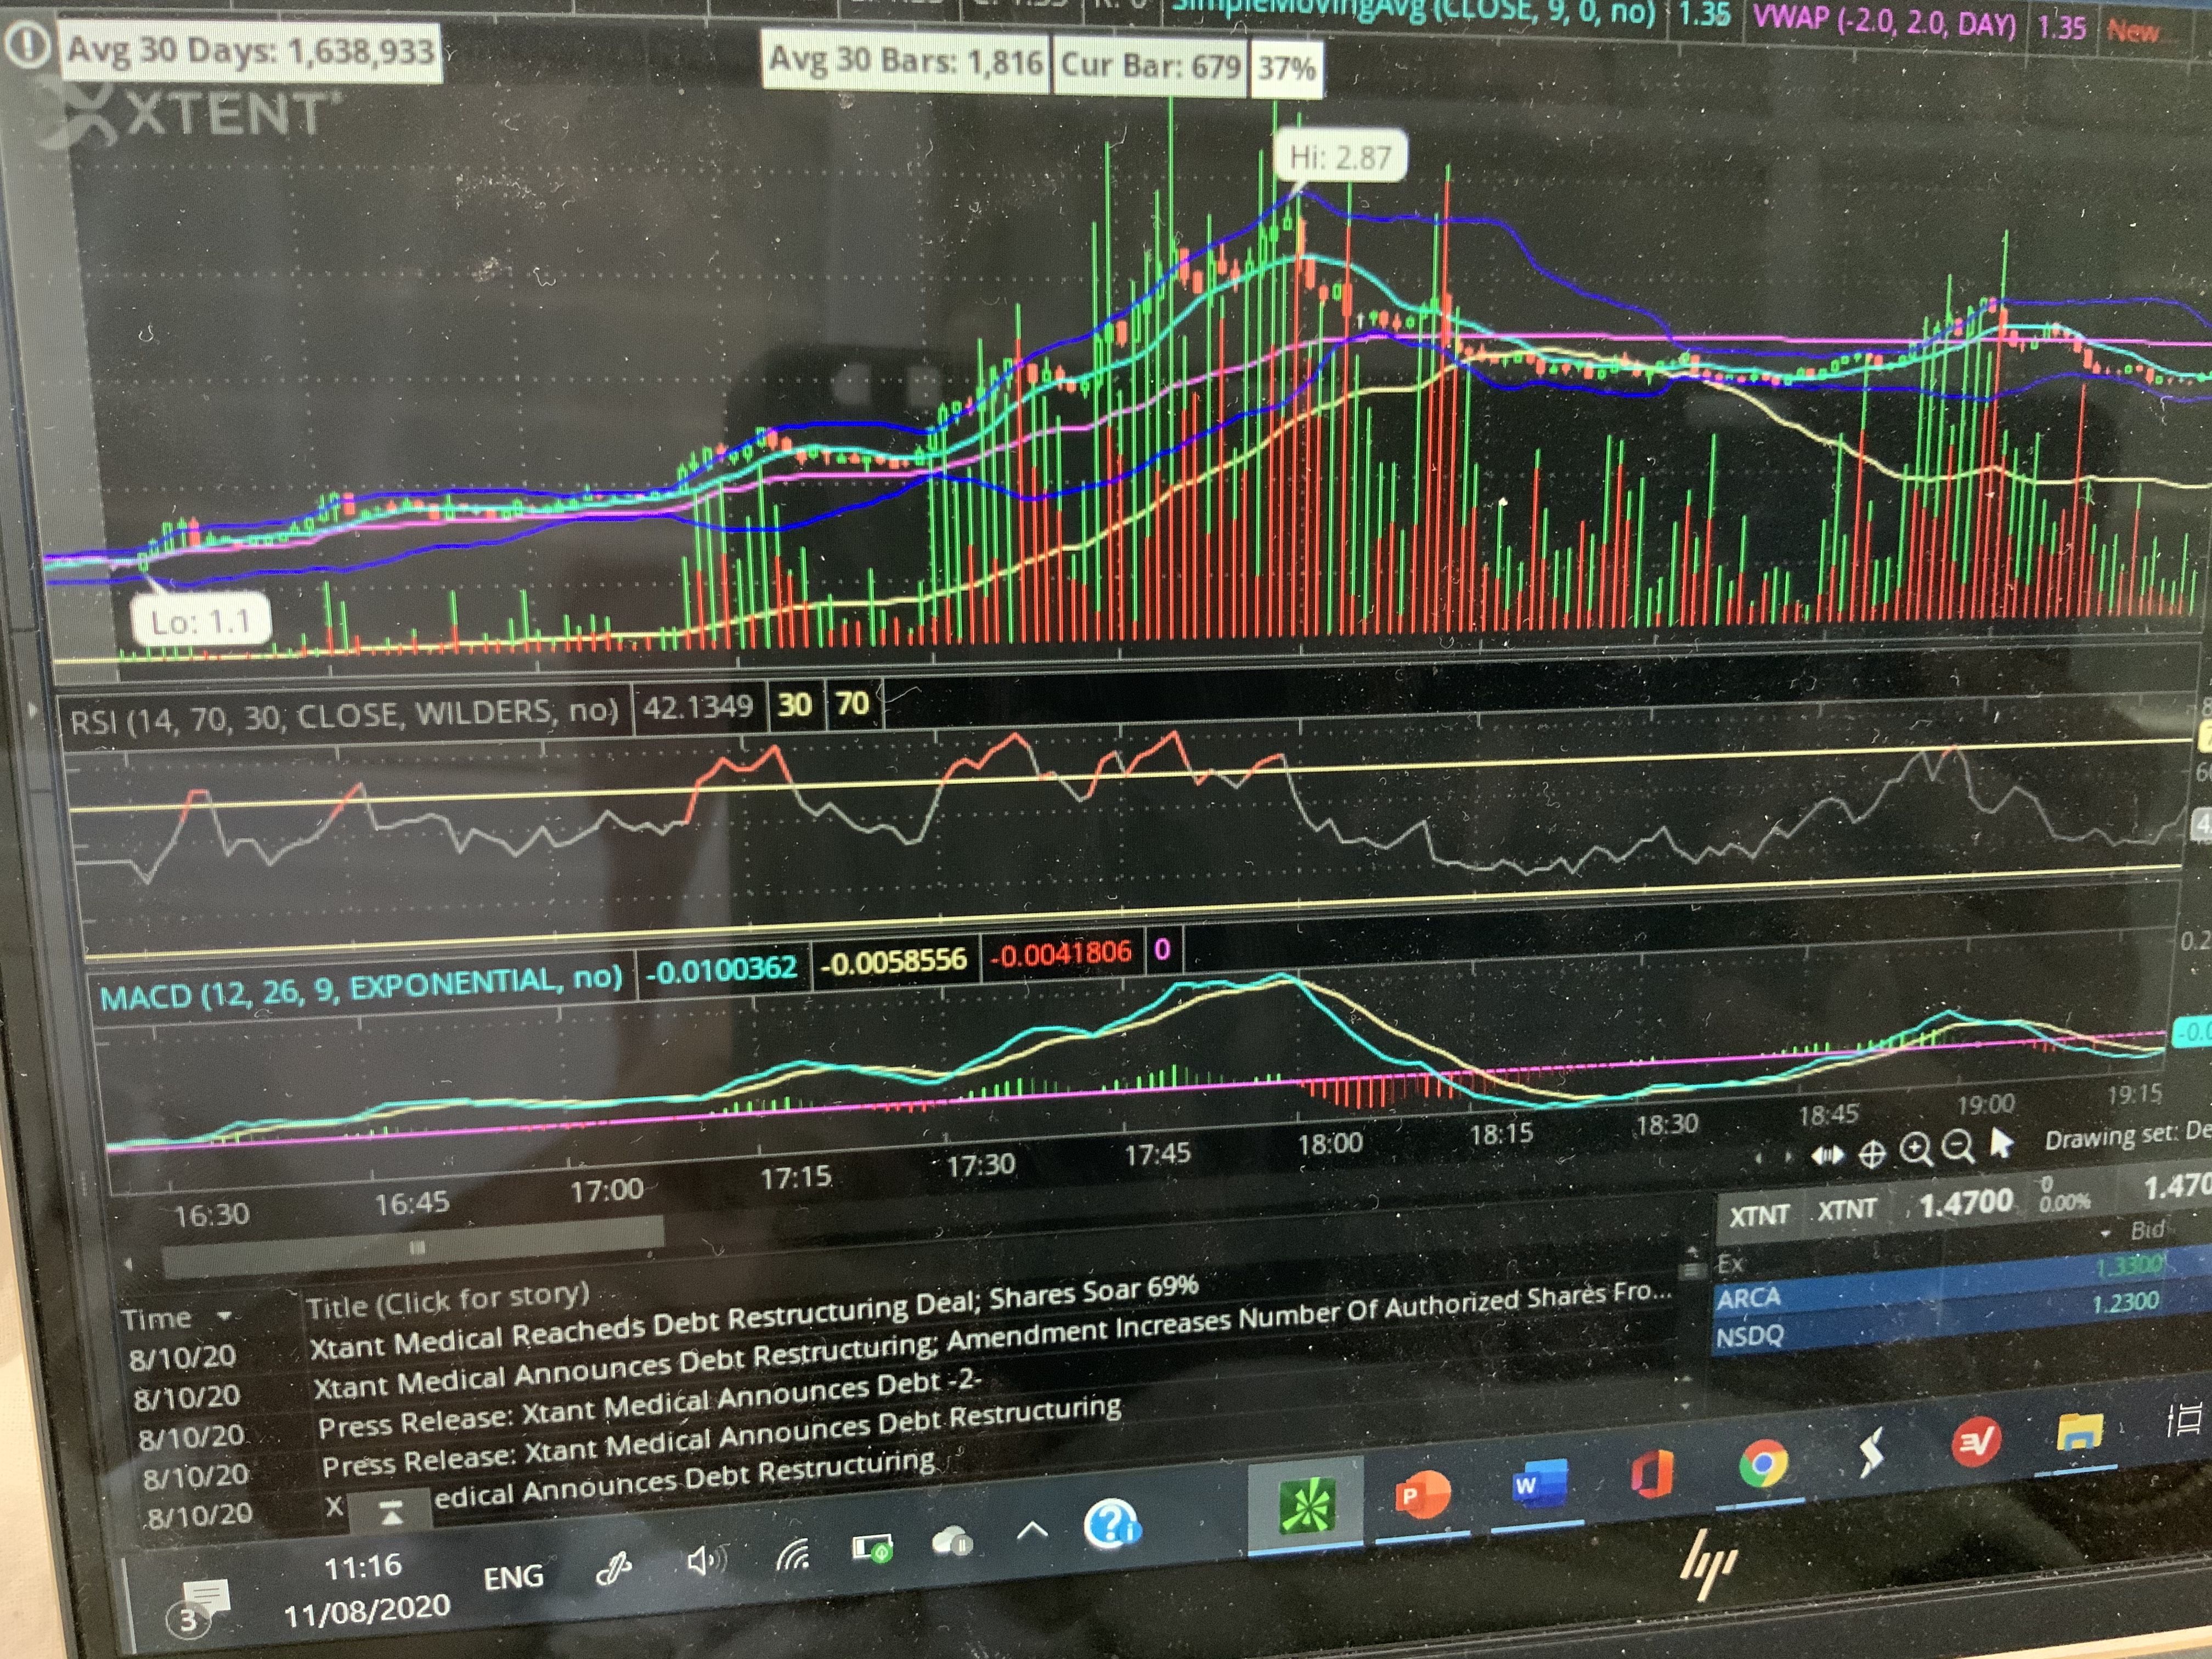
Volume Stats Format, Watchlist, Scan, Label for ThinkOrSwim

@Rango I have seen that code, may be even a later version than you have posted. need to take time to understand how to use it. and the script does most of what I am modifying. As for adjust the time. I think you should leave the script time to market time EST, I live in PST and the time set the way in the script works just fine.

-S
 

Join useThinkScript to post your question to a community of 21,000+ developers and traders.

Hello, I tried to copy the code and paste it in my TOS and also tried via the link listed in post 1 but both ways I am missing the volume bars as shown in the image below. Am I missing something?
90tUgw.png
 
Hi @3AMBH @SuryaKiranC,

Thanks for the great script.

One issue though, the 30 day average, today, and percentofdayavg, can't be displayed for /RTY, it works with most other symbols I tested: /ES /NQ AAPL even /M2K . Not working only for /RTY. Any idea why? Maybe it's due to some the inherent data issue from TOS for /RTY.
 
Thinking out loud here, was wondering which one of the following is a better way of calculating Average?
I am trying to do a average of 30 day and 30 bar, I pass this via variable declaration length.

P.S : both methods are working and getting me the same results. Why am I asking, coz when I am asking, was wondering if we should track the change in Average volume day after day too, and thinking of t

Current Code:
def VolDayAvg = (fold index = 1 to length + 1 with Avg = 0 do (Avg + volume(period = "DAY")[index])) / length;
def AvgBars = (fold index2 = 1 to length + 1 with Bar = 0 do (Bar + volume[index2])) / length;

New Code:
def aVol = Average(volume(period = "DAY")[1], length);
def bVol = Average(volume[1], length);

@BenTen @zeek @tomsk @3AMBH
 
Hi @3AMBH @SuryaKiranC,

Thanks for the great script.

One issue though, the 30 day average, today, and percentofdayavg, can't be displayed for /RTY, it works with most other symbols I tested: /ES /NQ AAPL even /M2K . Not working only for /RTY. Any idea why? Maybe it's due to some the inherent data issue from TOS for /RTY.

WOW, I have noticed that too, can't say for sure what the problem is but must be the data from TOS. Will check this during market hours with /RTY and check.
 
Hi @SuryaKiranC . Any luck on adding colored sale and total buys to your script.

Btw i found one small issue in code. If you're defining all times in EST then post market is not 1900 but 2000.

So in mine i fixed it. I don't know if you want to fix it but just wanted FYI.

BTW for some reason PostMktVol is no longer working no matter what time and what security. Shows ZERO now.

input PoststartTime = 1600;
input PostendTime = 2000;

Edit:
So i changed input PoststartTime = 1500; and input PostendTime = 2000; and post is working now. Weird that it won't take1600.

Sample of colored bars

50123974396_b968b03971_b.jpg
 
Last edited:
Hello,

I am trying to add a simple dashed line to this study, as you see in the picture I have drawn a "Price Level" for the "Daily Avg" amount. Although, I would love for it to update automatically. I tried scripting it myself but the white line is my failed attempt, I cannot get it to the purple line (the correct volume number). Can anyone help me have a simple dashed line that automatically updates when "Daily Avg" moves up/down? Thanks.

P.S the same script could be applied for the RSI? I have drawn another line at the 50 mark. That would be fixed though not variable like the other.

BJmAhfu.jpg
 
@liightz That pink line was drawn manually through one of your Drawing Toolkit. What would be the condition for the line to be generated and updated automatically?
 
@BenTen Well, the idea is since the "Daily Avg" updates each day due to that days' volume being put into the rotation, I would love for this line to be linked to that data. The white line marks 40M when the correct value should be 10M. Is that what you are asking?out,

Update: I figured it out, I couldn't get a straight line but I got close to what I wanted.
 
Last edited:
Currently checking out @SuryaKiranC @Rango @3AMBH volume scripts and this is so cool.
It offers so much more than TOS Volume indicator for Intraday trading.
Much respect for your insights.

Is it possible to make it even cleaner? "30Day Avg" to "DailyAvg" and remove "rVol" and ADV because it seems redundant, no?
"ADV" is suppose to be the script used to customize the # of days for Average Daily Volume, so is it possible to replace the "30Day Avg" script with the "ADV" script and maintain the "30 Day Avg" aesthetics?
And "rVOL" is basically today's Cumulative Volume divided by the Daily Average (30) Volume, no? Why would it be needed if we have "%" between "Today" and "30Day Avg"

And this is asking too much (so ignore if you feel it's too flashy) -
Is there a way to show Label that compares the "Open1HrVol" to the Average Previous 30 days Open1HrVol?
I'm not sure how we can write the script for TOS to gather that information.


Thanks again. I think volume is one of the most important indicators for price movement.

Code:
declare on_volume;

input length = 30;
input ShowDayAvg = yes;
input ShowTodayVolume = yes;
input ShowPercentOfDayAvg = yes;
input UnusualVolumePercent = 200;
input ShowBarAvg = yes;
input ShowCurrentBar = yes;


def VolDayAvg = (fold index = 1 to length + 1  with Avg = 0 do (Avg + volume(period = "DAY")[index])) / length;
def AvgBars = (fold index2 = 1 to length + 1 with Bar = 0  do (Bar + volume[index2])) / length;

def Today = volume(period =  "DAY");
def PercentOfDayAvg = Round((Today / VolDayAvg) * 100, 0);

def CurVol = volume;


def offset = 1;
def ADV = Average(volume, length)[offset];
def rVol = volume / ADV;

# Labels

AddLabel(ShowDayAvg, length + "Day Avg: " + Round(VolDayAvg, 0) + "  ", Color.LIGHT_GRAY);
AddLabel(ShowTodayVolume, "Today: " + Today + " ", (if PercentOfDayAvg >= UnusualVolumePercent then Color.GREEN else if PercentOfDayAvg >= 100 then Color.ORANGE else Color.LIGHT_GRAY));
AddLabel(ShowPercentOfDayAvg, PercentOfDayAvg + "%", (if PercentOfDayAvg >= UnusualVolumePercent then Color.GREEN else if PercentOfDayAvg >= 100 then Color.ORANGE else Color.WHITE) );
AddLabel(ShowBarAvg, "Avg" + length  + "Bars: " + Round(AvgBars, 0) + " ", Color.LIGHT_GRAY);
AddLabel(ShowCurrentBar, "Cur Bar: " + CurVol + " ", (if CurVol >= AvgBars then Color.GREEN else Color.ORANGE));

AddLabel(yes, "rVol :" + Round(rVol, 2));
AddLabel(yes, "ADV :" + ADV);
#AddLabel(yes, asPercent(rVol)); # remove "#" infront of Addlabels to select prefer choice
#AssignPriceColor(if rVol >= 1 then color.dark_red else if rVol <=.5 then Color.black else color.Gray);


declare hide_on_daily;
input PrestartTime = 0400;
input PreendTime = 0930;

def PreMkt = SecondsFromTime(PrestartTime) >= 0 and SecondsTillTime(PreendTime) >= 0;
def PreVolMins = if PreMkt and !PreMkt[1] then volume
                else if PreMkt then PreVolMins[1] + volume
                else PreVolMins[1];
AddLabel(1, "PreMktVol = " + PreVolMins + "  ", Color.YELLOW);
# End Volume PreMarket

input startTime = 0930;
input endTime = 1030;

def Active = SecondsFromTime(startTime) >= 0 and SecondsTillTime(endTime) >= 0;
def Vol60Mins = if Active and !Active[1] then volume
                else if Active then Vol60Mins[1] + volume
                else Vol60Mins[1];
AddLabel(1, "Open1HrVol = " + Vol60Mins + "  ", Color.YELLOW);
# End Volume RTH First 60 Mins

input PoststartTime = 1600;
input PostendTime = 1900;

def PostMkt = SecondsFromTime(PoststartTime) >= 0 and SecondsTillTime(PostendTime) >= 0;
def PostVolMins = if PostMkt and !PostMkt[1] then volume
                else if PostMkt then PostVolMins[1] + volume
                else PostVolMins[1];
AddLabel(1, "PostMktVol = " + PostVolMins + "  ", Color.YELLOW);


sVQjS32.png
 
@Rango , Buy vs Sell Volume with colored histogram implemented for lower study. Code clean up, Average calculations changed for greater good. And for Pre/Post I don't see any problem with my TOS set to PST and the code using EST. if you are still seeing a problem, let's talk and see where the problem is.

@jngy2k , Code is cleaned up a bit. Still keeping rVol for those who are used to trading off of it, can be easily turned off by commenting the rVol AddLabel.

New code improvements, Now we can see 5 Days of Volume on 1D charts, each of them compared to their respective 30D Avg and colored "LIME" if they are above 30D avg, and Colored "GREEN" if they are above 30D Avg and previous day.

Pre/Post/1RTH are shown by default only in lower timeframes, ex: 1m, 5m, 15, and 1H, 2H and 4H.

khl1FGx.png


Code:
# Volume Labels
# Version 1.4
# Created: 06/23/20 # Modified 08/09/2020
# Modified by: Surya Kiran C ## Included rVolume label and Changed length as input. ## Additionally Pre-Market, 1Hr Volume, AfterHour, 5 Day Volume labels are added.


declare on_volume; # Decalared on_volume, if you need to use only labes as a top study comment # Selling Volume # & # Buying Volume # along with this line.

input length = 30;
input ShowDayAvg = yes;
input ShowTodayVolume = yes;
input PreviousDayVolume = no;
input ShowPercentOfDayAvg = yes;
input UnusualVolumePercent = 200;
input ShowBarAvg = yes;
input ShowCurrentBar = yes;

input PreMktVol = yes;
input RTH1HrVol = yes;
input PostMktVol = yes;

def VolDayAvg = Average(volume(period = "DAY")[1], length);
def AvgBars = Average(volume[1], length);

def Vol1 = volume(period = "DAY")[1];
def Vol2 = volume(period = "DAY")[2];
def Vol3 = volume(period = "DAY")[3];
def Vol4 = volume(period = "DAY")[4];
def Vol5 = volume(period = "DAY")[5];

def VolDayAvg1 = VolDayAvg[1];
def VolDayAvg2 = VolDayAvg[2];
def VolDayAvg3 = VolDayAvg[3];
def VolDayAvg4 = VolDayAvg[4];

def Vol = volume(period = "DAY");
def CurVol = volume;

def rVol = Vol / VolDayAvg;
def PercentOfDayAvg = Round((rVol * 100),2);

############### Buying and Selling Volume Study
###############
#DPL CRITERIA #
###############
input Audible_Alert = yes;
def Deviation_Length = 60;
def Deviate = 2;
def volumestdev = RelativeVolumeStDev(length = Deviation_Length);
def abovedev = volumestdev >= Deviate;
def belowdev = volumestdev <= Deviate;

############
# DPL BARS #
############
def increase = volume > volume[1];
def devincrease = increase and abovedev;
def decrease = volume < volume[1];
def devdecrease = decrease and abovedev;

##############################
# UPTICK / DOWNTICK CRITERIA #
##############################
def O = open;
def H = high;
def C = close;
def L = low;
def V = volume;
def Buying = V * (C - L) / (H - L);
def Selling = V * (H - C) / (H - L);

##################
# Selling Volume #
##################
plot SV = Selling;
SV.DefineColor("Decrease", Color.DARK_RED);
SV.DefineColor("DevDecrease", Color.LIGHT_RED);
SV.AssignValueColor(if devdecrease then SV.Color("DevDecrease") else SV.Color("Decrease"));
SV.SetPaintingStrategy(PaintingStrategy.HISTOGRAM);
SV.HideTitle();
SV.HideBubble();
SV.SetLineWeight(5);

#################
# Buying Volume #
#################
plot BV = Buying;
BV.DefineColor("Increase", Color.DARK_GREEN);
BV.DefineColor("DevIncrease", Color.GREEN);
BV.AssignValueColor(if devincrease then BV.Color("DevIncrease") else BV.Color("Increase"));
BV.SetPaintingStrategy(PaintingStrategy.HISTOGRAM);
BV.HideTitle();
BV.HideBubble();
BV.SetLineWeight(5);

#################
#  Volume %     #
#################
def totVol = Round(Buying, 0) + Round(Selling, 0) ;
def buyPercent  = ( Round(Buying, 0)  / totVol ) * 100;
def sellPercent = ( Round(Selling, 0) / totVol ) * 100;

########################
# Adding Volume Labels #
########################
input Show_Labels = yes;
AddLabel(Show_Labels, "Buy: " + Round(Buying, 0)+"  "+Round(buyPercent,2)+ " %", if Buying > Selling then color.green else color.red);
AddLabel(Show_Labels, "Sell: " + Round(Selling, 0)+" "+Round(sellPercent,2)+ " %", if Selling > Buying then color.green else color.red);

######################## End of Buying & Selling Labels Study

########################
# Labels
########################
AddLabel(ShowDayAvg, length+ "DAvg: " + Round(VolDayAvg, 0) + "  ", Color.LIGHT_GRAY);
AddLabel(if GetAggregationPeriod() >= AggregationPeriod.DAY then 1 else if PreviousDayVolume then 1 else 0, "Day4: "+ Vol4 + " ", (if Vol4 >= VolDayAvg4 and Vol5 then Color.GREEN else if Vol4 >= Vol5 then Color.LIME else Color.RED));
AddLabel(if GetAggregationPeriod() >= AggregationPeriod.DAY then 1 else if PreviousDayVolume then 1 else 0, "Day3: "+ Vol3 + " ", (if Vol3 >= VolDayAvg3 and Vol4 then Color.GREEN else if Vol3 >= Vol4 then Color.LIME else Color.RED));
AddLabel(if GetAggregationPeriod() >= AggregationPeriod.DAY then 1 else if PreviousDayVolume then 1 else 0, "Day2: "+ Vol2 + " ", (if Vol2 >= VolDayAvg2 and Vol3 then Color.GREEN else if Vol2 >= Vol3 then Color.LIME else Color.RED));
AddLabel(if GetAggregationPeriod() >= AggregationPeriod.DAY then 1 else if PreviousDayVolume then 1 else 0, "Day1: "+ Vol1 + " ", (if Vol1 >= VolDayAvg1 and Vol2 then Color.GREEN else if Vol1 >= Vol2 then Color.LIME else Color.RED));
AddLabel(ShowTodayVolume,  "Day: "+ Vol + " ", (if PercentOfDayAvg >= UnusualVolumePercent then Color.GREEN else if PercentOfDayAvg >= 100 then Color.LIME else Color.RED));
AddLabel(ShowPercentOfDayAvg, PercentOfDayAvg + "%", (if PercentOfDayAvg >= UnusualVolumePercent then Color.GREEN else if PercentOfDayAvg >= 100 then Color.LIME else Color.WHITE) );
AddLabel(ShowBarAvg, "Avg" + length  + "Bars: " + Round(AvgBars, 0) + " ", Color.LIGHT_GRAY);
AddLabel(ShowCurrentBar, "Cur Bar: " + CurVol + " ", (if CurVol >= AvgBars then Color.GREEN else Color.LIME));
AddLabel(yes, "rVol :" + Round(rVol, 2), (if rVol >= 2 then Color.GREEN else if rVol > 1 then Color.LIME else Color.WHITE));


###########################
#Pre, 1Hr RTH, AfterHours Volumes.
###########################
input PrestartTime = 0400;
input PreendTime = 0930;

def PreMkt = SecondsFromTime(PrestartTime) >= 0 and SecondsTillTime(PreendTime) >= 0;
def PreVolMins = if PreMkt and !PreMkt[1] then volume
                else if PreMkt then PreVolMins[1] + volume
                else PreVolMins[1];
AddLabel(if GetAggregationPeriod() >= AggregationPeriod.DAY then 0 else if PreMktVol then 1 else 0, "PreMktVol = " + PreVolMins + "  ", Color.YELLOW);
# End Volume PreMarket

input RTH1HrstartTime = 0930;
input RTH1HrendTime = 1030;

def RTH1Hr = SecondsFromTime(RTH1HrstartTime) >= 0 and SecondsTillTime(RTH1HrendTime) >= 0;
def RTH1HrMins = if RTH1Hr and !RTH1Hr[1] then volume
                else if RTH1Hr then RTH1HrMins[1] + volume
                else RTH1HrMins[1];
AddLabel(if GetAggregationPeriod() >= AggregationPeriod.DAY then 0 else if RTH1HrVol then 1 else 0, "RTH1HrVol = " + RTH1HrMins + "  ", Color.YELLOW);
#End Volume RTH First 60 Mins

input PoststartTime = 1600;
input PostendTime = 2000;

def PostMkt = SecondsFromTime(PoststartTime) >= 0 and SecondsTillTime(PostendTime) >= 0;
def PostVolMins = if PostMkt and !PostMkt[1] then volume
                else if PostMkt then PostVolMins[1] + volume
                else PostVolMins[1];
AddLabel(if GetAggregationPeriod() >= AggregationPeriod.DAY then 0 else if PostMktVol then 1 else 0, "PostMktVol = " + PostVolMins + "  ", Color.YELLOW);
# End Volume PostMarket
 
Last edited:
Hi SuryaKiranC,

Appreciate if you could take a look and let TOS know exactly which part of the data is problematic. Thanks.

WOW, I have noticed that too, can't say for sure what the problem is but must be the data from TOS. Will check this during market hours with /RTY and check.
 
Hi SuryaKiranC,

Appreciate if you could take a look and let TOS know exactly which part of the data is problematic. Thanks.
It is at the Average(volume(period = "DAY")[1], length); that is not working. any formula we use, this is where it is failing perhaps Volume above 30 days itself could be failing. will try to find out exactly what is failing a bit later.
 
It is at the Average(volume(period = "DAY")[1], length); that is not working. any formula we use, this is where it is failing perhaps Volume above 30 days itself could be failing. will try to find out exactly what is failing a bit later.


Thinks I found it, for some reason 26th day volume is missing. Try the length as 25 or even 21, you can find it in properties don't have to edit code.

Fell free to report this to TD Ameritrade folks. @wlkon
 
Last edited:
2 questions please.

1) on the picture I added here, how can I reduce the volume bars on the chart?
** I don’t want to take it to the down Section, just that the volume bars will stay on the same box, and just to reduce the body bars size at least 50-60%.. how can I do it?
ShiM1DG.jpg


2) somone knows about code to volume bars just in colors of red and green?

ty very much for all,

idan :)
 

Similar threads

Not the exact question you're looking for?

Start a new thread and receive assistance from our community.

87k+ Posts
336 Online
Create Post

Similar threads

Similar threads

The Market Trading Game Changer

Join 2,500+ subscribers inside the useThinkScript VIP Membership Club
  • Exclusive indicators
  • Proven strategies & setups
  • Private Discord community
  • ‘Buy The Dip’ signal alerts
  • Exclusive members-only content
  • Add-ons and resources
  • 1 full year of unlimited support

Frequently Asked Questions

What is useThinkScript?

useThinkScript is the #1 community of stock market investors using indicators and other tools to power their trading strategies. Traders of all skill levels use our forums to learn about scripting and indicators, help each other, and discover new ways to gain an edge in the markets.

How do I get started?

We get it. Our forum can be intimidating, if not overwhelming. With thousands of topics, tens of thousands of posts, our community has created an incredibly deep knowledge base for stock traders. No one can ever exhaust every resource provided on our site.

If you are new, or just looking for guidance, here are some helpful links to get you started.

What are the benefits of VIP Membership?
VIP members get exclusive access to these proven and tested premium indicators: Buy the Dip, Advanced Market Moves 2.0, Take Profit, and Volatility Trading Range. In addition, VIP members get access to over 50 VIP-only custom indicators, add-ons, and strategies, private VIP-only forums, private Discord channel to discuss trades and strategies in real-time, customer support, trade alerts, and much more. Learn all about VIP membership here.
How can I access the premium indicators?
To access the premium indicators, which are plug and play ready, sign up for VIP membership here.
Back
Top