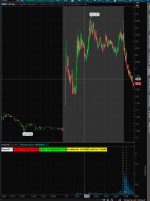
Volume Stats Format, Watchlist, Scan, Label for ThinkOrSwim

@SuryaKiranC
So the post on float rotation the script works around the problem of obtaining float data from TOS by manually inputing float by the user.
Pretty clever. But not perfect.
There is some error I receive with charting.
The indicator doesn't function on any other chart than the 1m chart.
Any work around to this if it can be fixed to work with 3m, 5m, 10m, chart etc. ??
Code:
def Today = volume(period = "DAY");
input Float = 10000000;
def V = if Today then volume(period = aggregationPeriod.MIN) else 0;
def TVol = TVol[1] + V;
def nodes = (TVol) % Float;

AddVerticalLine(nodes < nodes[1], CONCAT("Float Rotated: ", CONCAT(round(TVol / float, 0), "")) , Color.WHITE, Curve.SHORT_DASH);

AddLabel (yes, ("Float: ")+ Round(Float * .000001, 1) + "M", Color.White);

AddLabel (yes, ("T.Vol: ")+ Round(Today * .000001, 2) + "M", Color.White);

Addlabel (yes, ("Float RT: x")+ Round(Today/float, 0), if nodes < 0 then color.WHITE else Color.RED);

plot Data = close;
Shout out to @zeek for coming up with this edge before I did.
MSzwooH.png
 
@zeek I See your point, but you would have to do it per ticker everytime you change the chart. Do you a good site where I can gather this data for all S&P 500 stock? Let me start with that, If I can dump that data, I could code it in and keep updating my source periodically.

-S
 
@SuryaKiranC It's not necessary to depend on one database when float from any source may sometimes be off.
I usually pick it up from reading the SEC filings looking for dilution which is the most accurate.
But is it possible to script the indicator to work on 2 mins, 5mins charts as well?
I think the solution will be similar to Volume indicator when inputing "volstatsperiod" time frame of the volume manually in the settings.
 
Last edited:
I tried and it don't work. I can only get the 1 min chart to work.
Trying to get it to work on 1d:1min, 1d:3min, 1d:5min, 1d:10min, 1d:15min, 1d:30min.

The problem is I can't get AggregationPeriod to be user defined.
Code:
def V = if Today then volume(period = aggregationPeriod.VolstatsPeriod) else 0;

Not sure of the workaround.

I have this so far:

Code:
input Float = 10000000;
input ShowHigherVolStats = yes;
input VolStatsPeriod = AggregationPeriod.MIN;

def Today = volume(period = "day");
def V = if Today then volume(period = aggregationPeriod.min) else 0;
def DVol = DVol[1] + V;
def nodes = (DVol) % Float;

AddVerticalLine(nodes < nodes[1], CONCAT("Float RT: ", CONCAT(round(DVol / float, 0), "")) , Color.WHITE, Curve.SHORT_DASH);


AddLabel (if GetAggregationPeriod() >= VolStatsPeriod then 0 else if ShowHigherVolStats then 1 else 1, (if VolStatsPeriod == AggregationPeriod.FOUR_HOURS then "4H" else if VolStatsPeriod == AggregationPeriod.TWO_HOURS then "2H" else if VolStatsPeriod == AggregationPeriod.HOUR then "60m"else if VolStatsPeriod == AggregationPeriod.THIRTY_MIN then "30m" else if VolStatsPeriod == AggregationPeriod.TWENTY_MIN then "20m" else if VolStatsPeriod  == AggregationPeriod.FIFTEEN_MIN then "15m" else if VolStatsPeriod == AggregationPeriod.TEN_MIN then "10m" else if VolStatsPeriod == AggregationPeriod.FIVE_MIN then "5m" else if VolStatsPeriod == AggregationPeriod.FOUR_MIN then "4m" else if VolStatsPeriod  == AggregationPeriod.THREE_MIN then "3m" else if VolStatsPeriod == AggregationPeriod.TWO_MIN then "2m" else if VolStatsPeriod  == AggregationPeriod.MIN then "1m" else "")+ " FloatRT: " + Round(Today/float, 0), if nodes < 0 then color.LIGHT_GRAY else Color.WHITE);


plot Data = close;
 
Last edited:
HOLY MOLEY I think I got it to work.
Only took my whole day of figuring it out.
o_O

Code:
input Float = 10000000;
input ShowHigherVolStats = yes;
input VolStatsPeriod = AggregationPeriod.MIN;

def Today = volume(period = "day");
def V = if Today then volume(period =  VolstatsPeriod) else 0;
def DVol = DVol[1] + V;
def nodes = (DVol) % Float;

AddVerticalLine(nodes < nodes[1], CONCAT("Float RT: ", CONCAT(round(DVol / float, 0), "")) , Color.WHITE, Curve.SHORT_DASH);


AddLabel (if GetAggregationPeriod() >= VolStatsPeriod then 0 else if ShowHigherVolStats then 1 else 1, (if VolStatsPeriod  == AggregationPeriod.DAY then "D" else if VolStatsPeriod == AggregationPeriod.FOUR_HOURS then "4H" else if VolStatsPeriod == AggregationPeriod.TWO_HOURS then "2H" else if VolStatsPeriod == AggregationPeriod.HOUR then "60m"else if VolStatsPeriod == AggregationPeriod.THIRTY_MIN then "30m" else if VolStatsPeriod == AggregationPeriod.TWENTY_MIN then "20m" else if VolStatsPeriod  == AggregationPeriod.FIFTEEN_MIN then "15m" else if VolStatsPeriod == AggregationPeriod.TEN_MIN then "10m" else if VolStatsPeriod == AggregationPeriod.FIVE_MIN then "5m" else if VolStatsPeriod == AggregationPeriod.FOUR_MIN then "4m" else if VolStatsPeriod  == AggregationPeriod.THREE_MIN then "3m" else if VolStatsPeriod == AggregationPeriod.TWO_MIN then "2m" else if VolStatsPeriod  == AggregationPeriod.MIN then "1m" else "")+ " FloatRT: " + Round(Today/float, 0), if nodes < 0 then color.LIGHT_GRAY else Color.WHITE);


plot Data = close;
 
@jngy2k important thing is you figured it out. Was saying define a variable like below. so the script is dynamic and works on all charts.

def aP = GetAggregationPeriod();
def Today = volume(period = aP );
 
Great Script. Is it possible to add "show percent of day avg" relative to PreMktVol. Essentially I want to use pre-market volume % of 90 day average volume as a gauge of strenght or weakness before market open. I've added the following script but I'm missing something; help needed.

def PercentOfDayAvg = Round((PreMktVol/ VolDayAvg) * 100, 0);
 
@SuryaKiranC (y) much simpler. it took me a whole day figuring the long way lol.
so with your shortcut and not having to go to back and forth
to the indicator page when changing chart times it will look like this:

input float = 10000000;
def aP = GetAggregationPeriod();
def Today = volume(period = aP );
def V = if Today then volume(period = aP) else 0; <= I changed period=aggregationPeriod.MIN to period=aP so it will chart in 3min,5min,etc
def DVol = DVol[1] + V;
def nodes = (DVol) % Float;
AddVerticalLine(nodes < nodes[1], CONCAT("Float RT: ", CONCAT(round(DVol / float, 0), "")) , Color.WHITE, Curve.SHORT_DASH);
Addlabel (yes, ("Float RT: ")+ Round(Today/float, 0), if nodes < 0 then color.YELLOW else Color.WHITE);
plot Data = close;

edit: I'm experiencing problems with the code.
1a) the AddVerticalLine - displays wrong float#. example: the first line will show 2 instead of 1.
1b) the AddVerticalLine - shifts from one time to different time when changing chart time. example: in 10min chart 9:40am but in 5min chart 9:50am
2a) the Float Addlabel does not show Float rotation number and remains at 0 when AddVerticalline are drawn.
2b) the Float Addlabel does not change color.

Help?
 
@jngy2k never mind about the the lowfloat ticker picked up one from your screenshot.

Here is as far as I could go. Still need to manually put in the float, but instead of as an input parameter, which will kind of become useless, if you want to use this as a scanner, you can edit the source and key in the float for each ticker you care about and save the script. look at the piece of code in the bottom, "Float = ", followed by each ticker that you care about and the respective float values.

Code:
#Float_RotationSTUDY.ts
#Author SuryaKiranC 
#Draws a White Horizontal Line every time the entire float of a stock is sold on your chart timeFrame.  

declare on_volume;

def Float;
def aP = GetAggregationPeriod();
def Today = volume(period = "DAY");
def V = if Today then volume(period = aP) else 0;
def TVol = TVol[1] + V;
def nodes = (TVol) % Float;

AddVerticalLine(nodes < nodes[1], Concat("Float Rotated: ", Concat(Round(TVol / float, 0), "")) , Color.WHITE, Curve.SHORT_DASH);
AddLabel (Float, ("Float: ") + Round(Float * .000001, 2) + " M ", Color.WHITE);
AddLabel (Float, ("Float RT: x") + Round(Today / float, 2), if nodes < 0 then Color.WHITE else Color.RED);

#Float Values need to be provided in the below format Source for Float data is Stockbot (Discord Bot) 

Float=
if GetSymbol() == "JNCE" then 16429449 else
if GetSymbol() == "DIT" then 143160 else
if GetSymbol() == "DJCO" then 1005609 else
if GetSymbol() == "VRTA" then 1006025 else
if GetSymbol() == "AXR" then 3654459 else
if GetSymbol() == "TSLA" then 741015516 else
if GetSymbol() == "NVDA" then 590646696 else
if GetSymbol() == "TWTR" then 760550457 else
if GetSymbol() == "FB" then 2378308967 else
if GetSymbol() == "AAPL" then 17086047395 else
if GetSymbol() == "AMZN" then 425760507 else
if GetSymbol() == "NFLX" then 432269673 else
if GetSymbol() == "GOOG" then 289106942 else
if GetSymbol() == "SHOP" then 107624688 else
if GetSymbol() == "SPOT" then 123634771 else
if GetSymbol() == "ROKU" then 105527159 else
if GetSymbol() == "DIS" then 1803978963 else
if GetSymbol() == "WMT" then 1389926724 else
if GetSymbol() == "TGT" then 499011517 else
if GetSymbol() == "HD" then 1075371699 else
if GetSymbol() == "ENPH" then 116202773 else
if GetSymbol() == "MSFT" then 7455013097 else
if GetSymbol() == "AAL" then 502456205 else
if GetSymbol() == "BA" then 563481534 else
if GetSymbol() == "DAL" then 635627690 else
if GetSymbol() == "UAL" then 290085732 else
if GetSymbol() == "LVU" then 587623408 else
if GetSymbol() == "VMW" then 78838275 else
if GetSymbol() == "DELL" then 245785769 else
if GetSymbol() == "ADBE" then 477079606 else
if GetSymbol() == "CRM" then 875784910 else
if GetSymbol() == "NOW" then 190024891 else
if GetSymbol() == "CMG" then 27575019 else
if GetSymbol() == "BYND" then 35438304 else
if GetSymbol() == "KO" then 4266334099 else
if GetSymbol() == "PEP" then 1379751949 else
if GetSymbol() == "SBUX" then 1166559128 else
if GetSymbol() == "CPB" then 201349701 else
if GetSymbol() == "TSN" then 286732593 else
if GetSymbol() == "UNH" then 944699557 else
if GetSymbol() == "ATVI" then 759515101 else
if GetSymbol() == "TTWO" then 113110542 else
if GetSymbol() == "EA" then 287300743 else
if GetSymbol() == "GME" then 485134183 else
if GetSymbol() == "TWLO" then 134379827 else
if GetSymbol() == "AMD" then 1112803420 else
if GetSymbol() == "INTC" then 4251413631 else
if GetSymbol() == "AVGO" then 392589268 else
if GetSymbol() == "TXN" then 914419869 else
if GetSymbol() == "TSM" then 5185493973 else
if GetSymbol() == "QCOM" then 1127103369 else
if GetSymbol() == "AMAT" then 909457258 else
if GetSymbol() == "MU" then 1109043529 else
if GetSymbol() == "NTAP" then 221383608 else
if GetSymbol() == "RNG" then 76205145 else
if GetSymbol() == "ZM" then 173994270 else
Double.NaN;
 
Last edited:
@SuryaKiranC Wow looks good. Lots of hard work pays off.
Today before market open I was using the volume indicator together with float and there is a problem with premarket data for both.
For volume indicator the premarket data changes from smaller number to larger on higher time frames 1min>3min>5min for the day.
I noticed this when the float indicator was not showing label for the premarket.
I changed your float code to input because companies change there float all the time by exercising warrants and offerings.
No two websites have the same float for a company.
Also defining aP to aggregation is not necessary when period can be = to aggregation.
However similar to your volume indicator, volume data for float indicator is incorrect on higher time frames.
This is my version of your float code:
input Float = 10000000;
def Today = volume(period = "Day");
def V = if Today then volume(period = GetAggregationPeriod()) else 0;
def DVol = DVol[1] + V;
def nodes = (DVol) % Float;
AddVerticalLine(nodes < nodes[1], Concat(Round(DVol / Float, 0),"") , Color.WHITE, Curve.SHORT_DASH);
AddLabel (yes, "FloatRT: " + Round(Today/Float, 1), if Today < Float then Color.YELLOW else Color.WHITE);
plot Data = close;

I'm looking at your premarket code and seeing if there is a work around and applyin it to float indicator as well.
ZtPtub3.png
jyM5CdS.png
 

Attachments

  • ZtPtub3.png
    ZtPtub3.png
    74.2 KB · Views: 399
Last edited:
@jngy2k Yes, I said that but even small tickers they don't change on a daily basis though. When ever they change the code need to be updated (maintained with the float) but what this helps is you can follow along multiple tickers with out inputing for each of them individually.

Float Changes, when there is a major corporate actions like new stock issue/splits or major restricted stock is released. Such as Execs are allowed to sell their options and a lot of it is dumped in the market. Anyways you can modify the script to suite your needs however you prefer.
 
@jngy2k As for the difference in the Pre-MKT volumes, I know what you talking about the difference is due to the current candle not closed.

Ex: when you are in 3 min chart unless the 3 mins are past, the candle is not a close and the current volume is not counted in, may have to do something about it., Where as in 1m charts the 2 additional mins data is there in comparison to you 3mins charts.

Let me know if that explanation makes sense.

volume increases from 1min to 3min. if the candle is not closed then the volume should decrease not increase.
also the buy/sell volumes do not change where premarket and 1st hour volume does.
i believe there is a mistake on how def RTH1HrMins and def PreVolMins are defined with if then volume
 

Join useThinkScript to post your question to a community of 21,000+ developers and traders.

Similar threads

Not the exact question you're looking for?

Start a new thread and receive assistance from our community.

87k+ Posts
230 Online
Create Post

Similar threads

Similar threads

The Market Trading Game Changer

Join 2,500+ subscribers inside the useThinkScript VIP Membership Club
  • Exclusive indicators
  • Proven strategies & setups
  • Private Discord community
  • ‘Buy The Dip’ signal alerts
  • Exclusive members-only content
  • Add-ons and resources
  • 1 full year of unlimited support

Frequently Asked Questions

What is useThinkScript?

useThinkScript is the #1 community of stock market investors using indicators and other tools to power their trading strategies. Traders of all skill levels use our forums to learn about scripting and indicators, help each other, and discover new ways to gain an edge in the markets.

How do I get started?

We get it. Our forum can be intimidating, if not overwhelming. With thousands of topics, tens of thousands of posts, our community has created an incredibly deep knowledge base for stock traders. No one can ever exhaust every resource provided on our site.

If you are new, or just looking for guidance, here are some helpful links to get you started.

What are the benefits of VIP Membership?
VIP members get exclusive access to these proven and tested premium indicators: Buy the Dip, Advanced Market Moves 2.0, Take Profit, and Volatility Trading Range. In addition, VIP members get access to over 50 VIP-only custom indicators, add-ons, and strategies, private VIP-only forums, private Discord channel to discuss trades and strategies in real-time, customer support, trade alerts, and much more. Learn all about VIP membership here.
How can I access the premium indicators?
To access the premium indicators, which are plug and play ready, sign up for VIP membership here.
Back
Top