@Billiebanks By default, your scanner will look for results within the first (latest) bar. There is no need to change anything unless you want to look further back, but that's not your goal.
I’m currently working on creating a pattern scan that will detect a 3 bar play pattern specifically
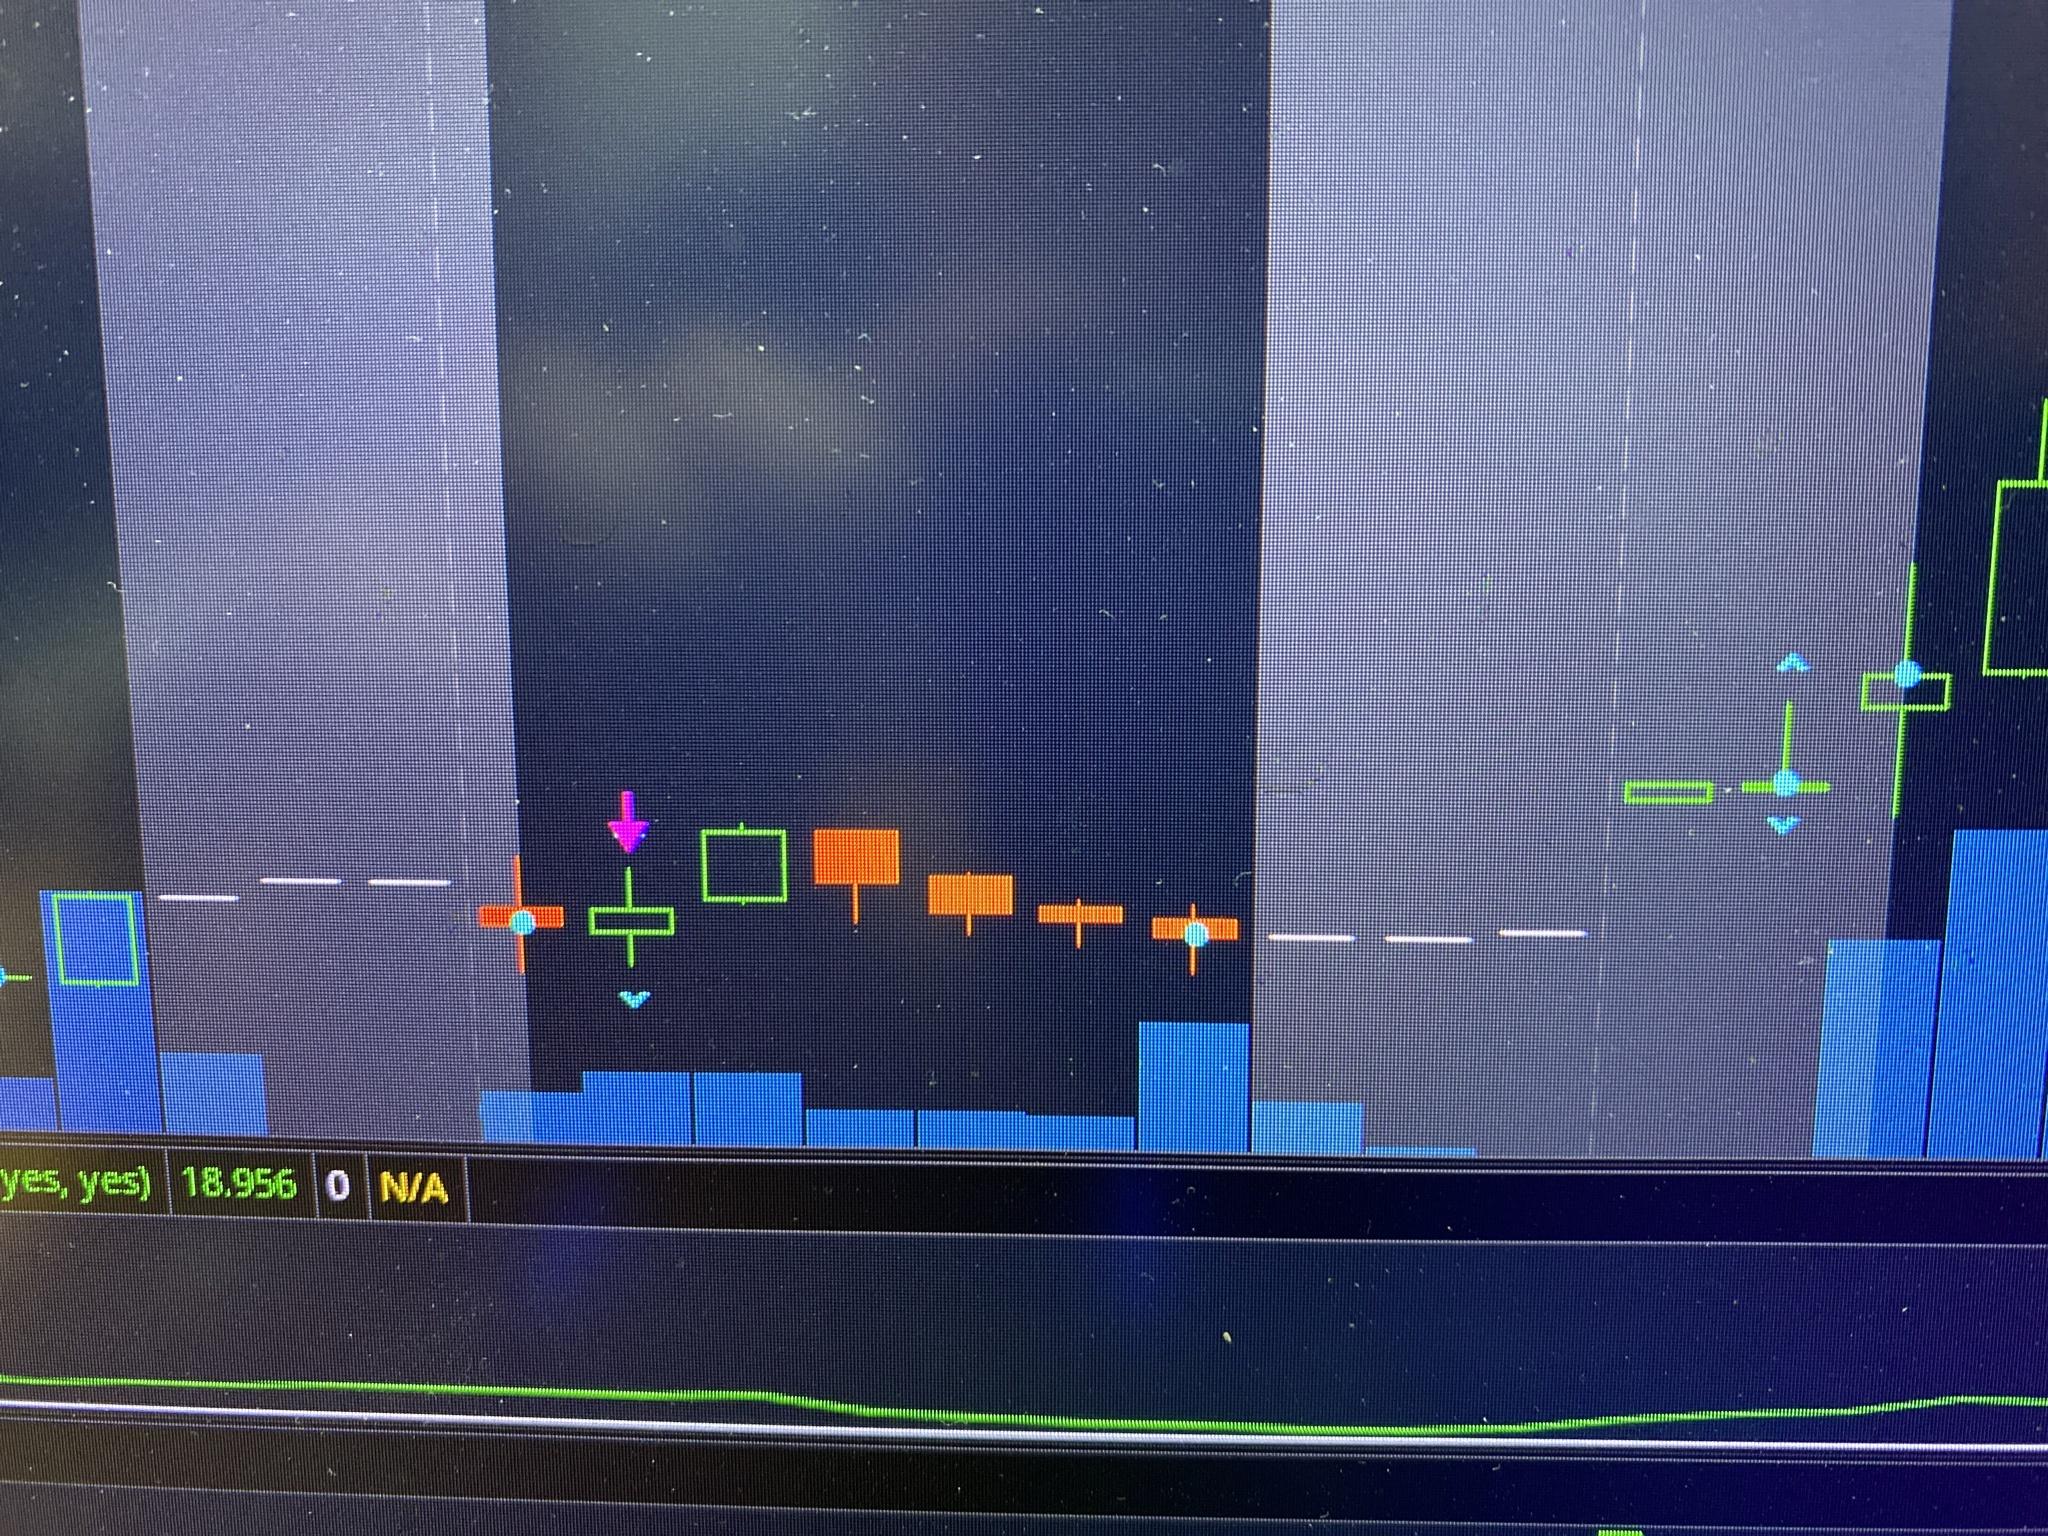
The pattern is described as an unusually long candle body, followed by one or two resting candle bodies
I was formulating based in catching the long igniting bar and the resting bar/bars in between BEFORE the breakout
(Breakout should be followed by a third/fourth long body)
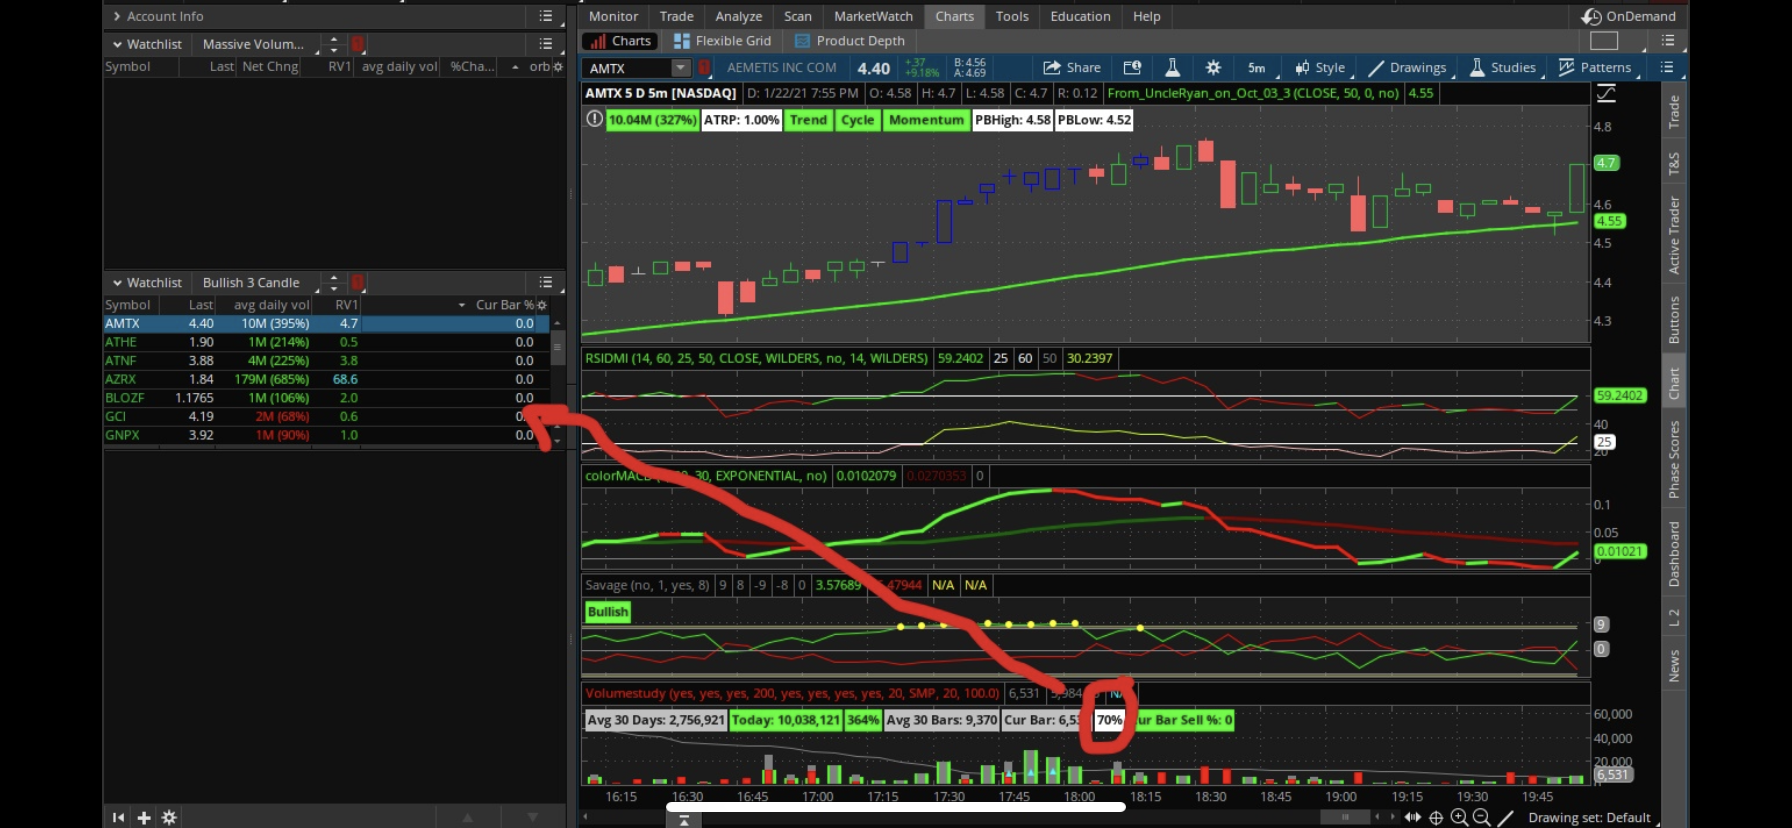
Some of what I’ve worked on so far in pattern thinkscript editor
Sorry I don’t have my laptop with me but
1st bar: up bar - I need to detect the 3x or more volume on this bar only *
2nd bar : multiple bar - where I set parameters
(Low of #1 < open #2)
(Low of #1 < close #2)
(High of #1 greater or equal high #2)
(Open #1 < low #2)
(Low of #1 < low #2)
(Close of #1 greater or equal close #2)
(Open of #1 < open #2)
(Close of #1 greater than or equal high #2)
So I think all I need is the volume identified in the first bar of the pattern as +3x and a possible alert when the last bar breaks the previous high right?
here is the scan so far...
Code:
def IsUp = close > open;
def IsDown = close < open;
def IsDoji = IsDoji();
def avgRange = 0.05 * Average(high - low, 20);
plot PatternPlot =
    IsUp[2] and
    ((Sum(IsUp, 2)[0] >= 0)) and
    high[2] >= Highest(high[0], 2) and
    open[2] < open[1] and
    close[2] >= close[0] and
    close[2] >= Highest(high[0], 2) and
    low[2] < Lowest(low[0], 2) and
    low[2] < close[0] and
    low[2] < open[1] and
    open[2] < Lowest(low[0], 2);
1. i need to get the volume of the bar that STARTS this pattern to be specified as 200-300% volume compared to the previous 20-50-100 bars/ticks
( i would like to be able to change the volume increase percentage and ammt of time its looking back)
2. i would like to make sure the candles that come AFTER the high volume bar do not retrace more than 65% of that first high volume bar if possible
(i would like to be able to adjust retracement %)
here is the pattern scan so far... sorry for spamming im new to this channel
Code:
def IsUp = close > open;
def IsDown = close < open;
def IsDoji = IsDoji();
def avgRange = 0.05 * Average(high - low, 20);
plot PatternPlot =
IsUp[2] and
((Sum(IsUp, 2)[0] >= 0)) and
high[2] >= Highest(high[0], 2) and
open[2] < open[1] and
close[2] >= close[0] and
close[2] >= Highest(high[0], 2) and
low[2] < Lowest(low[0], 2) and
low[2] < close[0] and
low[2] < open[1] and
open[2] < Lowest(low[0], 2);
i need to get the volume of the bar that STARTS this pattern to be specified as 200-300% volume compared to the previous 20-50-100 bars/ticks
( i would like to be able to change the volume increase percentage and ammt of time its looking back)
i would like to make sure the candles that come AFTER the high volume bar do not retrace more than 65% of that beginning bar if possible, that would filter out alot of the false positives
(i would like to be able to adjust retracement % if possible)
seems to be only bringing up patterns that have 2 resting bars, i haven't seen any patterns that have only 1 resting bar i would like it to make sure BOTH 1 and 2 resting bar patterns show in the scan
I have paired that with the increased volume scan to attempt to get the result I'm looking for..
but i would prefer something that can track the candle that starts the pattern above only
Here is that code, i just tweaked to make sure only bullish signals but i like how i can interchange percent and length. how do i get that on the beginning candle of the pattern above????
Here is an extreme volume scanner based on a standard deviation envelope
Code:
# Extreme Volume Scan
# Set to Daily Aggregation

# This script picks up abnormal volume over a period of time. Much more likely to be a large trader taking a position

def v = if isNaN(volume) then v[1] else volume;
def norm = Average(volume, 50);
def SD = StDev(v, 50);
def Upper = norm + SD;
def Lower = norm - SD;
def Extreme = (v - Lower) / (Upper - Lower) * 100;
plot cond = if Extreme > 100 then 1 else 0;
Hello everyone Can knowledgeable people tell you whether it is possible to create a scanner that will show stacks with requests to buyers and sellers say the size of more than 1% of the average daily volume ? Big bid and ask
Hi Ben, I've been using the unusual volume scanner. Thanks! Quick question, is there a way to set up a scan for stocks that have touched their lower bollinger band on the daily with let's say a 3 day look back? Been searching the forums and only found one with a close below. Thanks for all you do!
Hi Ben, I've been using the unusual volume scanner. Thanks! Quick question, is there a way to set up a scan for stocks that have touched their lower bollinger band on the daily with let's say a 3 day look back? Been searching the forums and only found one with a close below. Thanks for all you do!
A 3 day lookback in what timeframe...??? Remember, lookbacks go by bars, not time itself... Therefore you would need to know how many bars back you need to look for that "touch" or crossover...
Hi Ben. Is it possible modify "unusual vol" for scanning ONLY post/pre-markets bar volumes. the idea is compare last and previous post/premarket volumes, and choose shares where is total volume for last bigger than volume on previous?
If this is impossible, may be just count post/pre-market bars, and compare last with previous post/pre-market?
Here is example, as we can see, on last post/premarket we have 5 bars, and only 3 bar on previous. So, is it possible to create scanner which will compare and choose shares where last post/premarket bars will more than on previous? 9:00 bar is not including to calculation
I am looking a high time frame scan, on the weekly chart. Having a bit trouble, hoping someone can help. I am using the IBD Style chart setting from @markosIBD Chart
Wanting to scan for stocks that have higher then normal volume using the Weekly time frame (for both bars and Volume Average).
keep in mind TOS only updates scans about once every 3-7 minutes depending on server load. As a "workaround" I would advise if you want to have better results to make it scan winthin the the last 2 bars which would be 10 minutes that would cover the 3-7 min TD Ameritrade scan delay.
be sure to set for 5 minute aggregation in the scanner Volume in the last 5 minutes is atleast 2000% of the average 50 bars
Code:
#Unusual volume scanner by XeoNoX
#Via usethinkscript.com
#Volume in the last 5 minutes is atleast 2000% of the average 50 bars
#set for 5 minute agreggation
#raw percent value
def percentage = 2000;
#percent in decimal format
def percent_as_decimal = 2000*.01;
#average of last 50 bars
def avgvol =  average(volume,50);
#total volume of last 5 bars
def last5mins = (volume);
#average volume multiplied by desired percentage
def percent_of_avg = avgvol*percent_as_decimal;
# scans for volume is greater than than then 50 minute average by over 2000%
plot scan = last5mins>percent_of_avg;
@XeoNoX Thank you really appreciate it I will keep you posted.
Thank you once again, is there any way to add this into a custom column on a watch list ? for whatever time frame and that shows the percentage of volume?
useThinkScript is the #1 community of stock market investors using indicators and other tools to power their trading strategies. Traders of all skill levels use our forums to learn about scripting and indicators, help each other, and discover new ways to gain an edge in the markets.
How do I get started?
We get it. Our forum can be intimidating, if not overwhelming. With thousands of topics, tens of thousands of posts, our community has created an incredibly deep knowledge base for stock traders. No one can ever exhaust every resource provided on our site.
If you are new, or just looking for guidance, here are some helpful links to get you started.
VIP members get exclusive access to these proven and tested premium indicators: Buy the Dip, Advanced Market Moves 2.0, Take Profit, and Volatility Trading Range. In addition, VIP members get access to over 50 VIP-only custom indicators, add-ons, and strategies, private VIP-only forums, private Discord channel to discuss trades and strategies in real-time, customer support, trade alerts, and much more. Learn all about VIP membership here.
How can I access the premium indicators?
To access the premium indicators, which are plug and play ready, sign up for VIP membership here.