Trust The Levels - Trade Options In ThinkOrSwim

Is you indicator only available to paid subscribers?
When will you release the free version? TIA
 
Last edited by a moderator:

Join useThinkScript to post your question to a community of 21,000+ developers and traders.

The Trust The Levels Grid is available to all members.
It contains several indicators. To import the grid follow the instructions below

Here is the grid link: https://tos.mx/psH8Wtm
Here is how to load grid links:
https://usethinkscript.com/threads/...ed-item-error-in-thinkorswim.5098/#post-57930

If the above workaround for importing shared links is not working for you; it means you are among the group for whom Schwab has not enabled shared links.
Schwab indicates everyone will have shared links enabled after the May 13 integration

@Jessedmanuell @vvvThink @scottlery
 
Last edited:
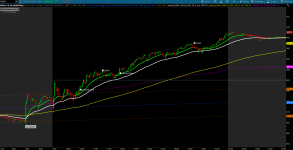
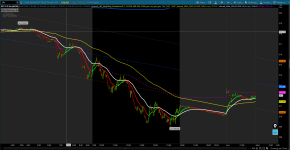
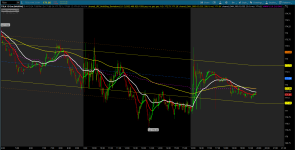
Todays Trades. I made over 1,000.00 but man could I have done so much better. That is trading!
Hope everyone did well today. HAVE A GREAT WEEKEND!
1713553126673.png


1713553319932.png


1713553532161.png
 
Thank you very much for the response. I dont know what's causing it but when I remove price zoom, I could see the 2nd dev yellow lines. They are disappeared for SPY. Here are the screen shots

Appreciate all your help and contribution to this forum.
Thanks again for amazing strategy. Will watch and post results from this week.
I have the same issue where the regression channel doesn't show but the standard deviation channel does. I changed the starttime to 0 instead and it shows up. Might work for you.
 
I have the same issue where the regression channel doesn't show but the standard deviation channel does. I changed the starttime to 0 instead and it shows up. Might work for you.

The issue is that the code I posted has a very specific starttime. In a heavily traded symbol like SPY, there is usually activity. In the case of stocks, that is not always the case and if so, the indicator will not plot unless you do as you did by changing the starttime.

I have another version that modifies a Mobius script. It has a fix that seems to work in the event of the above issue by using getday() != getday()[1]. Otherwise, the input times work.

This works on charts other than TODAY charts.

Screenshot 2024-04-20 155514.png
Code:
#Mobius_Anchored_Linear_Regression_modified_End_at_Cond_y_Extended_Option
#08:35 Mobius: Here's the anchored Regression Channel I use

AddLabel(1, "Anchored LRL", Color.WHITE);
# Time Anchored Regression Channel
# Mobius
# V01.01.2016

input StartTime = 0400;
input Channel_1_Width = 1.0;
input Channel_2_Width = 2.00;
input LineWeight = 2;

script E
    {
    input y = close;
    input n = 20;
    def s = fold i = 0 to n
             with j
             do j + GetValue(y, i);
    plot D = s;
}
# Variables
def o = open;
def h = high;
def l = low;
def c = close;
def x = BarNumber();
def nan = Double.NaN;
def xx = if IsNaN(c[-1]) and !IsNaN(c) then x else xx[1];
def firstBar = if SecondsFromTime(StartTime) == 0
               then x
               else if (SecondsFromTime(StartTime) != 0) and GetDay() != GetDay()[1]
               then x
               else firstBar[1];

#Options to End Plot Based Upon Condition and Extended from there
input extend  = yes;
input endtime = 0929;
#Examples of Some Potential Conditions
def cond_y    = if SecondsFromTime(endtime) <= 0 then x else nan;
#if high==high(period=aggregationPeriod.DAY) then barnumber() else double.nan;
#if low==low(period=aggregationPeriod.DAY) then barnumber() else double.nan;
AddVerticalLine(x == HighestAll(cond_y), " ", Color.WHITE);
def y         = if x == 1 or IsNaN(close)
                then nan
                else if Between(x, HighestAll(firstBar), HighestAll(cond_y))
                then close
                else y[1];
#############

def S_y = if x == HighestAll(firstBar)
          then y
          else if x > HighestAll(firstBar)
               then S_y[1] + y
               else S_y[1];
def S_x = if x == HighestAll(firstBar)
          then 1
          else if x > HighestAll(firstBar)
               then S_x[1] + 1
               else S_x[1];
def x0_ = HighestAll(xx) - firstBar;
def x1 = HighestAll(if !IsNaN(y) and IsNaN(y[-1])
                    then x
                    else nan);
def x0 = HighestAll(if GetValue(x, -x0_) == x1
                    then x
                    else nan);
def x_ = if GetValue(x, -x0_) >= x1
         then x - x0
         else x_[1];
def Ex  = E(x_, x0_);
def Ey  = E(y, x0_);
def Exy = E(x_ * y, x0_);
def Exsq = E(Sqr(x_), x0_);
def b = (x0_ * Exy - (Ex * Ey)) / (x0_ * Exsq - (Ex * Ex));
def a = (GetValue(Ey, x - x1) - GetValue(b, x - x1) * GetValue(Ex, x - x1)) / x0_;
def LR = a + (GetValue(b, x - x1) * x_);
def r = Max(h, c[1]) - Min(l, c[1]);
def Er = E(r, x0_) / x0_;
def mean = S_y / S_x;
def SD = Sqrt((1 / S_x) * (E(Sqr(y - mean), S_x)));
# Plots
plot LRL = if extend == no and  x <= HighestAll(cond_y) #x >= x0  # x is defined as barnumber()
then LR
else if extend == yes and x >= x0       
then LR
else nan;
LRL.SetStyle(Curve.SHORT_DASH);
LRL.SetLineWeight(LineWeight + 1);
LRL.AssignValueColor(if GetValue(a, x - x1) < LR
                         then Color.CYAN
                         else Color.ORANGE);
LRL.HideBubble();
LRL.HideTitle();
plot upper1 = LRL + (HighestAll(SD) * Channel_1_Width);
upper1.SetStyle(Curve.MEDIUM_DASH);
upper1.SetLineWeight(LineWeight);
upper1.SetDefaultColor(Color.RED);
upper1.HideBubble();
upper1.HideTitle();
plot lower1 = LRL - (HighestAll(SD) * Channel_1_Width);
lower1.SetStyle(Curve.MEDIUM_DASH);
lower1.SetLineWeight(LineWeight);
lower1.SetDefaultColor(Color.RED);
lower1.HideBubble();
lower1.HideTitle();
plot upper2 = LRL + (HighestAll(SD) * Channel_2_Width);
upper2.SetStyle(Curve.LONG_DASH);
upper2.SetLineWeight(LineWeight);
upper2.SetDefaultColor(Color.YELLOW);
upper2.HideBubble();
upper2.HideTitle();
plot lower2 = LRL - (HighestAll(SD) * Channel_2_Width);
lower2.SetStyle(Curve.LONG_DASH);
lower2.SetLineWeight(LineWeight);
lower2.SetDefaultColor(Color.YELLOW);
lower2.HideBubble();
lower2.HideTitle();
# End Code Time Anchored Regression Channel

#
 
Last edited:
The issue is that the code I posted has a very specific starttime. In a heavily traded symbol like SPY, there is usually activity. In the case of stocks, that is not always the case and if so, the indicator will not plot unless you do as you did by changing the starttime.

I have another version that modifies a Mobius script. It has a fix that seems to work in the event of the above issue by using getday() != getday()[1]. Otherwise, the input times work.

This works on charts other than TODAY charts.
Thank you. Tried using this version. Some how its not plotting regression lines. Tried with Spy and other stocks with same time frame you used. Anything to be changed?
 
Thank you. Tried using this version. Some how its not plotting regression lines. Tried with Spy and other stocks with same time frame you used. Anything to be changed?

Here is a link to the SPY 3d2m chart displayed below http://tos.mx/DalVmJL
The link constains the studies shown in the image

mod note:
unfortunately, some members will not have shared links enabled until after the May 13 integration
workarounds: https://usethinkscript.com/threads/...tions-in-thinkorswim.18367/page-4#post-140610


Screenshot 2024-04-21 115254.png
 
Last edited by a moderator:
Anchored LRC does not work correctly.

I altered the start time to 830(hasnt happened yet at time I post this! I also tried 7 and I get the same plot) and it plots from 1 am on a 2mToday chart
 
Thank you @METAL.

How are you setting up your thicker greens lines, I believe that is support and resistance lines? However, what timeframe are you going back to in order set those?

Also have you ever tried this on futures?
 
Last edited:
What deviation are you using with the LRC tool? I cannot match what your screen shows, nor using the LRC anchor study you shared, speaking of that it has 400am start time,and 929am end time, but it plots from 100am so these levels at whatever deviation arent right if youre shooting for data thats starts at 4 to 929
 
Anchored LRC does not work correctly.

I altered the start time to 830(hasnt happened yet at time I post this! I also tried 7 and I get the same plot) and it plots from 1 am on a 2mToday chart

Not sure which LRC code you are referring to, so this relates to the last code I posted in post #65

The code has been modified to hopefully plot on various timeframe settings. including TODAY, and also work on most symbols, including futures

Here is SPY 3d2m charts starting at 0700-0929 and 0400-0929

Here is SPY 3d2m at 0400-929, /ES 3c2m at 1800-929 and GOOG 2mToday at 0400-929

Here is full code used above with just time input differences
Code:
#Mobius_Anchored_Linear_Regression_modified_End_at_Cond_y_Extended_Option_v1
#08:35 Mobius: Here's the anchored Regression Channel I use


# Time Anchored Regression Channel
# Mobius
# V01.01.2016

input StartTime       = 0400;
input extend          = yes;
input endtime         = 0929;
input Channel_1_Width = 0.70;
input Channel_2_Width = 1.00;
input lineweight = 1;
def sec1 = SecondsFromTime(StartTime);
def isTime1 = (sec1 >= 0 and sec1[1] < 0) or (sec1 < sec1[1] and sec1 >= 0);

script E
    {
    input y = close;
    input n = 20;
    def s = fold i = 0 to n
             with j
             do j + GetValue(y, i);
    plot D = s;
}
# Variables
def o = open;
def h = high;
def l = low;
def c = close;
def x = BarNumber();
def nan = Double.NaN;
def xx = if IsNaN(c[-1]) and !IsNaN(c) then x else xx[1];
def firstBar = if isTime1 == 1
               then x + 1            
               else firstBar[1];

#Options to End Plot Based Upon Condition and Extended from there

#Examples of Some Potential Conditions
def cond_y    = if SecondsFromTime(endtime) <= 0 then x else nan;
#if high==high(period=aggregationPeriod.DAY) then barnumber() else double.nan;
#if low==low(period=aggregationPeriod.DAY) then barnumber() else double.nan;
AddVerticalLine(x == HighestAll(cond_y), " ", Color.WHITE);
def y         = if x == 1 or IsNaN(close)
                then nan
                else if Between(x, HighestAll(firstBar), HighestAll(cond_y))
                then close
                else y[1];
#############

def S_y = if x == HighestAll(firstBar)
          then y
          else if x > HighestAll(firstBar)
               then S_y[1] + y
               else S_y[1];
def S_x = if x == HighestAll(firstBar)
          then 1
          else if x > HighestAll(firstBar)
               then S_x[1] + 1
               else S_x[1];
def x0_ = HighestAll(xx) - firstBar;
def x1 = HighestAll(if !IsNaN(y) and IsNaN(y[-1])
                    then x
                    else nan);
def x0 = HighestAll(if GetValue(x, -x0_) == x1
                    then x
                    else nan);
def x_ = if GetValue(x, -x0_) >= x1
         then x - x0
         else x_[1];
def Ex  = E(x_, x0_);
def Ey  = E(y, x0_);
def Exy = E(x_ * y, x0_);
def Exsq = E(Sqr(x_), x0_);
def b = (x0_ * Exy - (Ex * Ey)) / (x0_ * Exsq - (Ex * Ex));
def a = (GetValue(Ey, x - x1) - GetValue(b, x - x1) * GetValue(Ex, x - x1)) / x0_;
def LR = a + (GetValue(b, x - x1) * x_);
def r = Max(h, c[1]) - Min(l, c[1]);
def Er = E(r, x0_) / x0_;
def mean = S_y / S_x;
def SD = Sqrt((1 / S_x) * (E(Sqr(y - mean), S_x)));
# Plots
plot LRL = if extend == no and  x <= HighestAll(cond_y) #x >= x0  # x is defined as barnumber()
then LR
else if extend == yes and x >= x0        
then LR
else nan;
LRL.SetStyle(Curve.SHORT_DASH);
LRL.SetLineWeight(lineweight + 1);
LRL.AssignValueColor(if GetValue(a, x - x1) < LR
                         then Color.CYAN
                         else Color.ORANGE);
LRL.HideBubble();
LRL.HideTitle();
plot upper1 = LRL + (HighestAll(SD) * Channel_1_Width);
upper1.SetStyle(Curve.MEDIUM_DASH);
upper1.SetLineWeight(lineweight);
upper1.SetDefaultColor(Color.RED);
upper1.HideBubble();
upper1.HideTitle();
plot lower1 = LRL - (HighestAll(SD) * Channel_1_Width);
lower1.SetStyle(Curve.MEDIUM_DASH);
lower1.SetLineWeight(lineweight);
lower1.SetDefaultColor(Color.RED);
lower1.HideBubble();
lower1.HideTitle();
plot upper2 = LRL + (HighestAll(SD) * Channel_2_Width);
upper2.SetStyle(Curve.LONG_DASH);
upper2.SetLineWeight(lineweight);
upper2.SetDefaultColor(Color.YELLOW);
upper2.HideBubble();
upper2.HideTitle();
plot lower2 = LRL - (HighestAll(SD) * Channel_2_Width);
lower2.SetStyle(Curve.LONG_DASH);
lower2.SetLineWeight(lineweight);
lower2.SetDefaultColor(Color.YELLOW);
lower2.HideBubble();
lower2.HideTitle();
# End Code Time Anchored Regression Channel

#
 
  • Like
Reactions: ALV
Not sure which LRC code you are referring to, so this relates to the last code I posted in post #65

The code has been modified to hopefully plot on various timeframe settings. including TODAY, and also work on most symbols, including futures

Here is SPY 3d2m charts starting at 0700-0929 and 0400-0929


Here is SPY 3d2m at 0400-929, /ES 3c2m at 1800-929 and GOOG 2mToday at 0400-929


Here is full code used above with just time input difference
Not sure which LRC code you are referring to, so this relates to the last code I posted in post #65

The code has been modified to hopefully plot on various timeframe settings. including TODAY, and also work on most symbols, including futures

Here is SPY 3d2m charts starting at 0700-0929 and 0400-0929


Here is SPY 3d2m at 0400-929, /ES 3c2m at 1800-929 and GOOG 2mToday at 0400-929


Here is full code used above with just time input differences
Sorry to bother. Any way to make it work on mobile?
 
Last edited by a moderator:
The issue is that the code I posted has a very specific starttime. In a heavily traded symbol like SPY, there is usually activity. In the case of stocks, that is not always the case and if so, the indicator will not plot unless you do as you did by changing the starttime.

I have another version that modifies a Mobius script. It has a fix that seems to work in the event of the above issue by using getday() != getday()[1]. Otherwise, the input times work.

This works on charts other than TODAY charts.
Thank You @SleepyZ .
 
what indicator is the support/resistance green bars? I can't seem to get my chart setup to look like yours even after importing the main grid and the ema color study
I draw those manually every morning using higher TF as Supply/Demand and Support/Resistance zones.
 
@SleepyZ is there any reason why your Mobius LRC script wouldn't work on ES futures chart? It did work for me this week, but then suddenly it doesn't work on an ES chart. Yes, works on a SPY chart. When I open an ES chart and apply the script, it flashes likes it's going to work, but then it goes away. Hmmm. Any thoughts? I should add ... thank you for sharing your expertise.
 

Not the exact question you're looking for?

Start a new thread and receive assistance from our community.

87k+ Posts
424 Online
Create Post

The Market Trading Game Changer

Join 2,500+ subscribers inside the useThinkScript VIP Membership Club
  • Exclusive indicators
  • Proven strategies & setups
  • Private Discord community
  • ‘Buy The Dip’ signal alerts
  • Exclusive members-only content
  • Add-ons and resources
  • 1 full year of unlimited support

Frequently Asked Questions

What is useThinkScript?

useThinkScript is the #1 community of stock market investors using indicators and other tools to power their trading strategies. Traders of all skill levels use our forums to learn about scripting and indicators, help each other, and discover new ways to gain an edge in the markets.

How do I get started?

We get it. Our forum can be intimidating, if not overwhelming. With thousands of topics, tens of thousands of posts, our community has created an incredibly deep knowledge base for stock traders. No one can ever exhaust every resource provided on our site.

If you are new, or just looking for guidance, here are some helpful links to get you started.

What are the benefits of VIP Membership?
VIP members get exclusive access to these proven and tested premium indicators: Buy the Dip, Advanced Market Moves 2.0, Take Profit, and Volatility Trading Range. In addition, VIP members get access to over 50 VIP-only custom indicators, add-ons, and strategies, private VIP-only forums, private Discord channel to discuss trades and strategies in real-time, customer support, trade alerts, and much more. Learn all about VIP membership here.
How can I access the premium indicators?
To access the premium indicators, which are plug and play ready, sign up for VIP membership here.
Back
Top