@MerryDay
I think the scan you are referring is for daily . I change the input and gave interval as 5 minutes but not getting any results . I am using this code for drawing fib on 5 minutes chart , I just added the plot scan at the end of the code , but it give TooComplexException .What am i missing here
#Auto Fib Levels After Bar @rangeEnd Closes
#Using Mobius' OR logic for Range
#Plots limited to RTHrs
#edit by @brooklyngfellaz, added addtional fibs, color and labels.
input rangeStart = 0930;
input rangeEnd = 0935;
input ShowTodayOnly = no;
def A = if SecondsTillTime(rangeEnd) > 0 and SecondsFromTime(rangeStart) >= 0
then 1
else 0;
def today = if ShowTodayOnly == no or
GetDay() == GetLastDay() and SecondsFromTime(rangeStart) >= 0
then 1
else 0;
def H = if H[1] == 0 or
A[1] == 0 and A == 1
then high
else if A and high > H[1]
then high
else H[1];
def L = if IsNaN(low) then L[1] else if L[1] == 0 or
A[1] == 0 and A == 1
then low
else if A and low < L[1]
then low
else L[1];
def Range = H - L;
def HA = if A or today < 1
then Double.NaN
else H;
def LA = if A or today < 1
then Double.NaN
else L;
def fib001 = if IsNaN(close) and SecondsTillTime(1615) > 0 then fib001[1]
else if SecondsFromTime(1615)[1] >= 0 or
(SecondsFromTime(0000) > 0 and SecondsFromTime(rangeStart) < 0)
then Double.NaN
else LA + Range * 0.0;
plot f001 = fib001;
f001.SetPaintingStrategy(PaintingStrategy.HORIZONTAL);
f001.SetDefaultColor( Createcolor(255,255,255));
def fib33 = if IsNaN(close) and SecondsTillTime(1615) > 0 then fib33[1]
else if SecondsFromTime(1615)[1] >= 0 or
(SecondsFromTime(0000) > 0 and SecondsFromTime(rangeStart) < 0)
then Double.NaN
else LA + Range * .33;
#plot f33 = fib33;
#f33.SetPaintingStrategy(PaintingStrategy.HORIZONTAL);
#f33.SetDefaultColor( Createcolor(192,192,192));
def fib332 = if IsNaN(close) and SecondsTillTime(1615) > 0 then fib332[1]
else if SecondsFromTime(1615)[1] >= 0 or
(SecondsFromTime(0000) > 0 and SecondsFromTime(rangeStart) < 0)
then Double.NaN
else LA + Range * -.33;
#plot f332 = fib332;
#f332.SetPaintingStrategy(PaintingStrategy.HORIZONTAL);
#f332.SetDefaultColor( Createcolor(192,192,192));
def fib133 = if IsNaN(close) and SecondsTillTime(1615) > 0 then fib133[1]
else if SecondsFromTime(1615)[1] >= 0 or
(SecondsFromTime(0000) > 0 and SecondsFromTime(rangeStart) < 0)
then Double.NaN
else LA + Range * 1.33;
#plot f133 = fib133;
#f133.SetPaintingStrategy(PaintingStrategy.HORIZONTAL);
#f133.SetDefaultColor( Createcolor(255,0,0));
def fib1332 = if IsNaN(close) and SecondsTillTime(1615) > 0 then fib1332[1]
else if SecondsFromTime(1615)[1] >= 0 or
(SecondsFromTime(0000) > 0 and SecondsFromTime(rangeStart) < 0)
then Double.NaN
else LA + Range * -1.33;
#plot f1332 = fib1332;
#f1332.SetPaintingStrategy(PaintingStrategy.HORIZONTAL);
#f1332.SetDefaultColor( Createcolor(255,0,0));
def fib333 = if IsNaN(close) and SecondsTillTime(1615) > 0 then fib333[1]
else if SecondsFromTime(1615)[1] >= 0 or
(SecondsFromTime(0000) > 0 and SecondsFromTime(rangeStart) < 0)
then Double.NaN
else LA + Range * 3.33;
#plot f333 = fib333;
#f333.SetPaintingStrategy(PaintingStrategy.HORIZONTAL);
#f333.SetDefaultColor( Createcolor(255,0,0));
def fib334 = if IsNaN(close) and SecondsTillTime(1600) > 0 then fib334[1]
else if SecondsFromTime(1600)[1] >= 0 or
(SecondsFromTime(0000) > 0 and SecondsFromTime(rangeStart) < 0)
then Double.NaN
else LA + Range * -3.33;
#plot f334 = fib334;
#f334.SetPaintingStrategy(PaintingStrategy.HORIZONTAL);
#f334.SetDefaultColor( Createcolor(255,0,0));
def fib382 = if IsNaN(close) and SecondsTillTime(1615) > 0 then fib382[1]
else if SecondsFromTime(1615)[1] >= 0 or
(SecondsFromTime(0000) > 0 and SecondsFromTime(rangeStart) < 0)
then Double.NaN
else LA + Range * .79;
#plot f382 = fib382;
#f382.SetPaintingStrategy(PaintingStrategy.HORIZONTAL);
#f382.SetDefaultColor( Createcolor(218,165,32));
def fib618 = if IsNaN(close) and SecondsTillTime(1615) > 0 then fib618[1]
else if SecondsFromTime(1615)[1] >= 0 or
(SecondsFromTime(0000) > 0 and SecondsFromTime(rangeStart) < 0)
then Double.NaN
else LA + Range * .88;
#plot f618 = fib618;
#f618.SetPaintingStrategy(PaintingStrategy.HORIZONTAL);
#f618.SetDefaultColor( Createcolor(218,165,32));
def fib792 = if IsNaN(close) and SecondsTillTime(1615) > 0 then fib792[1]
else if SecondsFromTime(1615)[1] >= 0 or
(SecondsFromTime(0000) > 0 and SecondsFromTime(rangeStart) < 0)
then Double.NaN
else LA + Range * -.79;
#plot f792 = fib792;
#f792.SetPaintingStrategy(PaintingStrategy.HORIZONTAL);
#f792.SetDefaultColor( Createcolor(218,165,32));
def fib888 = if IsNaN(close) and SecondsTillTime(1615) > 0 then fib888[1]
else if SecondsFromTime(1615)[1] >= 0 or
(SecondsFromTime(0000) > 0 and SecondsFromTime(rangeStart) < 0)
then Double.NaN
else LA + Range * -.88;
#plot f888 = fib888;
#f888.SetPaintingStrategy(PaintingStrategy.HORIZONTAL);
#f888.SetDefaultColor( Createcolor(218,165,32));
def fib179 = if IsNaN(close) and SecondsTillTime(1615) > 0 then fib179[1]
else if SecondsFromTime(1615)[1] >= 0 or
(SecondsFromTime(0000) > 0 and SecondsFromTime(rangeStart) < 0)
then Double.NaN
else LA + Range * 1.79;
#plot f179 = fib179;
#f179.SetPaintingStrategy(PaintingStrategy.HORIZONTAL);
#f179.SetDefaultColor( Createcolor(255,0,0));
def fib188 = if IsNaN(close) and SecondsTillTime(1615) > 0 then fib188[1]
else if SecondsFromTime(1615)[1] >= 0 or
(SecondsFromTime(0000) > 0 and SecondsFromTime(rangeStart) < 0)
then Double.NaN
else LA + Range * 1.88;
#plot f188 = fib188;
#f188.SetPaintingStrategy(PaintingStrategy.HORIZONTAL);
#f188.SetDefaultColor( Createcolor(255,0,0));
def fib1792 = if IsNaN(close) and SecondsTillTime(1615) > 0 then fib1792[1]
else if SecondsFromTime(1615)[1] >= 0 or
(SecondsFromTime(0000) > 0 and SecondsFromTime(rangeStart) < 0)
then Double.NaN
else LA + Range * -1.79;
#plot f1792 = fib1792;
#f1792.SetPaintingStrategy(PaintingStrategy.HORIZONTAL);
#f1792.SetDefaultColor( Createcolor(255,0,0));
def fib1882 = if IsNaN(close) and SecondsTillTime(1615) > 0 then fib1882[1]
else if SecondsFromTime(1615)[1] >= 0 or
(SecondsFromTime(0000) > 0 and SecondsFromTime(rangeStart) < 0)
then Double.NaN
else LA + Range * -1.88;
#plot f1882 = fib1882;
#f1882.SetPaintingStrategy(PaintingStrategy.HORIZONTAL);
#f1882.SetDefaultColor( Createcolor(255,0,0));
def fib479 = if IsNaN(close) and SecondsTillTime(1600) > 0 then fib479[1]
else if SecondsFromTime(1600)[1] >= 0 or
(SecondsFromTime(0000) > 0 and SecondsFromTime(rangeStart) < 0)
then Double.NaN
else LA + Range * 4.79;
#plot f479 = fib479;
#f479.SetPaintingStrategy(PaintingStrategy.HORIZONTAL);
#f479.SetDefaultColor( Createcolor(255,0,0));
def fib488 = if IsNaN(close) and SecondsTillTime(1600) > 0 then fib488[1]
else if SecondsFromTime(1600)[1] >= 0 or
(SecondsFromTime(0000) > 0 and SecondsFromTime(rangeStart) < 0)
then Double.NaN
else LA + Range * 4.88;
#plot f488 = fib488;
#f488.SetPaintingStrategy(PaintingStrategy.HORIZONTAL);
#f488.SetDefaultColor( Createcolor(255,0,0));
def fib4792 = if IsNaN(close) and SecondsTillTime(1600) > 0 then fib4792[1]
else if SecondsFromTime(1600)[1] >= 0 or
(SecondsFromTime(0000) > 0 and SecondsFromTime(rangeStart) < 0)
then Double.NaN
else LA + Range * -4.79;
#plot f4792 = fib4792;
#f4792.SetPaintingStrategy(PaintingStrategy.HORIZONTAL);
#f4792.SetDefaultColor( Createcolor(255,0,0));
def fib4889 = if IsNaN(close) and SecondsTillTime(1600) > 0 then fib4889[1]
else if SecondsFromTime(1600)[1] >= 0 or
(SecondsFromTime(0000) > 0 and SecondsFromTime(rangeStart) < 0)
then Double.NaN
else LA + Range * -4.88;
#plot f4889 = fib4889;
#f4889.SetPaintingStrategy(PaintingStrategy.HORIZONTAL);
#f4889.SetDefaultColor( Createcolor(255,0,0));
def fib633 = if IsNaN(close) and SecondsTillTime(1600) > 0 then fib633[1]
else if SecondsFromTime(1600)[1] >= 0 or
(SecondsFromTime(0000) > 0 and SecondsFromTime(rangeStart) < 0)
then Double.NaN
else LA + Range * 6.33;
#plot f633 = fib633;
#f633.SetPaintingStrategy(PaintingStrategy.HORIZONTAL);
#f633.SetDefaultColor( Createcolor(192,192,192));
def fib6332 = if IsNaN(close) and SecondsTillTime(1600) > 0 then fib6332[1]
else if SecondsFromTime(1600)[1] >= 0 or
(SecondsFromTime(0000) > 0 and SecondsFromTime(rangeStart) < 0)
then Double.NaN
else LA + Range * -6.33;
#plot f6332 = fib6332;
#f6332.SetPaintingStrategy(PaintingStrategy.HORIZONTAL);
#f6332.SetDefaultColor( Createcolor(192,192,192));
def fib779 = if IsNaN(close) and SecondsTillTime(1600) > 0 then fib779[1]
else if SecondsFromTime(1600)[1] >= 0 or
(SecondsFromTime(0000) > 0 and SecondsFromTime(rangeStart) < 0)
then Double.NaN
else LA + Range * 7.79;
#plot f779 = fib779;
#f779.SetPaintingStrategy(PaintingStrategy.HORIZONTAL);
#f779.SetDefaultColor( Createcolor(255,0,0));
def fib788 = if IsNaN(close) and SecondsTillTime(1600) > 0 then fib788[1]
else if SecondsFromTime(1600)[1] >= 0 or
(SecondsFromTime(0000) > 0 and SecondsFromTime(rangeStart) < 0)
then Double.NaN
else LA + Range * 7.88;
#plot f788 = fib788;
#f788.SetPaintingStrategy(PaintingStrategy.HORIZONTAL);
#f788.SetDefaultColor( Createcolor(255,0,0));
def fib7792 = if IsNaN(close) and SecondsTillTime(1600) > 0 then fib7792[1]
else if SecondsFromTime(1600)[1] >= 0 or
(SecondsFromTime(0000) > 0 and SecondsFromTime(rangeStart) < 0)
then Double.NaN
else LA + Range * -7.79;
#plot f7792 = fib7792;
#f7792.SetPaintingStrategy(PaintingStrategy.HORIZONTAL);
#f7792.SetDefaultColor( Createcolor(255,0,0));
def fib7882 = if IsNaN(close) and SecondsTillTime(1600) > 0 then fib7882[1]
else if SecondsFromTime(1600)[1] >= 0 or
(SecondsFromTime(0000) > 0 and SecondsFromTime(rangeStart) < 0)
then Double.NaN
else LA + Range * -7.88;
#plot f7882 = fib7882;
#f7882.SetPaintingStrategy(PaintingStrategy.HORIZONTAL);
#f7882.SetDefaultColor( Createcolor(255,0,0));
def fib933 = if IsNaN(close) and SecondsTillTime(1600) > 0 then fib933[1]
else if SecondsFromTime(1600)[1] >= 0 or
(SecondsFromTime(0000) > 0 and SecondsFromTime(rangeStart) < 0)
then Double.NaN
else LA + Range * 9.33;
#plot f933 = fib933;
#f933.SetPaintingStrategy(PaintingStrategy.HORIZONTAL);
#f933.SetDefaultColor( Createcolor(192,192,192));
def fib9332 = if IsNaN(close) and SecondsTillTime(1600) > 0 then fib9332[1]
else if SecondsFromTime(1600)[1] >= 0 or
(SecondsFromTime(0000) > 0 and SecondsFromTime(rangeStart) < 0)
then Double.NaN
else LA + Range * -9.33;
#plot f9332 = fib9332;
#f9332.SetPaintingStrategy(PaintingStrategy.HORIZONTAL);
#f9332.SetDefaultColor( Createcolor(192,192,192));
input bubble = yes;
input bubblemover = 3;
def b = bubblemover;
def b1 = b + 1;
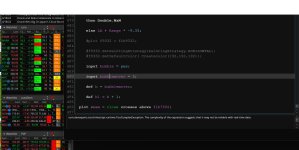
plot scan = close crosses above fib792;
In the screenshot fib 792 is in golden color . i want the scan to chk if the list of stocks get in to this range in 5 minute interval
I did line by line comparison with the FIB code that you shared earlier . There is not much difference except there is an additional condition for the each definitions defined .


")