Trust The Levels - Trade Options In ThinkOrSwim

Screenshot 2024-04-12 191154.png


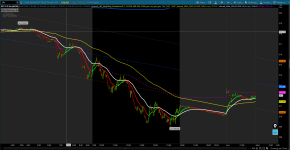
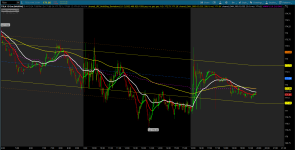
On 3/22, my lines show at very different locations and far away from the main price action. i didn't make any changes to the indicator. how do i backtest it?

also, i see only 3 lines on my chart. i may be missing a SD. How do i get that?
 

Join useThinkScript to post your question to a community of 21,000+ developers and traders.

Guys, This is somewhat of a game changer for me. I have profited more in the last few days using this indicator. See chart where I bought and sold. Here is my grid if anyone is interested. https://tos.mx/psH8Wtm

Here is a link to the video.
View attachment 20985View attachment 20986
View attachment 20987
View attachment 20988
Metal,

Been following your posts and getting up the learning curve. Do you favor calls or puts, and in the money or out. Also, per chance could you share the new indicator you spoke of. Thanks
 
Metal,

Been following your posts and getting up the learning curve. Do you favor calls or puts, and in the money or out. Also, per chance could you share the new indicator you spoke of. Thanks
I do not favor one way or the other. I trade with the market as a whole. I will look for ES, NQ, QQQ to moving in the same direction and especially if they break and retest or reject a major S/R level. I typically get at the money unless the price is super low, then I may buy more in the money. After using the volatility trailing stop for a bit, I stopped using it. I will provide it later.
 
I do not favor one way or the other. I trade with the market as a whole. I will look for ES, NQ, QQQ to moving in the same direction and especially if they break and retest or reject a major S/R level. I typically get at the money unless the price is super low, then I may buy more in the money. After using the volatility trailing stop for a bit, I stopped using it. I will provide it later.

Thank you very much @METAL for the strategy. I tried with NVDA and those were good scalping trades.

I see that reg channels plot correctly (as your screen shots) only if I use 2m 1d. Is the that the case?
but other charts you posted uses 2m/5 days. Do we have a setting that needs to adjusted?

Could you also please suggest how to enable 2nd dev (Yellow lines) levels. I tried with Multi-Day but not matching your charts.
 

Attachments

  • Screenshot 2024-04-12 013025.png
    Screenshot 2024-04-12 013025.png
    139 KB · Views: 219
Thank you very much @METAL for the strategy. I tried with NVDA and those were good scalping trades.

I see that reg channels plot correctly (as your screen shots) only if I use 2m 1d. Is the that the case?
but other charts you posted uses 2m/5 days. Do we have a setting that needs to adjusted?

Could you also please suggest how to enable 2nd dev (Yellow lines) levels. I tried with Multi-Day but not matching your charts.
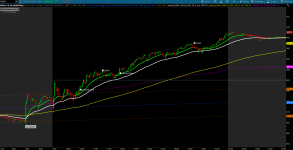
I simply use the multi day with deviations. I am not sure what isn't matching. Can you take a snapshot so I can compare. I am glad it worked for you.
 
I simply use the multi day with deviations. I am not sure what isn't matching. Can you take a snapshot so I can compare. I am glad it worked for you.
Thank you very much for the response. I dont know what's causing it but when I remove price zoom, I could see the 2nd dev yellow lines. They are disappeared for SPY. Here are the screen shots

Appreciate all your help and contribution to this forum.
Thanks again for amazing strategy. Will watch and post results from this week.
 

Attachments

  • Spy.png
    Spy.png
    237.7 KB · Views: 272
  • TSLA_2ndDev.png
    TSLA_2ndDev.png
    169.4 KB · Views: 288
Thank you very much for the response. I dont know what's causing it but when I remove price zoom, I could see the 2nd dev yellow lines. They are disappeared for SPY. Here are the screen shots

Appreciate all your help and contribution to this forum.
Thanks again for amazing strategy. Will watch and post results from this week.
I know what you are referring to. SPY has some issues with multi day. It seems to correct itself during live trading but is off sometimes when trying to review.
 
@METAL
Can't you stay in the trade as long as the first opposite direction candle does not close either above the 20 (for put) or below the 20 (for a call)?
 
@METAL
Can't you stay in the trade as long as the first opposite direction candle does not close either above the 20 (for put) or below the 20 (for a call)?
That is what I attempt to do but there are several variables that may alter that for me.
1) I see a market reversal/rejection of a major level.
2) SPX is too risky for me so I get out too soon all the time.
3) Stock may have reached my target level.
4) If I trade into the 200 (Only if there is a large gap to the 20) and the price reaches the 200.
5) I watch Profit too much! FOMO!:oops:
I try to scale out on most of the above and hold runners and if I get continuation, then I stay in. If I get a reversal, then I close out.
I also have found that it is really best to wait for a 2nd close above/below the 20 EMA If you truly want to get the most of a run. Of course this will reduce some profits. This is an individual traders decision.
 
Hi Metal,
First I want to thank you for sharing your strategy! I have began paper trading and it's looking really sound. I have a question about the dotted line price levels or support/resistance dashed lines. I use your shared link and I am not seeing those on my chart. Are they part of an indicator or are you doing those manually?
Thanks,
Eric
I put them in manually every morning and after news in case the news changes things enough.
 

Not the exact question you're looking for?

Start a new thread and receive assistance from our community.

87k+ Posts
339 Online
Create Post

The Market Trading Game Changer

Join 2,500+ subscribers inside the useThinkScript VIP Membership Club
  • Exclusive indicators
  • Proven strategies & setups
  • Private Discord community
  • ‘Buy The Dip’ signal alerts
  • Exclusive members-only content
  • Add-ons and resources
  • 1 full year of unlimited support

Frequently Asked Questions

What is useThinkScript?

useThinkScript is the #1 community of stock market investors using indicators and other tools to power their trading strategies. Traders of all skill levels use our forums to learn about scripting and indicators, help each other, and discover new ways to gain an edge in the markets.

How do I get started?

We get it. Our forum can be intimidating, if not overwhelming. With thousands of topics, tens of thousands of posts, our community has created an incredibly deep knowledge base for stock traders. No one can ever exhaust every resource provided on our site.

If you are new, or just looking for guidance, here are some helpful links to get you started.

What are the benefits of VIP Membership?
VIP members get exclusive access to these proven and tested premium indicators: Buy the Dip, Advanced Market Moves 2.0, Take Profit, and Volatility Trading Range. In addition, VIP members get access to over 50 VIP-only custom indicators, add-ons, and strategies, private VIP-only forums, private Discord channel to discuss trades and strategies in real-time, customer support, trade alerts, and much more. Learn all about VIP membership here.
How can I access the premium indicators?
To access the premium indicators, which are plug and play ready, sign up for VIP membership here.
Back
Top