Sector Rotation Indicator for ThinkorSwim

markos

Well-known member
VIP
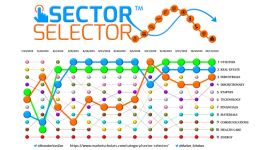
Sector Rotation involves shifting investments to sectors expected to outperform, optimizing returns based on market conditions.

It's for the visual learner like me. Take a look at that chart on a weekly TF and you'll see the Rotation. I would move money into what is moving up and rotating out of what is dropping.

Once the top sectors are found, you would then look for stocks in that sector that are leading and place your trade according to your style.

Dsy0J1F.png


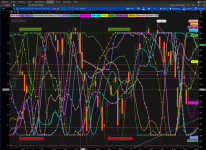
@diazlaz See if this concept is workable. Idealy, to me, SPY should be at ==0 with the others rotating around it. Thoughts?
@BenTen Please copy this to its own thread...
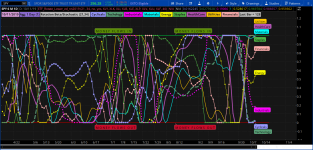
Code:
# beta_rotation_v2
#ETF_Rotate_Lower_ED_nn 4-2019
# from 4/4/2019 chat room:
# 06:37 Mobius: johnny - To find rotation quickly - Use primary ETF's in a watchlist with 2 columns first column is Correlation to SPX second is a stochastic of Beta, if Beta is 1 or close to 1 that ETF is moving at the fastest momentum in that range and if correlation is with SPX .85 or better it's moving with SPX cor# daily start with 13,34 as starting point
#markos #took out out Beta 1 & 2 4-19-19 # Put Back in 6-23-19

declare lower;

input BetaLength = 21;
input StochLength =34;
input showBeta = No;
input showOverlay = Yes;

input Cyclicals      = "XLY";
input Technology     = "XLK";
input Industrials    = "XLI";
input Materials      = "XLB";
input Energy         = "XLE";
input Staples        = "XLP";
input HealthCare     = "XLV";
input Utilities      = "XLU";
input Financials     = "XLF";

#------------------------------
#----purple colors
defineglobalColor(“PlumMedium“, createColor(221, 160, 221));
defineglobalColor(“Orchid“, createColor(218, 130, 214));
defineglobalColor(“MediumOrchid“, createColor(186, 85, 211));
defineglobalColor(“MediumPurple“, createColor(147, 112, 219));
defineglobalColor(“DarkOrchid“, createColor(153, 50, 204));


plot Scriptlabel = Double.NaN;
Scriptlabel.SetDefaultColor(CreateColor (0, 0, 0));

def Agg = GetAggregationPeriod();

#--------------------date start
addLabel(1,  getMonth() + "/" +
             getDayOfMonth(getYyyyMmDd()) + "/" +
             AsPrice(getYear()), GlobalColor("PlumMedium"));
#--------------------date end

#addLabel(1, " Ticker: '" + GetSymbol() + "' ", GlobalColor("Orchid"));

addLabel(1, "Agg: " +
              ( if Agg == 60000 then "1 Min"
           else if Agg == 120000 then "2 Min"
           else if Agg == 180000 then "3 Min"
           else if Agg == 240000 then "4 Min"
           else if Agg == 300000 then "5 Min"
           else if Agg == 600000 then "10 Min"
           else if Agg == 900000 then "15 Min"
           else if Agg == 1800000 then "30 Min"
           else if Agg == 3600000 then "1 Hour"
           else if Agg == 7200000 then "2 Hour"
           else if Agg == 14400000 then "4 Hours"
           else if Agg == 86400000 then "1 Day"
           else if Agg == 604800000 then "1 Week"
           else if Agg == 2592000000 then "1 Month"
           else  (Agg / 1000 / 60) + "Minutes")  +
           " (" + (if Agg<=23400000
                   then 23400000/Agg
                   else 86400000/Agg)+ ")"
          , GlobalColor("MediumPurple"));
#addLabel(1, BarNumber() + " Bars", GlobalColor("DarkOrchid"));

#-----------------------------
#-----------------------------

addLabel(1,"Rotation Beta/Stochastic (" + betaLength + "," +stochLength + ") ", color.Light_Gray);


script calcBeta {
  input secondSymbol = "XLF";
  input refSymbol = "SPX";
  input betaLength = 21;
  input returnLength = 1;

  def refPrice = close(refSymbol);
  def primary = if refPrice[returnLength] == 0
                then 0
                else (refPrice - refPrice[returnLength]) /
                      refPrice[returnLength] * 100;
  def secondPrice = close(secondSymbol);
  def secondary = if secondPrice[returnLength] == 0
                  then 0
                  else (secondPrice - secondPrice[returnLength]) /
                        secondPrice[returnLength] * 100;
  plot Beta = covariance(secondary, primary, betaLength) /
                         Sqr(stdev(primary, betaLength));
}

script EhlersESSfilter {
    input price = close;
    input length = 8;
    def ESS_coeff_0 = Exp(-Double.Pi * Sqrt(2) / length);
    def ESS_coeff_2 = 2 * ESS_coeff_0 * Cos(Sqrt(2) * Double.Pi / length);
    def ESS_coeff_3 = - Sqr(ESS_coeff_0);
    def ESS_coeff_1 = 1 - ESS_coeff_2 - ESS_coeff_3;
    def ESS_filter = if IsNaN(price + price[1]) then
                      ESS_filter[1]
                 else ESS_coeff_1 * (price + price[1]) / 2 +
                      ESS_coeff_2 * ESS_filter[1] +
                      ESS_coeff_3 * ESS_filter[2];
    plot Smooth_Filter =
         if barnumber() <  length then
              price
         else if !IsNaN(price) then
              ESS_filter
         else Double.NaN;
}

script calcStoch {
  input data = close;
  input StochLength = 21;
  def stochasticValue = ((data - lowest(data, StochLength)) /
                         (highest(data, StochLength) - lowest(data, StochLength)));
  plot stoch = stochasticValue;
}

plot beta1 = if showBeta then calcBeta(Cyclicals) else Double.NaN;
plot beta2 = if showBeta then calcBeta(Technology) else Double.NaN;
####
plot stoch1 = calcStoch(
                        data = EhlersESSfilter(
                               calcBeta(secondSymbol = Cyclicals,
                               betaLength = BetaLength)),
                                     stochLength = StochLength);
stoch1.SetDefaultColor(Color.VIOLET);
stoch1.SetLineWeight(2);
stoch1.SetPaintingStrategy(PaintingStrategy.LINE_VS_SQUARES);
stoch1.HideBubble();
AddLabel(ShowOverlay, " Cyclicals ", Color.VIOLET);
AddChartBubble(ShowOverlay and IsNaN(close[-1]) and !IsNaN(close), if stoch1 < 0.15 then 0 else if stoch1 > 0.85 then 1 else stoch1, "Cyclicals", Color.VIOLET, stoch1 > 0.5);

plot stoch2 = calcStoch(
                        data = EhlersESSfilter(
                               calcBeta(secondSymbol = Technology,
                               betaLength = BetaLength)),
                                     stochLength = StochLength);
stoch2.SetDefaultColor(CreateColor(90, 160, 120));
stoch2.SetLineWeight(5);
stoch2.SetStyle(Curve.LONG_DASH);
stoch2.HideBubble();
AddLabel(ShowOverlay, " Techology ", CreateColor(90, 160, 120));
AddChartBubble(ShowOverlay and IsNaN(close[-1]) and !IsNaN(close), if stoch2 < 0.15 then 0 else if stoch2 > 0.85 then 1 else stoch2, "Technology", CreateColor(90, 160, 120), stoch2 > 0.5);

plot stoch3 = calcStoch(
                        data = EhlersESSfilter(
                               calcBeta(secondSymbol = Industrials,
                               betaLength = BetaLength)),
                                     stochLength = StochLength);
stoch3.SetDefaultColor(Color.MAGENTA);
stoch3.SetLineWeight(5);
stoch3.SetStyle(Curve.SHORT_DASH);
stoch3.HideBubble();
AddLabel(ShowOverlay, " Industrials ", Color.MAGENTA);
AddChartBubble(ShowOverlay and IsNaN(close[-1]) and !IsNaN(close), if stoch3 < 0.15 then 0 else if stoch3 > 0.85 then 1 else stoch3, "Industrials", Color.MAGENTA, stoch3 > 0.5);

plot stoch4 = calcStoch(
                        data = EhlersESSfilter(
                               calcBeta(secondSymbol = Materials,
                               betaLength = BetaLength)),
                                     stochLength = StochLength);
stoch4.SetDefaultColor(Color.CYAN);
stoch4.SetLineWeight(2);
stoch4.SetPaintingStrategy(PaintingStrategy.LINE);
stoch4.HideBubble();
AddLabel(ShowOverlay, " Materials ", Color.CYAN);
AddChartBubble(ShowOverlay and IsNaN(close[-1]) and !IsNaN(close), if stoch4 < 0.15 then 0 else if stoch4 > 0.85 then 1 else stoch4, "Materials", Color.CYAN, stoch4 > 0.5);

plot stoch5 = calcStoch(
                        data = EhlersESSfilter(
                               calcBeta(secondSymbol = Energy,
                               betaLength = BetaLength)),
                                     stochLength = StochLength);
stoch5.SetDefaultColor(Color.YELLOW);
stoch5.SetLineWeight(1);
stoch5.SetPaintingStrategy(PaintingStrategy.Line_vs_POINTS);
stoch5.HideBubble();
AddLabel(ShowOverlay, " Energy ", Color.YELLOW);
AddChartBubble(ShowOverlay and IsNaN(close[-1]) and !IsNaN(close), if stoch5 < 0.15 then 0 else if stoch5 > 0.85 then 1 else stoch5, "Energy", Color.YELLOW, stoch5 > 0.5);

plot stoch6 = calcStoch(
                        data = EhlersESSfilter(
                               calcBeta(secondSymbol = Staples,
                               betaLength = BetaLength)),
                                     stochLength = StochLength);
stoch6.SetDefaultColor(CreateColor(80, 180, 70));
stoch6.SetLineWeight(2);
stoch6.SetPaintingStrategy(PaintingStrategy.LINE_VS_TRIANGLES);
stoch6.HideBubble();
AddLabel(ShowOverlay, " Staples ", CreateColor(80, 180, 70));
AddChartBubble(ShowOverlay and IsNaN(close[-1]) and !IsNaN(close), if stoch6 < 0.15 then 0 else if stoch6 > 0.85 then 1 else stoch6, "Staples", CreateColor(80, 180, 70), stoch6 > close);

plot stoch7 = calcStoch(
                        data = EhlersESSfilter(
                               calcBeta(secondSymbol = HealthCare,
                               betaLength = BetaLength)),
                                     stochLength = StochLength);
stoch7.SetDefaultColor(CreateColor(180, 80, 180));
stoch7.SetLineWeight(4);
stoch7.SetPaintingStrategy(PaintingStrategy.LINE);
stoch7.HideBubble();
AddLabel(ShowOverlay, " HealthCare ", CreateColor(180, 80, 180));
AddChartBubble("time condition" = ShowOverlay and IsNaN(close[-1]) and !IsNaN(close), "price location" = if stoch7 < 0.15 then 0 else if stoch7 > 0.85 then 1 else stoch7, text = "HealthCare", color = CreateColor(180, 80, 180), stoch7 > 0.5);

plot stoch8 = calcStoch(
                        data = EhlersESSfilter(
                               calcBeta(secondSymbol = Utilities,
                               betaLength = BetaLength)),
                                     stochLength = StochLength);
stoch8.SetDefaultColor(Color.ORANGE);
stoch8.SetLineWeight(2);
stoch8.SetPaintingStrategy(PaintingStrategy.LINE);
stoch8.HideBubble();
AddLabel(ShowOverlay, " Utilities ", Color.ORANGE);
AddChartBubble(ShowOverlay and IsNaN(close[-1]) and !IsNaN(close[0]), if stoch8 < 0.15 then 0 else if stoch8 > 0.85 then 1 else stoch8, "Utilities", Color.ORANGE, stoch8 > 0.5);

plot stoch9 = calcStoch(
                        data = EhlersESSfilter(
                               calcBeta(secondSymbol = Financials,
                               betaLength = BetaLength)),
                                     stochLength = StochLength);
stoch9.SetDefaultColor(Color.PINK);
stoch9.SetLineWeight(2);
stoch9.SetPaintingStrategy(PaintingStrategy.LINE_VS_POINTS);
stoch9.HideBubble();
AddLabel(ShowOverlay, " Financials ", Color.PINK);
AddChartBubble(ShowOverlay and IsNaN(close[-1]) and !IsNaN(close), if stoch9 < 0.15 then 0 else if stoch9 > 0.85 then 1 else stoch9, "Financials", Color.PINK, stoch9 > 0.5);

#----------------------------------------------
def barNumber = BarNumber();
def endBar = if !IsNaN(close) and IsNaN(close[-1]) then barNumber else endBar[1];
def lastBar = HighestAll(endBar);
input flowLabelStep = 40;
addLabel(1,"Last Bar = " + lastBar, color.Light_Gray);
DefineGlobalColor("YellowGreen", CreateColor(90, 140, 5));
AddChartBubble(barNumber == (lastBar - flowLabelStep), 1.01,
"M O N E Y   F L O W S   I N", globalColor("YellowGreen"), 1);
AddChartBubble(barNumber == (lastBar - 2*flowLabelStep), 1.01,
"M O N E Y   F L O W S   I N", globalColor("YellowGreen"), 1);
#mAddChartBubble(barNumber == (lastBar - 3*flowLabelStep), 1.01,
#"M O N E Y   F L O W S   I N", globalColor("YellowGreen"), 1);

DefineGlobalColor("Cinamon", CreateColor(200, 10, 40));
AddChartBubble(barNumber == (lastBar - flowLabelStep), -0.01,
"M O N E Y   F L O W S   O U T", globalColor("Cinamon"), 0);
AddChartBubble(barNumber == (lastBar - 2*flowLabelStep), -0.01,
"M O N E Y   F L O W S   O U T", globalColor("Cinamon"), 0);
#mAddChartBubble(barNumber == (lastBar - 3*flowLabelStep), -0.01,
#m"M O N E Y   F L O W S   O U T", globalColor("Cinamon"), 0);

#plot zero = if isNaN(close) then double.nan else 0;
plot zero = if barNumber > (lastBar + 7) then double.nan else 0;
zero.SetDefaultColor(createColor(90, 20, 20));
zero.SetStyle(Curve.Long_Dash);
zero.SetLineWeight(5);
zero.HideBubble();
plot one = if barNumber > (lastBar + 7) then double.nan else 1;
one.SetDefaultColor(createColor(20, 70, 20));
one.SetStyle(Curve.Long_Dash);
one.SetLineWeight(5);
one.HideBubble();
#EOC

SectorRotate_ED_NN
 

Attachments

  • Dsy0J1F.png
    Dsy0J1F.png
    322.2 KB · Views: 385
Last edited by a moderator:

Join useThinkScript to post your question to a community of 21,000+ developers and traders.

Hi, very remarkable style of graph but I have a simple question for those more experienced on sector rotation: how the information it provides can help to make money decisions that can also be done on simple individual technical analysis? to me it only makes sense to look at it collectively if i would need to choose only 1 or 2 candidates of the 9 candidates to bet on like in a horse track selecting the fastest candidate. I would appreciate if anyone here can tell me if there is other type of consideration that might make this useful?

The reason I am asking this is because along the years I have looked for many indicators that can compensate my lack of visual perception to make money decisions and my mind is overcrowded with possibilities though I know only a few indicators are needed and the rest just creates noise that can do more harm than good.
 
Hi @apdusp it's for the visual learner like me. Take a look at that chart on a weekly TF and you'll see the Rotation. I would move money into what is moving up and rotating out of what is dropping. That chart is not finished however, it still needs more makeup & purty labels. It definitely is too noisy on a daily time frame. Ideally, this is a starting point, from here I would go to the leading sector and find the leading stocks. Good Question.
 
Pretty cool idea. I have nothing useful to add, other than this picture. Changed the lines to histogram style bars and it lets you view it kind of like a Thermo mode, it makes it a little easier for me to visualize this way. I might change the coloring a bit also to make each sector a little easier to identify while hovering over them. I know in the screenshot the labels appear to be blocking the top right corner, however if I put my mouse there they disappear and I can see it.

Edit: thank you for posting this sir!

1 year / 1 day chart

4efg5sB.jpg


10 Days / 1 day chart

vaVd9hi.jpg
 
Last edited:
This is the original coloring I only changed PaintingStatagey to Histogram
This was done on stoch1 through stoch9

Also please note in my screenshots above the White and Black lines I thought were Beta1 and Beta2, However I had just forgotten to change two of the stoch lines to the Histogram PaintingStratagey.

Code:
# beta_rotation_v2
#ETF_Rotate_Lower_ED_nn 4-2019
# from 4/4/2019 chat room:
# 06:37 Mobius: johnny - To find rotation quickly - Use primary ETF's in a watchlist with 2 columns first column is Correlation to SPX second is a stochastic of Beta, if Beta is 1 or close to 1 that ETF is moving at the fastest momentum in that range and if correlation is with SPX .85 or better it's moving with SPX cor# daily start with 13,34 as starting point
#markos #took out out Beta 1 & 2 4-19-19 # Put Back in 6-23-19

declare lower;

input BetaLength = 21;
input StochLength =34;
input showBeta = No;
input showOverlay = Yes;

input Cyclicals      = "XLY";
input Technology     = "XLK";
input Industrials    = "XLI";
input Materials      = "XLB";
input Energy         = "XLE";
input Staples        = "XLP";
input HealthCare     = "XLV";
input Utilities      = "XLU";
input Financials     = "XLF";

#------------------------------
#----purple colors
defineglobalColor(“PlumMedium“, createColor(221, 160, 221));
defineglobalColor(“Orchid“, createColor(218, 130, 214));
defineglobalColor(“MediumOrchid“, createColor(186, 85, 211));
defineglobalColor(“MediumPurple“, createColor(147, 112, 219));
defineglobalColor(“DarkOrchid“, createColor(153, 50, 204));


plot Scriptlabel = Double.NaN;
Scriptlabel.SetDefaultColor(CreateColor (0, 0, 0));

def Agg = GetAggregationPeriod();

#--------------------date start
addLabel(1,  getMonth() + "/" +
             getDayOfMonth(getYyyyMmDd()) + "/" +
             AsPrice(getYear()), GlobalColor("PlumMedium"));
#--------------------date end

#addLabel(1, " Ticker: '" + GetSymbol() + "' ", GlobalColor("Orchid"));

addLabel(1, "Agg: " +
              ( if Agg == 60000 then "1 Min"
           else if Agg == 120000 then "2 Min"
           else if Agg == 180000 then "3 Min"
           else if Agg == 240000 then "4 Min"
           else if Agg == 300000 then "5 Min"
           else if Agg == 600000 then "10 Min"
           else if Agg == 900000 then "15 Min"
           else if Agg == 1800000 then "30 Min"
           else if Agg == 3600000 then "1 Hour"
           else if Agg == 7200000 then "2 Hour"
           else if Agg == 14400000 then "4 Hours"
           else if Agg == 86400000 then "1 Day"
           else if Agg == 604800000 then "1 Week"
           else if Agg == 2592000000 then "1 Month"
           else  (Agg / 1000 / 60) + "Minutes")  +
           " (" + (if Agg<=23400000
                   then 23400000/Agg
                   else 86400000/Agg)+ ")"
          , GlobalColor("MediumPurple"));
#addLabel(1, BarNumber() + " Bars", GlobalColor("DarkOrchid"));

#-----------------------------
#-----------------------------

addLabel(1,"Rotation Beta/Stochastic (" + betaLength + "," +stochLength + ") ", color.Light_Gray);


script calcBeta {
  input secondSymbol = "XLF";
  input refSymbol = "SPX";
  input betaLength = 21;
  input returnLength = 1;

  def refPrice = close(refSymbol);
  def primary = if refPrice[returnLength] == 0
                then 0
                else (refPrice - refPrice[returnLength]) /
                      refPrice[returnLength] * 100;
  def secondPrice = close(secondSymbol);
  def secondary = if secondPrice[returnLength] == 0
                  then 0
                  else (secondPrice - secondPrice[returnLength]) /
                        secondPrice[returnLength] * 100;
  plot Beta = covariance(secondary, primary, betaLength) /
                         Sqr(stdev(primary, betaLength));
}

script EhlersESSfilter {
    input price = close;
    input length = 8;
    def ESS_coeff_0 = Exp(-Double.Pi * Sqrt(2) / length);
    def ESS_coeff_2 = 2 * ESS_coeff_0 * Cos(Sqrt(2) * Double.Pi / length);
    def ESS_coeff_3 = - Sqr(ESS_coeff_0);
    def ESS_coeff_1 = 1 - ESS_coeff_2 - ESS_coeff_3;
    def ESS_filter = if IsNaN(price + price[1]) then
                      ESS_filter[1]
                 else ESS_coeff_1 * (price + price[1]) / 2 +
                      ESS_coeff_2 * ESS_filter[1] +
                      ESS_coeff_3 * ESS_filter[2];
    plot Smooth_Filter =
         if barnumber() <  length then
              price
         else if !IsNaN(price) then
              ESS_filter
         else Double.NaN;
}

script calcStoch {
  input data = close;
  input StochLength = 21;
  def stochasticValue = ((data - lowest(data, StochLength)) /
                         (highest(data, StochLength) - lowest(data, StochLength)));
  plot stoch = stochasticValue;
}

plot beta1 = if showBeta then calcBeta(Cyclicals) else Double.NaN;
plot beta2 = if showBeta then calcBeta(Technology) else Double.NaN;

####
plot stoch1 = calcStoch(
                        data = EhlersESSfilter(
                               calcBeta(secondSymbol = Cyclicals,
                               betaLength = BetaLength)),
                                     stochLength = StochLength);
stoch1.SetDefaultColor(Color.VIOLET);
stoch1.SetLineWeight(2);

#Changed PaintingStatagey to HISTOGRAM
#This was done on stoch1 through stoch9
stoch1.SetPaintingStrategy(PaintingStrategy.HISTOGRAM);
stoch1.HideBubble();
AddLabel(ShowOverlay, " Cyclicals ", Color.VIOLET);
AddChartBubble(ShowOverlay and IsNaN(close[-1]) and !IsNaN(close), if stoch1 < 0.15 then 0 else if stoch1 > 0.85 then 1 else stoch1, "Cyclicals", Color.VIOLET, stoch1 > 0.5);

plot stoch2 = calcStoch(
                        data = EhlersESSfilter(
                               calcBeta(secondSymbol = Technology,
                               betaLength = BetaLength)),
                                     stochLength = StochLength);
stoch2.SetDefaultColor(CreateColor(90, 160, 120));
stoch2.SetLineWeight(5);
stoch2.SetPaintingStrategy(PaintingStrategy.HISTOGRAM);
stoch2.HideBubble();
AddLabel(ShowOverlay, " Techology ", CreateColor(90, 160, 120));
AddChartBubble(ShowOverlay and IsNaN(close[-1]) and !IsNaN(close), if stoch2 < 0.15 then 0 else if stoch2 > 0.85 then 1 else stoch2, "Technology", CreateColor(90, 160, 120), stoch2 > 0.5);

plot stoch3 = calcStoch(
                        data = EhlersESSfilter(
                               calcBeta(secondSymbol = Industrials,
                               betaLength = BetaLength)),
                                     stochLength = StochLength);
stoch3.SetDefaultColor(Color.MAGENTA);
stoch3.SetLineWeight(5);
stoch3.SetPaintingStrategy(PaintingStrategy.HISTOGRAM);
stoch3.HideBubble();
AddLabel(ShowOverlay, " Industrials ", Color.MAGENTA);
AddChartBubble(ShowOverlay and IsNaN(close[-1]) and !IsNaN(close), if stoch3 < 0.15 then 0 else if stoch3 > 0.85 then 1 else stoch3, "Industrials", Color.MAGENTA, stoch3 > 0.5);

plot stoch4 = calcStoch(
                        data = EhlersESSfilter(
                               calcBeta(secondSymbol = Materials,
                               betaLength = BetaLength)),
                                     stochLength = StochLength);
stoch4.SetDefaultColor(Color.CYAN);
stoch4.SetLineWeight(2);
stoch4.SetPaintingStrategy(PaintingStrategy.HISTOGRAM);
stoch4.HideBubble();
AddLabel(ShowOverlay, " Materials ", Color.CYAN);
AddChartBubble(ShowOverlay and IsNaN(close[-1]) and !IsNaN(close), if stoch4 < 0.15 then 0 else if stoch4 > 0.85 then 1 else stoch4, "Materials", Color.CYAN, stoch4 > 0.5);

plot stoch5 = calcStoch(
                        data = EhlersESSfilter(
                               calcBeta(secondSymbol = Energy,
                               betaLength = BetaLength)),
                                     stochLength = StochLength);
stoch5.SetDefaultColor(Color.YELLOW);
stoch5.SetLineWeight(1);
stoch5.SetPaintingStrategy(PaintingStrategy.HISTOGRAM);
stoch5.HideBubble();
AddLabel(ShowOverlay, " Energy ", Color.YELLOW);
AddChartBubble(ShowOverlay and IsNaN(close[-1]) and !IsNaN(close), if stoch5 < 0.15 then 0 else if stoch5 > 0.85 then 1 else stoch5, "Energy", Color.YELLOW, stoch5 > 0.5);

plot stoch6 = calcStoch(
                        data = EhlersESSfilter(
                               calcBeta(secondSymbol = Staples,
                               betaLength = BetaLength)),
                                     stochLength = StochLength);
stoch6.SetDefaultColor(CreateColor(80, 180, 70));
stoch6.SetLineWeight(2);
stoch6.SetPaintingStrategy(PaintingStrategy.HISTOGRAM);
stoch6.HideBubble();
AddLabel(ShowOverlay, " Staples ", CreateColor(80, 180, 70));
AddChartBubble(ShowOverlay and IsNaN(close[-1]) and !IsNaN(close), if stoch6 < 0.15 then 0 else if stoch6 > 0.85 then 1 else stoch6, "Staples", CreateColor(80, 180, 70), stoch6 > close);

plot stoch7 = calcStoch(
                        data = EhlersESSfilter(
                               calcBeta(secondSymbol = HealthCare,
                               betaLength = BetaLength)),
                                     stochLength = StochLength);
stoch7.SetDefaultColor(CreateColor(180, 80, 180));
stoch7.SetLineWeight(4);
stoch7.SetPaintingStrategy(PaintingStrategy.HISTOGRAM);
stoch7.HideBubble();
AddLabel(ShowOverlay, " HealthCare ", CreateColor(180, 80, 180));
AddChartBubble("time condition" = ShowOverlay and IsNaN(close[-1]) and !IsNaN(close), "price location" = if stoch7 < 0.15 then 0 else if stoch7 > 0.85 then 1 else stoch7, text = "HealthCare", color = CreateColor(180, 80, 180), stoch7 > 0.5);

plot stoch8 = calcStoch(
                        data = EhlersESSfilter(
                               calcBeta(secondSymbol = Utilities,
                               betaLength = BetaLength)),
                                     stochLength = StochLength);
stoch8.SetDefaultColor(Color.ORANGE);
stoch8.SetLineWeight(2);
stoch8.SetPaintingStrategy(PaintingStrategy.HISTOGRAM);
stoch8.HideBubble();
AddLabel(ShowOverlay, " Utilities ", Color.ORANGE);
AddChartBubble(ShowOverlay and IsNaN(close[-1]) and !IsNaN(close[0]), if stoch8 < 0.15 then 0 else if stoch8 > 0.85 then 1 else stoch8, "Utilities", Color.ORANGE, stoch8 > 0.5);

plot stoch9 = calcStoch(
                        data = EhlersESSfilter(
                               calcBeta(secondSymbol = Financials,
                               betaLength = BetaLength)),
                                     stochLength = StochLength);
stoch9.SetDefaultColor(Color.PINK);
stoch9.SetLineWeight(2);
stoch9.SetPaintingStrategy(PaintingStrategy.HISTOGRAM);
stoch9.HideBubble();
AddLabel(ShowOverlay, " Financials ", Color.PINK);
AddChartBubble(ShowOverlay and IsNaN(close[-1]) and !IsNaN(close), if stoch9 < 0.15 then 0 else if stoch9 > 0.85 then 1 else stoch9, "Financials", Color.PINK, stoch9 > 0.5);

#----------------------------------------------
def barNumber = BarNumber();
def endBar = if !IsNaN(close) and IsNaN(close[-1]) then barNumber else endBar[1];
def lastBar = HighestAll(endBar);
input flowLabelStep = 40;
addLabel(1,"Last Bar = " + lastBar, color.Light_Gray);
DefineGlobalColor("YellowGreen", CreateColor(90, 140, 5));
AddChartBubble(barNumber == (lastBar - flowLabelStep), 1.01,
"M O N E Y   F L O W S   I N", globalColor("YellowGreen"), 1);
AddChartBubble(barNumber == (lastBar - 2*flowLabelStep), 1.01,
"M O N E Y   F L O W S   I N", globalColor("YellowGreen"), 1);
#mAddChartBubble(barNumber == (lastBar - 3*flowLabelStep), 1.01,
#"M O N E Y   F L O W S   I N", globalColor("YellowGreen"), 1);

DefineGlobalColor("Cinamon", CreateColor(200, 10, 40));
AddChartBubble(barNumber == (lastBar - flowLabelStep), -0.01,
"M O N E Y   F L O W S   O U T", globalColor("Cinamon"), 0);
AddChartBubble(barNumber == (lastBar - 2*flowLabelStep), -0.01,
"M O N E Y   F L O W S   O U T", globalColor("Cinamon"), 0);
#mAddChartBubble(barNumber == (lastBar - 3*flowLabelStep), -0.01,
#m"M O N E Y   F L O W S   O U T", globalColor("Cinamon"), 0);

#plot zero = if isNaN(close) then double.nan else 0;
plot zero = if barNumber > (lastBar + 7) then double.nan else 0;
zero.SetDefaultColor(createColor(90, 20, 20));
zero.SetStyle(Curve.Long_Dash);
zero.SetLineWeight(5);
zero.HideBubble();
plot one = if barNumber > (lastBar + 7) then double.nan else 1;
one.SetDefaultColor(createColor(20, 70, 20));
one.SetStyle(Curve.Long_Dash);
one.SetLineWeight(5);
one.HideBubble();
#EOC
 
This is very good. I am trying to verify the strategy. how to you take trades based on the chart and what is the time frame you use.

Example: 10Day/Day chart shows Utility/Staples on Top with Money flow Technology and Industrial shows at bottom.

so do you take Call on Utility and Staples? What is the best time frame in your view?

Please share results if you have back test any strategy
 
In the first picture I was on a 1 year / 1 day time frame. In that time frame each vertical bar is one day so really you would want to focus on the bar farthest to the right for the current day. Which looking back at the picture and using the farthest right bar I see the same indication as the 10 day / 1day chart.

I only posted the pictures to show an alternative way to view the data, but I do not know the best timeframe to view this on.
 
Hi @2sureshk Here at useThinkScript we don't generally give advice. This is not a strategy or an indicator.

That said, this was created as a way to find sector rotation. Once the top sectors are found, you would then look for stocks in that sector that are leading and place your trade according to your style.

We do not want to put the SPX price on the chart because 0 to 1 == worst performing to best performing sectors
I hope that helps.
 
Last edited:
thank you for the inputs .. I am looking for people experience on the usage . I have one finding that when a particular sector 1 or on top the Calls or up move is very quick and it seems to be profitable. If anyone experience the the same or feel fee to differ

thx

@mn88 Please help with XLRE real estate sector s also
 
My "cleaned up" version, that's easier on the eye ... at least my eye.

It also throws a label up whenever the Sector crosses 0.95 or 0.05.

loUzL0q.png


Code:
# ETF_Rotate_Lower by ED_nn ThinkScriptLounge 4-2019
# from 4/4/2019 chat room:
# 06:37 Mobius: johnny - To find rotation quickly - Use primary ETF's in a watchlist with 2 columns first column is Correlation to SPX second is a stochastic of Beta, if Beta is 1 or close to 1 that ETF is moving at the fastest momentum in that range and if correlation is with SPX .85 or better it's moving with SPX cor# daily start with 13,34 as starting point.
# 4-19-19 Markos took out Beta 1 & 2.
# 6-23-19 Markos put Beta back in

#declare lower;

input BetaLength = 21;
input StochLength = 34;
input showOverlay = yes;

input Cyclicals      = "XLY";
input Technology     = "XLK";
input Industrials    = "XLI";
input Materials      = "XLB";
input Energy         = "XLE";
input Staples        = "XLP";
input HealthCare     = "XLV";
input Utilities      = "XLU";
input Financials     = "XLF";
input Communications = "XTL";
input RealEstate     = "XLRE";

#-----------------------------

AddLabel(1, "R-Beta/Stoch (" + BetaLength + "," + StochLength + ") ", Color.LIGHT_GRAY);


script calcBeta {
    input secondSymbol = "XLF";
    input refSymbol = "SPX";
    input betaLength = 21;
    input returnLength = 1;

    def refPrice = close(refSymbol);
    def primary = if refPrice[returnLength] == 0
                then 0
                else (refPrice - refPrice[returnLength]) / refPrice[returnLength] * 100;
    def secondPrice = close(secondSymbol);
    def secondary = if secondPrice[returnLength] == 0
                  then 0
                  else (secondPrice - secondPrice[returnLength]) / secondPrice[returnLength] * 100;
    plot Beta = Covariance(secondary, primary, betaLength) / Sqr(StDev(primary, betaLength));
}

script EhlersESSfilter {
    input price = close;
    input length = 8;
    def ESS_coeff_0 = Exp(-Double.Pi * Sqrt(2) / length);
    def ESS_coeff_2 = 2 * ESS_coeff_0 * Cos(Sqrt(2) * Double.Pi / length);
    def ESS_coeff_3 = - Sqr(ESS_coeff_0);
    def ESS_coeff_1 = 1 - ESS_coeff_2 - ESS_coeff_3;
    def ESS_filter = if IsNaN(price + price[1]) then
                      ESS_filter[1]
                 else ESS_coeff_1 * (price + price[1]) / 2 +
                      ESS_coeff_2 * ESS_filter[1] +
                      ESS_coeff_3 * ESS_filter[2];
    plot Smooth_Filter =
         if BarNumber() <  length then
              price
         else if !IsNaN(price) then
              ESS_filter
         else Double.NaN;
}

script calcStoch {
    input data = close;
    input StochLength = 21;
    def stochasticValue = ((data - Lowest(data, StochLength)) / (Highest(data, StochLength) - Lowest(data, StochLength)));
    plot stoch = stochasticValue;
}

####

def upStochLimit = 0.95;
def lowStockLimit = 0.05;

plot stoch1 = calcStoch( data = EhlersESSfilter( calcBeta(secondSymbol = Cyclicals, betaLength = betaLength) ), stochLength = StochLength);
stoch1.SetDefaultColor(Color.VIOLET);
stoch1.SetPaintingStrategy(PaintingStrategy.LINE);
stoch1.HideBubble();
AddLabel(showOverlay, " XLY Cyclicals ", Color.VIOLET);
AddChartBubble(showOverlay and stoch1 <= lowStockLimit and stoch1[1] > lowStockLimit, 0, "XLY", Color.VIOLET, no);
AddChartBubble(showOverlay and stoch1 >= upStochLimit and stoch1[1] < upStochLimit, 1, "XLY", Color.VIOLET, yes);
AddChartBubble(showOverlay and stoch1 > lowStockLimit and stoch1[1] < upStochLimit and IsNaN(close[-1]) and !IsNaN(close), stoch1, "XLY", Color.VIOLET, stoch1 >= 0.5);

plot stoch2 = calcStoch( data = EhlersESSfilter( calcBeta(secondSymbol = Technology, betaLength = betaLength) ), stochLength = StochLength);
stoch2.SetDefaultColor(Color.GREEN);
stoch2.SetPaintingStrategy(PaintingStrategy.LINE);
stoch2.HideBubble();
AddLabel(showOverlay, " XLK Techology ", Color.GREEN);
AddChartBubble(showOverlay and stoch2 <= lowStockLimit and stoch2[1] > lowStockLimit, 0, "XLK", Color.GREEN, no);
AddChartBubble(showOverlay and stoch2 >= upStochLimit and stoch2[1] < upStochLimit, 1, "XLK", Color.GREEN, yes);
AddChartBubble(showOverlay and stoch2 > lowStockLimit and stoch2[1] < upStochLimit and IsNaN(close[-1]) and !IsNaN(close), stoch2, "XLK", Color.GREEN, stoch2 >= 0.5);

plot stoch3 = calcStoch( data = EhlersESSfilter( calcBeta(secondSymbol = Industrials, betaLength = betaLength) ), stochLength = StochLength);
stoch3.SetDefaultColor(Color.MAGENTA);
stoch3.SetPaintingStrategy(PaintingStrategy.LINE);
stoch3.HideBubble();
AddLabel(showOverlay, " XLI Industrials ", Color.MAGENTA);
AddChartBubble(showOverlay and stoch3 <= lowStockLimit and stoch3[1] > lowStockLimit, 0, "XLI", Color.MAGENTA, no);
AddChartBubble(showOverlay and stoch3 >= upStochLimit and stoch3[1] < upStochLimit, 1, "XLI", Color.MAGENTA, yes);
AddChartBubble(showOverlay and stoch3 > lowStockLimit and stoch3[1] < upStochLimit and IsNaN(close[-1]) and !IsNaN(close), stoch3, "XLI", Color.MAGENTA, stoch3 >= 0.5);

plot stoch4 = calcStoch( data = EhlersESSfilter( calcBeta(secondSymbol = Materials, betaLength = betaLength) ), stochLength = StochLength);
stoch4.SetDefaultColor(Color.CYAN);
stoch4.SetPaintingStrategy(PaintingStrategy.LINE);
stoch4.HideBubble();
AddLabel(showOverlay, " XLB Materials ", Color.CYAN);
AddChartBubble(showOverlay and stoch4 <= lowStockLimit and stoch4[1] > lowStockLimit, 0, "XLB", Color.CYAN, no);
AddChartBubble(showOverlay and stoch4 >= upStochLimit and stoch4[1] < upStochLimit, 1, "XLB", Color.CYAN, yes);
AddChartBubble(showOverlay and stoch4 > lowStockLimit and stoch4[1] < upStochLimit and IsNaN(close[-1]) and !IsNaN(close), stoch4, "XLB", Color.CYAN, stoch4 >= 0.5);

plot stoch5 = calcStoch( data = EhlersESSfilter( calcBeta(secondSymbol = Energy, betaLength = betaLength) ), stochLength = StochLength);
stoch5.SetDefaultColor(Color.YELLOW);
stoch5.SetPaintingStrategy(PaintingStrategy.LINE);
stoch5.HideBubble();
AddLabel(showOverlay, " XLE Energy ", Color.YELLOW);
AddChartBubble(showOverlay and stoch5 <= lowStockLimit and stoch5[1] > lowStockLimit, 0, "XLE", Color.YELLOW, no);
AddChartBubble(showOverlay and stoch5 >= upStochLimit and stoch5[1] < upStochLimit, 1, "XLE", Color.YELLOW, yes);
AddChartBubble(showOverlay and stoch5 > lowStockLimit and stoch5[1] < upStochLimit and IsNaN(close[-1]) and !IsNaN(close), stoch5, "XLE", Color.YELLOW, stoch5 >= 0.5);

plot stoch6 = calcStoch( data = EhlersESSfilter( calcBeta(secondSymbol = Staples, betaLength = betaLength) ), stochLength = StochLength);
stoch6.SetDefaultColor(Color.DARK_GREEN);
stoch6.SetPaintingStrategy(PaintingStrategy.LINE);
stoch6.HideBubble();
AddLabel(showOverlay, " XLP Staples ", CreateColor(80, 180, 70));
AddChartBubble(showOverlay and stoch6 <= lowStockLimit and stoch6[1] > lowStockLimit, 0, "XLP", Color.DARK_GREEN, no);
AddChartBubble(showOverlay and stoch6 >= upStochLimit and stoch6[1] < upStochLimit, 1, "XLP", Color.DARK_GREEN, yes);
AddChartBubble(showOverlay and stoch6 > lowStockLimit and stoch6[1] < upStochLimit and IsNaN(close[-1]) and !IsNaN(close), stoch6, "XLP", Color.DARK_GREEN, stoch6 >= 0.5);

plot stoch7 = calcStoch( data = EhlersESSfilter( calcBeta(secondSymbol = HealthCare, betaLength = betaLength) ), stochLength = StochLength);
stoch7.SetDefaultColor(Color.GRAY);
stoch7.SetPaintingStrategy(PaintingStrategy.LINE);
stoch7.HideBubble();
AddLabel(showOverlay, " XLV HealthCare ", CreateColor(180, 80, 180));
AddChartBubble(showOverlay and stoch7 <= lowStockLimit and stoch7[1] > lowStockLimit, 0, "XLV", Color.GRAY, no);
AddChartBubble(showOverlay and stoch7 >= upStochLimit and stoch7[1] < upStochLimit, 1, "XLV", Color.GRAY, yes);
AddChartBubble(showOverlay and stoch7 > lowStockLimit and stoch7[1] < upStochLimit and IsNaN(close[-1]) and !IsNaN(close), stoch7, "XLV", Color.GRAY, stoch7 >= 0.5);

plot stoch8 = calcStoch( data = EhlersESSfilter( calcBeta(secondSymbol = Utilities, betaLength = betaLength) ), stochLength = StochLength);
stoch8.SetDefaultColor(Color.ORANGE);
stoch8.SetPaintingStrategy(PaintingStrategy.LINE);
stoch8.HideBubble();
AddLabel(showOverlay, " XLU Utilities ", Color.ORANGE);
AddChartBubble(showOverlay and stoch8 <= lowStockLimit and stoch8[1] > lowStockLimit, 0, "XLU", Color.ORANGE, no);
AddChartBubble(showOverlay and stoch8 >= upStochLimit and stoch8[1] < upStochLimit, 1, "XLU", Color.ORANGE, yes);
AddChartBubble(showOverlay and stoch8 > lowStockLimit and stoch8[1] < upStochLimit and IsNaN(close[-1]) and !IsNaN(close), stoch8, "XLU", Color.ORANGE, stoch8 >= 0.5);

plot stoch9 = calcStoch( data = EhlersESSfilter( calcBeta(secondSymbol = Financials, betaLength = betaLength) ), stochLength = StochLength);
stoch9.SetDefaultColor(Color.PINK);
stoch9.SetPaintingStrategy(PaintingStrategy.LINE);
stoch9.HideBubble();
AddLabel(showOverlay, " XLF Financials ", Color.PINK);
AddChartBubble(showOverlay and stoch9 <= lowStockLimit and stoch9[1] > lowStockLimit, 0, "XLF", Color.PINK, no);
AddChartBubble(showOverlay and stoch9 >= upStochLimit and stoch9[1] < upStochLimit, 1, "XLF", Color.PINK, yes);
AddChartBubble(showOverlay and stoch9 > lowStockLimit and stoch9[1] < upStochLimit and IsNaN(close[-1]) and !IsNaN(close), stoch9, "XLF", Color.PINK, stoch9 >= 0.5);


plot stoch10 = calcStoch( data = EhlersESSfilter( calcBeta(secondSymbol = Communications, betaLength = betaLength) ), stochLength = StochLength);
stoch10.SetDefaultColor(Color.WHITE);
stoch10.SetPaintingStrategy(PaintingStrategy.LINE);
stoch10.HideBubble();
AddLabel(showOverlay, " XTL Communications ", Color.WHITE);
AddChartBubble(showOverlay and stoch10 <= lowStockLimit and stoch10[1] > lowStockLimit, 0, "XTL", Color.WHITE, no);
AddChartBubble(showOverlay and stoch10 >= upStochLimit and stoch10[1] < upStochLimit, 1, "XTL", Color.WHITE, yes);
AddChartBubble(showOverlay and stoch10 > lowStockLimit and stoch10[1] < upStochLimit and IsNaN(close[-1]) and !IsNaN(close), stoch10, "XTL", Color.WHITE, stoch10 >= 0.5);


plot stoch11 = calcStoch( data = EhlersESSfilter( calcBeta(secondSymbol = RealEstate, betaLength = betaLength) ), stochLength = StochLength);
stoch11.SetDefaultColor(Color.LIGHT_GREEN);
stoch11.SetPaintingStrategy(PaintingStrategy.LINE);
stoch11.HideBubble();
AddLabel(showOverlay, " XLRE RealEstate ", Color.LIGHT_GREEN);
AddChartBubble(showOverlay and stoch11 <= lowStockLimit and stoch11[1] > lowStockLimit, 0, "XLRE", Color.LIGHT_GREEN, no);
AddChartBubble(showOverlay and stoch11 >= upStochLimit and stoch11[1] < upStochLimit, 1, "XLRE", Color.LIGHT_GREEN, yes);
AddChartBubble(showOverlay and stoch11 > lowStockLimit and stoch11[1] < upStochLimit and IsNaN(close[-1]) and !IsNaN(close), stoch11, "XLRE", Color.LIGHT_GREEN, stoch11 >= 0.5);

plot upperLine = 0.80;
upperLine.SetDefaultColor(Color.GREEN);
plot lowerLine = 0.20;
lowerLine.SetDefaultColor(Color.RED);
 

Similar threads

Not the exact question you're looking for?

Start a new thread and receive assistance from our community.

87k+ Posts
341 Online
Create Post

Similar threads

Similar threads

The Market Trading Game Changer

Join 2,500+ subscribers inside the useThinkScript VIP Membership Club
  • Exclusive indicators
  • Proven strategies & setups
  • Private Discord community
  • ‘Buy The Dip’ signal alerts
  • Exclusive members-only content
  • Add-ons and resources
  • 1 full year of unlimited support

Frequently Asked Questions

What is useThinkScript?

useThinkScript is the #1 community of stock market investors using indicators and other tools to power their trading strategies. Traders of all skill levels use our forums to learn about scripting and indicators, help each other, and discover new ways to gain an edge in the markets.

How do I get started?

We get it. Our forum can be intimidating, if not overwhelming. With thousands of topics, tens of thousands of posts, our community has created an incredibly deep knowledge base for stock traders. No one can ever exhaust every resource provided on our site.

If you are new, or just looking for guidance, here are some helpful links to get you started.

What are the benefits of VIP Membership?
VIP members get exclusive access to these proven and tested premium indicators: Buy the Dip, Advanced Market Moves 2.0, Take Profit, and Volatility Trading Range. In addition, VIP members get access to over 50 VIP-only custom indicators, add-ons, and strategies, private VIP-only forums, private Discord channel to discuss trades and strategies in real-time, customer support, trade alerts, and much more. Learn all about VIP membership here.
How can I access the premium indicators?
To access the premium indicators, which are plug and play ready, sign up for VIP membership here.
Back
Top