The Moxie Indicator is a trading tool that helps traders identify market strength and potential moves in stocks. It can be used for options, futures, and stocks on any timeframe. Here are some ways to use the Moxie Indicator:
Buy and sell
Traders can buy when the indicator crosses above zero and the price is above its SMA(50). They can sell when the indicator crosses below zero and the price is below its SMA(50).
Time entries and exits
The indicator can help traders identify when to enter and exit trades, including early signal detection.
Identify divergences
The indicator can help traders identify divergences and when a move is built on weakness.
Is there anything like the Moxie on the forum?
Last edited by a moderator:
New Indicator: Buy the Dip
Check out our Buy the Dip indicator and see how it can help you find profitable swing trading ideas. Scanner, watchlist columns, and add-ons are included.
I watched the handful of video Watkins posted since Dec 2 to get a feel for how he's using Moxie and the other indicators and to learn his strategies. It seems he mostly isn't entering a trade quickly after Moxie triggers but often waiting for a pullback to a moving average or other support. Anecdotally, other types of triggers that occur immediately after the Moxie trigger look like they usually work though frequently go up a few ATR and then pull back all the way to entry before continuing higher.
I'd recommend watching a couple of his videos to get a feel for how he's trading with these indicators. Here's Simpler Trading's youtube channel filtered to show just Watkins videos. https://www.youtube.com/c/SimplerTrading/search?query=watkins
I set up some charts matching his to make it easier to follow along in TOS while watching his videos. If anyone's interested in mimicking the rest of his indicators:
For 15m, 1h, 1D, 1W he's using:
8 and 21 EMA (cyan and reddish)
50 and 200 SMA (magenta and salmon-ish)
Two sets of Keltner channels.
1) One with either 1.5 or 2.0 factor (gray dashed lines)
2) One with factor of 3.0 (light gray dashed lines)
SqueezePro. Can use TOS's built in TTM_Squeeze or a clone from this forum. He doesn't use squeeze in his strategy.
StochasticSlow (not on 15m chart) with k=12 and d=3 and those plots are green and dark gray
Volume is set to overlapping and dark gray
He set his candle colors to light gray for both up and down candles
On weekly he's also got 30 SMA as green.
Sometimes I notice dark gray horizontal lines on his daily, weekly and monthly charts. I'm not sure if those are drawings or if it's VolumeProfile. If it's VolumeProfile, set "on expansion" to no. Set POC, VAHigh and VALow colors to gray. In the Globals at the bottom, set all 3 colors to match your chart's background (black in my case).
On monthly charts he uses just the 10 SMA (cyan) and 50 SMA (magenta). The lower study on that chart is only there to make that chart's scaling feel like the others versus having no lower studies. He doesn't use that lower study so you can put whatever you want there.
It turns out Watkins had his own YouTube channel for Moxie before he joined Simpler Trading and in those old videos he's less secretive about what he shares. Some of those videos would have made reverse engineering the indicator easier, but oh well. At least they help with defining the strategies. You can find those videos here: https://www.youtube.com/c/MoxieTrader/playlists
Here's my final code all cleaned up. Since Watkins only uses the second line on 15m charts, in order to avoid impacting performance on other timeframes I made it use the current timeframe's data to calculate the second line. The second line is useless now on other timeframes. It will be the same as first line. If we're following the Moxie strategy we don't need the second line on other timeframes anyway.
When you're switching through symbols and trying to scan with your eyes across multiple charts quickly the zero line can be hard to notice when it's at the top or bottom. I added a label to the lower study so it's easier to see, at a glance, if a particular timeframe is above (green) or below (red) zero. I was thinking about also creating an MTF study to add labels for higher timeframes so if you're maximized on the 1H chart you can still see if Moxie is above zero on D and W charts.
That said, I'm setting Moxie aside for now while I do some testing with a Squeeze Pro clone. I'm keeping the Moxie lower study on my charts for now as the only visible momentum indicator since I've customized Squeeze Pro to give signal arrows when both its built in momentum and the TTM_Wave move together in the same direction. I may or may not keep Moxie along with Squeeze Pro depending on if it's redundant or if it's later to correctly signal direction changes.
declare upper;

def currentAggPeriod = GetAggregationPeriod();
def higherAggPeriod =
  if currentAggPeriod <= AggregationPeriod.TWO_MIN then AggregationPeriod.FIVE_MIN
  else if currentAggPeriod <= AggregationPeriod.THREE_MIN then AggregationPeriod.TEN_MIN
  else if currentAggPeriod <= AggregationPeriod.FIVE_MIN then AggregationPeriod.FIFTEEN_MIN
  else if currentAggPeriod <= AggregationPeriod.TEN_MIN then AggregationPeriod.THIRTY_MIN
  else if currentAggPeriod <= AggregationPeriod.FIFTEEN_MIN then AggregationPeriod.HOUR
  else if currentAggPeriod <= AggregationPeriod.THIRTY_MIN then AggregationPeriod.TWO_HOURS
  else if currentAggPeriod <= AggregationPeriod.TWO_HOURS then AggregationPeriod.DAY
  else if currentAggPeriod <= AggregationPeriod.FOUR_HOURS then AggregationPeriod.TWO_DAYS
  else if currentAggPeriod <= AggregationPeriod.DAY then AggregationPeriod.WEEK
  else if currentAggPeriod <= AggregationPeriod.WEEK then AggregationPeriod.MONTH
  else AggregationPeriod.QUARTER
;

script MoxieFunc {
  input price = close;
  def vc1 = ExpAverage(price, 12) - ExpAverage(price , 26);
  def va1 = ExpAverage(vc1, 9);
  plot data = (vc1 - va1) * 3;
}

def price =
  if currentAggPeriod == AggregationPeriod.FIFTEEN_MIN then high(period = higherAggPeriod)
  else close(period = higherAggPeriod)
;
def Moxie = MoxieFunc(price);

def longTrigger = if Moxie > 0 and Moxie[1] <= 0 then Moxie else Double.NaN;
def longArrowPosition =
  # first arrow
  if Moxie == longTrigger and Moxie != Moxie[1] then low
  # consecutive arrows at same position
  else if Moxie == longTrigger and Moxie == Moxie[1] then longArrowPosition[1]
  else Double.NaN;
plot long = longArrowPosition;
long.SetPaintingStrategy(PaintingStrategy.ARROW_UP);
long.SetDefaultColor(Color.GREEN);
long.SetLineWeight(3);
long.HideBubble();
long.HideTitle();

def shortTrigger = if Moxie < 0 and Moxie[1] >= 0 then Moxie else Double.NaN;
def shortArrowPosition =
  # first arrow
  if Moxie == shortTrigger and Moxie != Moxie[1] then high
  # consecutive arrows at same position
  else if Moxie == shortTrigger and Moxie == Moxie[1] then shortArrowPosition[1]
  else Double.NaN;
plot short = shortArrowPosition;
short.SetPaintingStrategy(PaintingStrategy.ARROW_DOWN);
short.SetDefaultColor(Color.LIGHT_RED);
short.SetLineWeight(3);
short.HideBubble();
short.HideTitle();
And here's the Moxie lower study
Ruby:
declare lower;

input showVerticalLines = yes;
input showTrampolines = yes;

plot ZeroLine = 0;
ZeroLine.SetDefaultColor(Color.GRAY);
ZeroLine.HideBubble();
ZeroLine.HideTitle();

def currentAggPeriod = GetAggregationPeriod();
def higherAggPeriod =
  if currentAggPeriod <= AggregationPeriod.TWO_MIN then AggregationPeriod.FIVE_MIN
  else if currentAggPeriod <= AggregationPeriod.THREE_MIN then AggregationPeriod.TEN_MIN
  else if currentAggPeriod <= AggregationPeriod.FIVE_MIN then AggregationPeriod.FIFTEEN_MIN
  else if currentAggPeriod <= AggregationPeriod.TEN_MIN then AggregationPeriod.THIRTY_MIN
  else if currentAggPeriod <= AggregationPeriod.FIFTEEN_MIN then AggregationPeriod.HOUR
  else if currentAggPeriod <= AggregationPeriod.THIRTY_MIN then AggregationPeriod.TWO_HOURS
  else if currentAggPeriod <= AggregationPeriod.TWO_HOURS then AggregationPeriod.DAY
  else if currentAggPeriod <= AggregationPeriod.FOUR_HOURS then AggregationPeriod.TWO_DAYS
  else if currentAggPeriod <= AggregationPeriod.DAY then AggregationPeriod.WEEK
  else if currentAggPeriod <= AggregationPeriod.WEEK then AggregationPeriod.MONTH
  else AggregationPeriod.QUARTER
;

script MoxieFunc {
  input price = close;
  def vc1 = ExpAverage(price, 12) - ExpAverage(price , 26);
  def va1 = ExpAverage(vc1, 9);
  plot data = (vc1 - va1) * 3;
}

# Watkins uses the high for 15m charts and the close for other timeframes
def price =
  if currentAggPeriod == AggregationPeriod.FIFTEEN_MIN
  then high(period = higherAggPeriod)
  else close(period = higherAggPeriod)
;

plot Moxie = MoxieFunc(price);
Moxie.SetLineWeight(2);
Moxie.DefineColor("Up", Color.GREEN);
Moxie.DefineColor("Down", Color.RED);
def lastChange = if Moxie < Moxie[1] then 1 else 0;
Moxie.AssignValueColor(
  if lastChange == 1 then Moxie.Color("Down")
  else Moxie.Color("Up")
);

# Watkins uses a different setup for Moxie on his 15 minute charts.
# He uses two lines derived from two higher timeframes.
# We'll hide the second Moxie line by default. You should enable it
# on 15 minute charts.
# For timeframes other than 15 minutes we'll use the same data as
# first Moxie line to reduce data requested from the server and
# improve performance.
def secondAggPeriod =
  if currentAggPeriod == AggregationPeriod.FIFTEEN_MIN
  then AggregationPeriod.TWO_HOURS
  else currentAggPeriod
;

plot MoxieSecondLine =
  if currentAggPeriod == AggregationPeriod.FIFTEEN_MIN
  # on the next line it seems like we should be able to use AggregationPeriod.TWO_HOURS
  # instead of the secondAggPeriod variable holding that value but for some reason that
  # causes the main Moxie plot on 1 hour chart to render nothing.
  then MoxieFunc(high(period = secondAggPeriod))
  else Double.NaN
;

MoxieSecondLine.SetLineWeight(2);
MoxieSecondLine.DefineColor("Up", Color.GREEN);
MoxieSecondLine.DefineColor("Down", Color.RED);
def lastChangeSecondLine = if MoxieSecondLine < MoxieSecondLine[1] then 1 else 0;
MoxieSecondLine.AssignValueColor(
  if lastChangeSecondLine == 1 then MoxieSecondLine.Color("Down")
  else MoxieSecondLine.Color("Up")
);
MoxieSecondLine.Hide();

# Show vertical lines at crossovers
AddVerticalLine(showVerticalLines and Moxie[1] <= 0 and Moxie > 0, "", CreateColor(0,150,0), Curve.SHORT_DASH);
AddVerticalLine(showVerticalLines and Moxie[1] >= 0 and Moxie < 0, "", CreateColor(200,0,0), Curve.SHORT_DASH);

# Indicate the Trampoline setup
def sma50 = Average(close, 50);
plot Trampoline =
  if showTrampolines and ((Moxie < -.01 and close > sma50) or (Moxie > .01 and close < sma50))
  then 0
  else Double.NaN
;
Trampoline.SetPaintingStrategy(PaintingStrategy.SQUARES);
Trampoline.DefineColor("Bullish", Color.LIGHT_GREEN);
Trampoline.DefineColor("Bearish", Color.PINK);
Trampoline.AssignValueColor(if close > sma50 then Trampoline.Color("Bearish") else Trampoline.Color("Bullish"));
Trampoline.HideBubble();
Trampoline.HideTitle();

AddLabel(
  yes,
  if currentAggPeriod == AggregationPeriod.WEEK then " W "
  else if currentAggPeriod == AggregationPeriod.Day then " D "
  else if currentAggPeriod == AggregationPeriod.HOUR then " H "
  else if currentAggPeriod == AggregationPeriod.FIFTEEN_MIN then " 15 "
  else " ",
  if Moxie < 0 then Color.RED else Color.GREEN
);
No, there's not. And you wouldn't want that anyway unless you like to lose money. The strategy isn't as simple as just entering when you get the signal. You should watch some videos here to learn the strategy: https://www.youtube.com/channel/UCFfJ8sb-sXpaQhvd28G_qMg And due to the subjective nature of how to enter trades from those signals, depending a lot on chart patterns, it's not something that could easily be scripted for back-testing.
I finally signed up so I can help out with this. I'm looking to combine some indicators for swing entries and Moxie looks pretty good. This Moxie clone seems to be working almost perfectly on the timeframes TG Watkins uses except for 15m. Even with the latest code above, which adds the second line, the plots are very far from correct. I don't think either of his two plots are using the same averages we're using on other timeframes.
Watkins posted another video on Jan 20 we can use to compare. I was looking just at GLD to play around with the averages trying to mimic his results but I gave up after a while. He has GLD on screen near the end of the video around the 29 minute mark. It's also while looking at GLD that he explains how he uses the two lines.
I found a help page at Simpler on how to configure Moxie but unfortunately it doesn't have any inputs, just colors. For now I'm thinking of using 30m rather than 15m since he clearly felt the default settings aren't good for 15m.
Here's a study I created to add the trigger arrows in the price chart.
Ruby:
# modified to show arrows in price chart
declare upper;

def AP = GetAggregationPeriod();

def ap1;
if (ap == aggregationPeriod.MIN){ap1=AggregationPeriod.five_Min; }
else if (ap == AggregationPeriod.three_MIN){ ap1=AggregationPeriod.five_Min;}
else if (ap == AggregationPeriod.five_Min) {ap1=AggregationPeriod.fifteen_Min;}
else if (ap == AggregationPeriod.fifteen_Min) {ap1=AggregationPeriod.hour;}
else if (ap == AggregationPeriod.thirty_Min) {ap1= AggregationPeriod.hour;}
else if (ap == AggregationPeriod.hour) {ap1=AggregationPeriod.DAY;}
else if (ap == AggregationPeriod.TWO_HOURS) {ap1=AggregationPeriod.DAY;}
else if (ap == AggregationPeriod.FOUR_HOURS) {ap1=AggregationPeriod.DAY;}
else if (ap == AggregationPeriod.DAY) {ap1=AggregationPeriod.WEEK;}
else if (ap == AggregationPeriod.WEEK) {ap1=AggregationPeriod.MONTH;}
else {ap1=AggregationPeriod.DAY;}

script MoxieFunc {
    input priceC = close;
    def vc1 = ExpAverage(priceC , 12) - ExpAverage(priceC , 26);
    def va1 = ExpAverage(vc1, 9);
    plot sData = (vc1 - va1) * 3;
}

def price = close(period = ap1);
def s2 = MoxieFunc(price);
def Moxie = s2;

def longMoxie = if Moxie[1] <= 0 and Moxie > 0 then Moxie else Double.NaN;
def longHeight = if Moxie[1] <= 0 and Moxie > 0 then low[1] else Double.NaN;

def b = if Moxie == longMoxie and Moxie == Moxie[1] then b[1]
  else if Moxie == longMoxie then low
  else Double.NaN;
plot buy = b;
buy.SetPaintingStrategy(PaintingStrategy.ARROW_UP);
buy.SetDefaultColor(Color.GREEN);
buy.SetLineWeight(3);
buy.HideBubble();
buy.HideTitle();

def shortMoxie = if Moxie[1] >= 0 and Moxie < 0 then Moxie else Double.NaN;
def s = if Moxie == shortMoxie and Moxie == Moxie[1] then s[1]
  else if Moxie == shortMoxie then high
  else Double.NaN;
plot sell = s;
sell.SetPaintingStrategy(PaintingStrategy.ARROW_DOWN);
sell.SetDefaultColor(Color.LIGHT_RED);
sell.SetLineWeight(3);
sell.HideBubble();
sell.HideTitle();
Here's the lower study with my modifications to mimic the real Moxie's colors. This doesn't have the changes for two lines on 15m. I also added vertical lines at the trigger points to make it easier to see where it crossed over the zero line if not using the upper study with the arrows. And I added a plot on the zero line to show where conditions are met for what Watkins calls the "trampoline move" or "trampoline setup".
Ruby:
declare lower;

def AP = GetAggregationPeriod();

def ap1;
if (ap == aggregationPeriod.MIN){ap1=AggregationPeriod.five_Min; }
else if (ap == AggregationPeriod.three_MIN){ ap1=AggregationPeriod.five_Min;}
else if (ap == AggregationPeriod.five_Min) {ap1=AggregationPeriod.fifteen_Min;}
else if (ap == AggregationPeriod.fifteen_Min) {ap1=AggregationPeriod.thirty_min;}
else if (ap == AggregationPeriod.thirty_Min) {ap1= AggregationPeriod.hour;}
else if (ap == AggregationPeriod.hour) {ap1=AggregationPeriod.DAY;}
else if (ap == AggregationPeriod.TWO_HOURS) {ap1=AggregationPeriod.DAY;}
else if (ap == AggregationPeriod.FOUR_HOURS) {ap1=AggregationPeriod.DAY;}
else if (ap == AggregationPeriod.DAY) {ap1=AggregationPeriod.WEEK;}
else if (ap == AggregationPeriod.WEEK) {ap1=AggregationPeriod.MONTH;}
else {ap1=AggregationPeriod.DAY;}

script MoxieFunc {
    input priceC = close;
    def vc1 = ExpAverage(priceC , 12) - ExpAverage(priceC , 26);
    def va1 = ExpAverage(vc1, 9);
    plot sData = (vc1 - va1) * 3;
}

def price = close(period = ap1);
def s2 = MoxieFunc(price);

plot ZeroLine = 0;
ZeroLine.SetDefaultColor(Color.GRAY);

plot Moxie = s2;
Moxie.SetLineWeight(2);
Moxie.DefineColor("Up", Color.GREEN);
Moxie.DefineColor("Down", Color.RED);
def lastChange = if Moxie > Moxie[1] then 1 else 0;
Moxie.AssignValueColor(if lastChange == 1 then Moxie.Color("Up") else Moxie.Color("Down"));

# Show vertical lines at crossovers
AddVerticalLine(Moxie[1] <= 0 and Moxie > 0, "", Color.GREEN, Curve.SHORT_DASH);
AddVerticalLine(Moxie[1] >= 0 and Moxie < 0, "", Color.LIGHT_RED, Curve.SHORT_DASH);

# Indicate the Trampoline setup
def sma50 = SimpleMovingAvg(close, 50);
plot Trampoline = if ((Moxie < -0.1 and close > sma50) or (Moxie > 0.1 and close < sma50)) then 0 else Double.NaN;
Trampoline.SetPaintingStrategy(PaintingStrategy.SQUARES);
Trampoline.DefineColor("Bullish", Color.LIGHT_GREEN);
Trampoline.DefineColor("Bearish", Color.PINK);
Trampoline.AssignValueColor(if close > sma50 then Trampoline.Color("Bearish") else Trampoline.Color("Bullish"));
And here's code for scans to find symbols that are currently triggering. Note the comments regarding timeframes.
Ruby:
# because Moxie calculates from higher time frame
# to find daily entries, run this scan on weekly
# to find hourly entries, run this on daily
script Moxie {
    input priceC = close;
    def vc1 = ExpAverage(priceC , 12) - ExpAverage(priceC , 26);
    def va1 = ExpAverage(vc1, 9);
    plot sData = (vc1 - va1) * 3;
}
def m = Moxie();
def moxieUpArrow = m > 0 and m[1] <= 0;
plot scan = moxieUpArrow within 1 bars;
ruby thanks for the code . i have copied and paste indicator codes but where or how do you post scan codes ? i have never used tos scanner i dont know anything about it . thanks
@jtreedog this link will take you to a video tutorial on the use of the TOS scanner. https://usethinkscript.com/threads/how-to-use-thinkorswim-stock-hacker-scans.284/
Play w/ it some so you are comfortable w/ the various permutations. You can't break anything. You should be able to extrapolate the Moxie scan from there. If not, come back w/ screenshots and questions. HTH
Moxie's creator doesn't trade timeframes below 15m, which he uses for entries to swings that last days or weeks. He mentioned he has customers who use it on 5m and 2m charts but he didn't give any indication of different settings. In the code. I set it to use 5m as the higher timeframe it looks at when you're on a 1m or 2m chart. You shouldn't need to change anything but of course you can experiment with this line and to try other higher timeframes. This line controls it on both 1m and 2m charts.
Ruby:
if currentAggPeriod <= AggregationPeriod.TWO_MIN then AggregationPeriod.FIVE_MIN
You'll find Moxie repaints. It looks like a great signal when you're looking at charts but the truth is the signal doesn't show up until the higher timeframe triggers it which may be a few candles later than it looks like later and it may untrigger/retrigger many times before the higher timeframe candle closes and you have a final answer. Even then its creator doesn't trade it by going long/short from the trigger. It's more like a bias indication than a trigger.
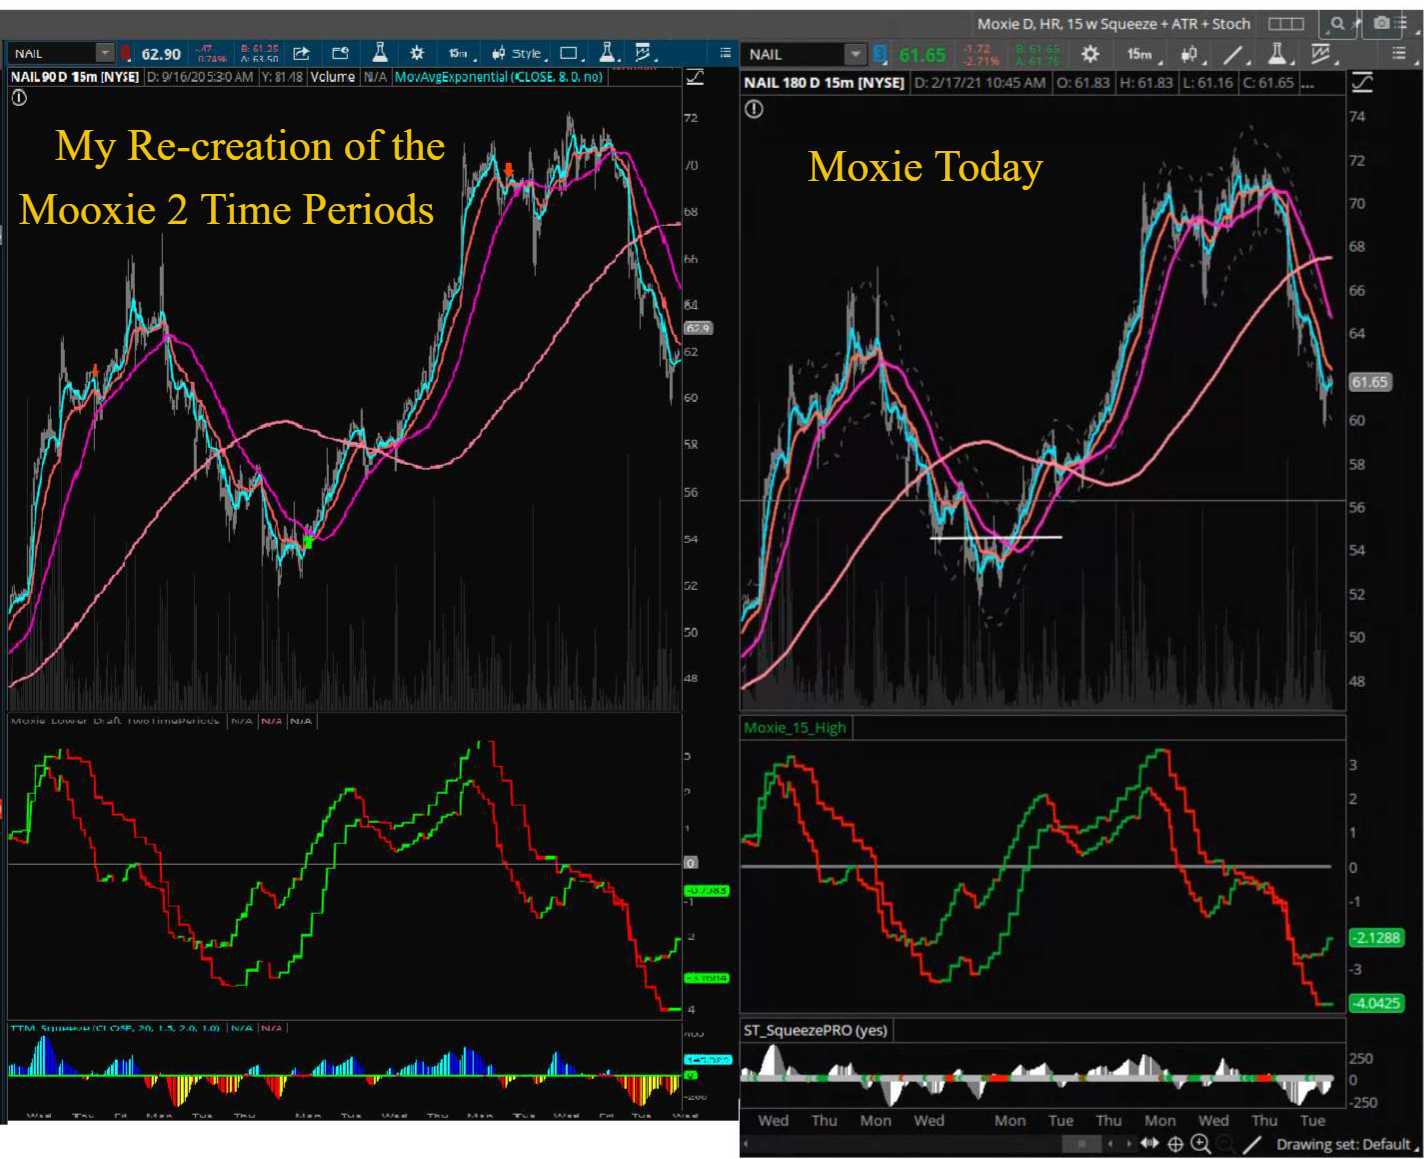
He's using the same calculations but getting them from 2 different timeframes -- the 1-hour and the 2-hour. He's also using the high rather than the close. I noticed his study name in the video is Moxie_15_High so that's what tipped me off for that part. I've got the code updated as well as a general cleanup/reformatting of the entire thing and I made the trampoline and the vertical lines configurable. Sorry to add code churn for those following along.
Now this will access two additional timeframes on every chart instead of just one. We probably should split this into two scripts like Simpler did, for performance reasons. I don't have time/ambition to do that right now but maybe before the weekend.
Anyway, here's the latest code. The second moxie line is hidden by default. You need to enable it on your 15m charts.
Ruby:
declare lower;

input showVerticalLines = yes;
input showTrampolines = yes;

plot ZeroLine = 0;
ZeroLine.SetDefaultColor(Color.GRAY);

def currentAggPeriod = GetAggregationPeriod();
def higherAggPeriod = if currentAggPeriod == AggregationPeriod.MIN then AggregationPeriod.FIVE_MIN
  else if currentAggPeriod == AggregationPeriod.THREE_MIN then AggregationPeriod.FIVE_MIN
  else if currentAggPeriod == AggregationPeriod.FIVE_MIN then AggregationPeriod.FIFTEEN_MIN
  else if currentAggPeriod == AggregationPeriod.FIFTEEN_MIN then AggregationPeriod.HOUR
  else if currentAggPeriod == AggregationPeriod.THIRTY_MIN then AggregationPeriod.HOUR
  else if currentAggPeriod == AggregationPeriod.HOUR then AggregationPeriod.DAY
  else if currentAggPeriod == AggregationPeriod.TWO_HOURS then AggregationPeriod.DAY
  else if currentAggPeriod == AggregationPeriod.FOUR_HOURS then AggregationPeriod.DAY
  else if currentAggPeriod == AggregationPeriod.DAY then AggregationPeriod.WEEK
  else if currentAggPeriod == AggregationPeriod.WEEK then AggregationPeriod.MONTH
  else AggregationPeriod.DAY
;

script MoxieFunc {
  input priceC = close;
  def vc1 = ExpAverage(priceC, 12) - ExpAverage(priceC , 26);
  def va1 = ExpAverage(vc1, 9);
  plot sData = (vc1 - va1) * 3;
}

# Watkins uses the high for 15m charts and close for other timeframes
def price = if currentAggPeriod == AggregationPeriod.FIFTEEN_MIN then high(period = higherAggPeriod) else close(period = higherAggPeriod);

plot Moxie = MoxieFunc(price);
Moxie.SetLineWeight(2);
Moxie.DefineColor("Up", Color.GREEN);
Moxie.DefineColor("Down", Color.RED);
def lastChange = if Moxie < Moxie[1] then 1 else 0;
Moxie.AssignValueColor(
  if lastChange == 1 then Moxie.Color("Down")
  else Moxie.Color("Up")
);

# Watkins uses a different setup for Moxie on his 15 minute charts.
# He uses two lines derived from 2 different higher timeframes.
# We'll hide the second Moxie line by default
def secondAggPeriod = if currentAggPeriod == AggregationPeriod.MIN then AggregationPeriod.FIFTEEN_MIN
  else if currentAggPeriod == AggregationPeriod.THREE_MIN then AggregationPeriod.FIFTEEN_MIN
  else if currentAggPeriod == AggregationPeriod.FIVE_MIN then AggregationPeriod.THIRTY_MIN
  else if currentAggPeriod == AggregationPeriod.FIFTEEN_MIN then AggregationPeriod.TWO_HOURS
  else if currentAggPeriod == AggregationPeriod.THIRTY_MIN then AggregationPeriod.TWO_HOURS
  else if currentAggPeriod == AggregationPeriod.HOUR then AggregationPeriod.TWO_DAYS
  else if currentAggPeriod == AggregationPeriod.TWO_HOURS then AggregationPeriod.TWO_DAYS
  else if currentAggPeriod == AggregationPeriod.FOUR_HOURS then AggregationPeriod.TWO_DAYS
  else if currentAggPeriod == AggregationPeriod.DAY then AggregationPeriod.MONTH
  else AggregationPeriod.YEAR
;

plot MoxieSecondLine = MoxieFunc(high(period = secondAggPeriod));
MoxieSecondLine.SetLineWeight(2);
MoxieSecondLine.DefineColor("Up", Color.GREEN);
MoxieSecondLine.DefineColor("Down", Color.RED);
def lastChangeSecondLine = if MoxieSecondLine < MoxieSecondLine[1] then 1 else 0;
MoxieSecondLine.AssignValueColor(
  if lastChangeSecondLine == 1 then MoxieSecondLine.Color("Down")
  else MoxieSecondLine.Color("Up")
);
MoxieSecondLine.Hide();

# Show vertical lines at crossovers
AddVerticalLine(showVerticalLines and Moxie[1] <= 0 and Moxie > 0, "", Color.GREEN, Curve.SHORT_DASH);
AddVerticalLine(showVerticalLines and Moxie[1] >= 0 and Moxie < 0, "", Color.LIGHT_RED, Curve.SHORT_DASH);

# Indicate the Trampoline setup
def sma50 = SimpleMovingAvg(close, 50);
plot Trampoline = if showTrampolines and ((Moxie < -0.1 and close > sma50) or (Moxie > 0.1 and close < sma50)) then 0 else Double.NaN;
Trampoline.SetPaintingStrategy(PaintingStrategy.SQUARES);
Trampoline.DefineColor("Bullish", Color.LIGHT_GREEN);
Trampoline.DefineColor("Bearish", Color.PINK);
Trampoline.AssignValueColor(if close > sma50 then Trampoline.Color("Bearish") else Trampoline.Color("Bullish"));
Other Coders, Please tell me what you think of my attempt to mimic with this Mooxie #2 Time frames. Only to be used on the 15 minute time frame? I would love to send the code to someone who can add a couple of things like the 15 minute Arrows for the signal. I will finish cleaning it up and post it shortly. Sorry TG, I just cannot justify buying yet another indicator... And Imitation is one of the best forms of flattery
Other Coders, Please tell me what you think of my attempt to mimic with this Mooxie #2 Time frames. Only to be used on the 15 minute time frame? I would love to send the code to someone who can add a couple of things like the 15 minute Arrows for the signal. I will finish cleaning it up and post it shortly. Sorry TG, I just cannot justify buying yet another indicator... And Imitation is one of the best forms of flattery
The second line for 15m timeframe is already included in the code I posted. You just need to check the box to turn on that plot on 15m charts.
Yours looks like it's drawing fine. On 15m Watkins uses two higher timeframes to draw two different Moxie lines, 1-hour and 2-hour. And he's using the high instead of closing price only on 15m timeframe. So if that's what you implemented then it's correct.
No, it's not possible. I doubt the real Moxie indicator has such a scan either since it has no visual to cues for divergence. I played with visuals for a few minutes weeks ago using code I stole from a Mobius RSI Divergence study but it didn't work very well so I scrapped it.
The second line for 15m timeframe is already included in the code I posted. You just need to check the box to turn on that plot on 15m charts.
Yours looks like it's drawing fine. On 15m Watkins uses two higher timeframes to draw two different Moxie lines, 1-hour and 2-hour. And he's using the high instead of closing price only on 15m timeframe. So if that's what you implemented then it's correct.
Hi Slippage, thank u very much on the indicator. i have installed and set the chart to 15mins but i do not see the second line in the lower studies. I wanted to insert a picture of my chart for purview but didnt know how to. Is there certain settings i need to set for the second line to appear? Thank u in advance
Hi Slippage, thank u very much on the indicator. i have installed and set the chart to 15mins but i do not see the second line in the lower studies. I wanted to insert a picture of my chart for purview but didnt know how to. Is there certain settings i need to set for the second line to appear? Thank u in advance
@Slippage...excellent reproduction of Moxie. I have a question. I have noticed the arrows ranging from one to eight when they appear, is there any significance to this? Does it indicate the strength of the signal or something else?
@Slippage...excellent reproduction of Moxie. I have a question. I have noticed the arrows ranging from one to eight when they appear, is there any significance to this? Does it indicate the strength of the signal or something else?
The number of arrows depends on how many of your current timeframe fit into the higher timeframe Moxie is using to calculate its plot. On daily you'll get 5 arrows for the week. On hourly, you'll get 8 arrows for the day, etc.
Here's my final code all cleaned up. Since Watkins only uses the second line on 15m charts, in order to avoid impacting performance on other timeframes I made it use the current timeframe's data to calculate the second line. The second line is useless now on other timeframes. It will be the same as first line. If we're following the Moxie strategy we don't need the second line on other timeframes anyway.
When you're switching through symbols and trying to scan with your eyes across multiple charts quickly the zero line can be hard to notice when it's at the top or bottom. I added a label to the lower study so it's easier to see, at a glance, if a particular timeframe is above (green) or below (red) zero. I was thinking about also creating an MTF study to add labels for higher timeframes so if you're maximized on the 1H chart you can still see if Moxie is above zero on D and W charts.
That said, I'm setting Moxie aside for now while I do some testing with a Squeeze Pro clone. I'm keeping the Moxie lower study on my charts for now as the only visible momentum indicator since I've customized Squeeze Pro to give signal arrows when both its built in momentum and the TTM_Wave move together in the same direction. I may or may not keep Moxie along with Squeeze Pro depending on if it's redundant or if it's later to correctly signal direction changes.
Here's the Moxie upper study for the arrows
Ruby:
declare upper;

def currentAggPeriod = GetAggregationPeriod();
def higherAggPeriod =
  if currentAggPeriod <= AggregationPeriod.TWO_MIN then AggregationPeriod.FIVE_MIN
  else if currentAggPeriod <= AggregationPeriod.THREE_MIN then AggregationPeriod.TEN_MIN
  else if currentAggPeriod <= AggregationPeriod.FIVE_MIN then AggregationPeriod.FIFTEEN_MIN
  else if currentAggPeriod <= AggregationPeriod.TEN_MIN then AggregationPeriod.THIRTY_MIN
  else if currentAggPeriod <= AggregationPeriod.FIFTEEN_MIN then AggregationPeriod.HOUR
  else if currentAggPeriod <= AggregationPeriod.THIRTY_MIN then AggregationPeriod.TWO_HOURS
  else if currentAggPeriod <= AggregationPeriod.TWO_HOURS then AggregationPeriod.DAY
  else if currentAggPeriod <= AggregationPeriod.FOUR_HOURS then AggregationPeriod.TWO_DAYS
  else if currentAggPeriod <= AggregationPeriod.DAY then AggregationPeriod.WEEK
  else if currentAggPeriod <= AggregationPeriod.WEEK then AggregationPeriod.MONTH
  else AggregationPeriod.QUARTER
;

script MoxieFunc {
  input price = close;
  def vc1 = ExpAverage(price, 12) - ExpAverage(price , 26);
  def va1 = ExpAverage(vc1, 9);
  plot data = (vc1 - va1) * 3;
}

def price =
  if currentAggPeriod == AggregationPeriod.FIFTEEN_MIN then high(period = higherAggPeriod)
  else close(period = higherAggPeriod)
;
def Moxie = MoxieFunc(price);

def longTrigger = if Moxie > 0 and Moxie[1] <= 0 then Moxie else Double.NaN;
def longArrowPosition =
  # first arrow
  if Moxie == longTrigger and Moxie != Moxie[1] then low
  # consecutive arrows at same position
  else if Moxie == longTrigger and Moxie == Moxie[1] then longArrowPosition[1]
  else Double.NaN;
plot long = longArrowPosition;
long.SetPaintingStrategy(PaintingStrategy.ARROW_UP);
long.SetDefaultColor(Color.GREEN);
long.SetLineWeight(3);
long.HideBubble();
long.HideTitle();

def shortTrigger = if Moxie < 0 and Moxie[1] >= 0 then Moxie else Double.NaN;
def shortArrowPosition =
  # first arrow
  if Moxie == shortTrigger and Moxie != Moxie[1] then high
  # consecutive arrows at same position
  else if Moxie == shortTrigger and Moxie == Moxie[1] then shortArrowPosition[1]
  else Double.NaN;
plot short = shortArrowPosition;
short.SetPaintingStrategy(PaintingStrategy.ARROW_DOWN);
short.SetDefaultColor(Color.LIGHT_RED);
short.SetLineWeight(3);
short.HideBubble();
short.HideTitle();
And here's the Moxie lower study
Ruby:
declare lower;

input showVerticalLines = yes;
input showTrampolines = yes;

plot ZeroLine = 0;
ZeroLine.SetDefaultColor(Color.GRAY);
ZeroLine.HideBubble();
ZeroLine.HideTitle();

def currentAggPeriod = GetAggregationPeriod();
def higherAggPeriod =
  if currentAggPeriod <= AggregationPeriod.TWO_MIN then AggregationPeriod.FIVE_MIN
  else if currentAggPeriod <= AggregationPeriod.THREE_MIN then AggregationPeriod.TEN_MIN
  else if currentAggPeriod <= AggregationPeriod.FIVE_MIN then AggregationPeriod.FIFTEEN_MIN
  else if currentAggPeriod <= AggregationPeriod.TEN_MIN then AggregationPeriod.THIRTY_MIN
  else if currentAggPeriod <= AggregationPeriod.FIFTEEN_MIN then AggregationPeriod.HOUR
  else if currentAggPeriod <= AggregationPeriod.THIRTY_MIN then AggregationPeriod.TWO_HOURS
  else if currentAggPeriod <= AggregationPeriod.TWO_HOURS then AggregationPeriod.DAY
  else if currentAggPeriod <= AggregationPeriod.FOUR_HOURS then AggregationPeriod.TWO_DAYS
  else if currentAggPeriod <= AggregationPeriod.DAY then AggregationPeriod.WEEK
  else if currentAggPeriod <= AggregationPeriod.WEEK then AggregationPeriod.MONTH
  else AggregationPeriod.QUARTER
;

script MoxieFunc {
  input price = close;
  def vc1 = ExpAverage(price, 12) - ExpAverage(price , 26);
  def va1 = ExpAverage(vc1, 9);
  plot data = (vc1 - va1) * 3;
}

# Watkins uses the high for 15m charts and the close for other timeframes
def price =
  if currentAggPeriod == AggregationPeriod.FIFTEEN_MIN
  then high(period = higherAggPeriod)
  else close(period = higherAggPeriod)
;

plot Moxie = MoxieFunc(price);
Moxie.SetLineWeight(2);
Moxie.DefineColor("Up", Color.GREEN);
Moxie.DefineColor("Down", Color.RED);
def lastChange = if Moxie < Moxie[1] then 1 else 0;
Moxie.AssignValueColor(
  if lastChange == 1 then Moxie.Color("Down")
  else Moxie.Color("Up")
);

# Watkins uses a different setup for Moxie on his 15 minute charts.
# He uses two lines derived from two higher timeframes.
# We'll hide the second Moxie line by default. You should enable it
# on 15 minute charts.
# For timeframes other than 15 minutes we'll use the same data as
# first Moxie line to reduce data requested from the server and
# improve performance.
def secondAggPeriod =
  if currentAggPeriod == AggregationPeriod.FIFTEEN_MIN
  then AggregationPeriod.TWO_HOURS
  else currentAggPeriod
;

plot MoxieSecondLine =
  if currentAggPeriod == AggregationPeriod.FIFTEEN_MIN
  # on the next line it seems like we should be able to use AggregationPeriod.TWO_HOURS
  # instead of the secondAggPeriod variable holding that value but for some reason that
  # causes the main Moxie plot on 1 hour chart to render nothing.
  then MoxieFunc(high(period = secondAggPeriod))
  else Double.NaN
;

MoxieSecondLine.SetLineWeight(2);
MoxieSecondLine.DefineColor("Up", Color.GREEN);
MoxieSecondLine.DefineColor("Down", Color.RED);
def lastChangeSecondLine = if MoxieSecondLine < MoxieSecondLine[1] then 1 else 0;
MoxieSecondLine.AssignValueColor(
  if lastChangeSecondLine == 1 then MoxieSecondLine.Color("Down")
  else MoxieSecondLine.Color("Up")
);
MoxieSecondLine.Hide();

# Show vertical lines at crossovers
AddVerticalLine(showVerticalLines and Moxie[1] <= 0 and Moxie > 0, "", CreateColor(0,150,0), Curve.SHORT_DASH);
AddVerticalLine(showVerticalLines and Moxie[1] >= 0 and Moxie < 0, "", CreateColor(200,0,0), Curve.SHORT_DASH);

# Indicate the Trampoline setup
def sma50 = Average(close, 50);
plot Trampoline =
  if showTrampolines and ((Moxie < -.01 and close > sma50) or (Moxie > .01 and close < sma50))
  then 0
  else Double.NaN
;
Trampoline.SetPaintingStrategy(PaintingStrategy.SQUARES);
Trampoline.DefineColor("Bullish", Color.LIGHT_GREEN);
Trampoline.DefineColor("Bearish", Color.PINK);
Trampoline.AssignValueColor(if close > sma50 then Trampoline.Color("Bearish") else Trampoline.Color("Bullish"));
Trampoline.HideBubble();
Trampoline.HideTitle();

AddLabel(
  yes,
  if currentAggPeriod == AggregationPeriod.WEEK then " W "
  else if currentAggPeriod == AggregationPeriod.Day then " D "
  else if currentAggPeriod == AggregationPeriod.HOUR then " H "
  else if currentAggPeriod == AggregationPeriod.FIFTEEN_MIN then " 15 "
  else " ",
  if Moxie < 0 then Color.RED else Color.GREEN
);
Hi Slippage,
Just noticed your contributions as I had recently seen a Simpler Trading / TG marketing video and was curious as to what Moxie indi really was...
So thanks very much for all your effort in sleuthing and coding and testing...
You may be aware of this, but just for the general knowledge, in looking at your code, MoxieFunc() seems really just to be a slight variant on MACD Histogram, otherwise known as OsMA or Oscillator of Moving Averages using the standard OsMA periods (12, 26, 9) and MA methods (Exp, Exp, Sma), but instead using the next Higher Time Frame to give the staircase effect (and make the changes more visually dramatic and reflective of the HTF MACD C/D's) and 2 colored line rather than single/dual or 4 color histograms which are generally used. And on 15min (and lower) TF uses next 2 HTFs (and price of High rather than Close as you have discovered).
The unique Moxie parts seem to be identifying the HTF "trampoline" OsMA and 50/200 MA relationships and use of HTF slope colored line to make easy to quickly see trend direction and crosses.
A few minor things I notice in your code:
uses Exp MA method for the MACD smoothing/signal (ie def va1 = ExpAverage(vc1, 9); should it be Sma?)
only uses the 2 HTFs for the 15min TF ( ie if currentAggPeriod == AggregationPeriod.FIFTEEN_MIN; should it be 15min and lower TFs?)
useThinkScript is the #1 community of stock market investors using indicators and other tools to power their trading strategies. Traders of all skill levels use our forums to learn about scripting and indicators, help each other, and discover new ways to gain an edge in the markets.
How do I get started?
We get it. Our forum can be intimidating, if not overwhelming. With thousands of topics, tens of thousands of posts, our community has created an incredibly deep knowledge base for stock traders. No one can ever exhaust every resource provided on our site.
If you are new, or just looking for guidance, here are some helpful links to get you started.
VIP members get exclusive access to these proven and tested premium indicators: Buy the Dip, Advanced Market Moves 2.0, Take Profit, and Volatility Trading Range. In addition, VIP members get access to over 50 VIP-only custom indicators, add-ons, and strategies, private VIP-only forums, private Discord channel to discuss trades and strategies in real-time, customer support, trade alerts, and much more. Learn all about VIP membership here.
How can I access the premium indicators?
To access the premium indicators, which are plug and play ready, sign up for VIP membership here.


")