
Clark2001
New member
Hello everyone, I was working on modifying a script for Multi-Timeframe support and resistance zones based off this one that I found on the site:
MTF-Trend-Table
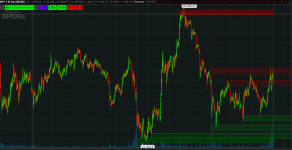
I prefer to trade more based on zones than line levels so I decided to adjusted it a little to make it more zone based. I thought I would share it if anyone wanted to use it. I'm not too familiar with thinkscript so the code might not be the cleanest although I hope someone finds some use out of it.
*1/2/24 Updates to make is easier to adjust:
-You can now adjust line weight & line type in the settings
-I made the line levels and cloud colors global so you can adjust them in the settings
MTF-Trend-Table
I prefer to trade more based on zones than line levels so I decided to adjusted it a little to make it more zone based. I thought I would share it if anyone wanted to use it. I'm not too familiar with thinkscript so the code might not be the cleanest although I hope someone finds some use out of it.
*1/2/24 Updates to make is easier to adjust:
-You can now adjust line weight & line type in the settings
-I made the line levels and cloud colors global so you can adjust them in the settings
Code:
#/ This source code is subject to the terms of the Mozilla Public License 2.0 at https://mozilla.org/MPL/2.0/
#// © millerrh
#// Revision 2 - Optimizing the code for improved speed (with some help from @RozaniGhani-RG), allowing the user to control which timeframes to look at,
#// and moving indicator to table so I can use a mutable variable to indicate which timeframe the user selected.
#// Revision 3 - More speed optimization to limit the # of security calls.  Allow for abiilty for user to reposition the table.
#// Revision 4 - Added ability to choose between close or high for pivot.
#// This indicator identifies trends in multiple higher timeframes and shows them in a widget off to the right of the chart.
#// It's meant to be used as an alternative filter for "trading with the trend." Typically people use moving averages of varying lengths for this
#// (i.e. if over 200 MA it's an uptrend, etc.), but I wanted to see if it might be more effective to see if the higher timeframes were actually
#// trending or not in a certain direction.
#// For the purposes of this indicator, an uptrend is defined as higher highs and higher lows.  So if currently in a downtrend and the highs are broken,
#// the indicator will flip to an uptrend because now we have a higher high.  Vice versa for downtrends.
#// The user can choose the lookback period for defining these highs/lows (the pivot points).  A smaller lookback number will give you more frequent pivot points.
#// The user can toggle on visibility of all historical pivot points to make sure the frequency and placement of the swing highs/lows is to their liking.
#// The user can show the support/resistance lines of those most recent swing high/low points on the multiple timeframes as well.
#// When these lines are breached, that is when the trends change, so you can see if you are close to changing any longer term trends.
#indicator('MTF Trend Table', overlay=true)
# Converted by Sam4Cok@Samer800    - 08/2023
#-- some bug fixes
#// == USER INPUT ==
input PivotLookback = 11;# 'Looks for pivot points within this number of bars both left and right.'
input pivotType = {default "High/Low", "Close"};
input showPivotPoints = no;
input firstTimeframe = AggregationPeriod.FIVE_MIN;
input SecondTimeframe = AggregationPeriod.FIFTEEN_MIN;
input ThirdTimeframe = AggregationPeriod.THIRTY_MIN;
input FourthTimeframe = AggregationPeriod.HOUR;
input showMtfLevels = yes;    # 'Show Multiple Timeframe S/R Levels?'
def na = Double.NaN;

def srcHi;
def srcHi1;
def srcHi2;
def srcHi3;
def srcHi4;
def srcLo;
def srcLo1;
def srcLo2;
def srcLo3;
def srcLo4;
switch (pivotType) {
case "High/Low" :
    srcHi = high;
    srcLo = low;
    srcHi1 = high(Period = firstTimeframe);
    srcLo1 = low(Period  = firstTimeframe);
    srcHi2 = high(Period = SecondTimeframe);
    srcLo2 = low(Period  = SecondTimeframe);
    srcHi3 = high(Period = ThirdTimeframe);
    srcLo3 = low(Period  = ThirdTimeframe);
    srcHi4 = high(Period = FourthTimeframe);
    srcLo4 = low(Period  = FourthTimeframe);
case "Close" :
    srcHi = close;
    srcLo = close;
    srcHi1 = close(Period = firstTimeframe);
    srcLo1 = close(Period = firstTimeframe);
    srcHi2 = close(Period = SecondTimeframe);
    srcLo2 = close(Period = SecondTimeframe);
    srcHi3 = close(Period = ThirdTimeframe);
    srcLo3 = close(Period = ThirdTimeframe);
    srcHi4 = close(Period = FourthTimeframe);
    srcLo4 = close(Period = FourthTimeframe);
}
script FindPivots {
    input dat = close; # default data or study being evaluated
    input HL  = 0;    # default high or low pivot designation, -1 low, +1 high
    input lbL  = 5;    # default Pivot Lookback Left
    input lbR  = 1;    # default Pivot Lookback Right
    ##############
    def _nan;    # used for non-number returns
    def _BN;     # the current barnumber
    def _VStop;  # confirms that the lookforward period continues the pivot trend
    def _V;      # the Value at the actual pivot point
    ##############
    _BN  = BarNumber();
    _nan = Double.NaN;
    _VStop = if !IsNaN(dat) and lbR > 0 and lbL > 0 then
                fold a = 1 to lbR + 1 with b=1 while b do
                if HL > 0 then dat > GetValue(dat, -a) else dat < GetValue(dat, -a) else _nan;
    if (HL > 0) {
        _V = if _BN > lbL and dat == Highest(dat, lbL + 1) and _VStop
            then dat else _nan;
    } else {
        _V = if _BN > lbL and dat == Lowest(dat, lbL + 1) and _VStop
            then dat else _nan;
    }
    plot result = if (!IsNaN(_V) and _VStop) then _V else _nan;
}
#//  == DEFINE FUNCTIONS FOR USE IN MULTIPLE TIMEFRAMES (USING A TUPLE TO AVOID SO MANY SECURITY CALLS) ==
script getHTF {
    input srcHi = high;
    input srcLo = low;
    input lookback = 3;
    def na = Double.NaN;
    def hih = Highest(srcHi, lookback + 1);
    def lol = Lowest(srcLo, lookback + 1);
    def ph =  findpivots(srcHi,  1, lookback, lookback);
    def pl =  findpivots(srcLo, -1, lookback, lookback);
    def highLevel_ = if !IsNaN(ph) then srcHi else highLevel_[1];
    def lowLevel_ = if !IsNaN(pl) then srcLo else lowLevel_[1];
    def highLevel = if highLevel_ == 0 then Max(hih, hih[1]) else highLevel_;
    def lowLevel  = if lowLevel_ == 0  then Min(lol, lol[1]) else lowLevel_;
    def barsSinceHigh = if highLevel != highLevel[1] then 0 else barsSinceHigh[1] + 1;
    def barsSinceLow  = if lowLevel != lowLevel[1]  then 0 else barsSinceLow[1] + 1;
    def time = GetTime();
    def timeSinceHigh = GetValue(time, barsSinceHigh);
    def timeSinceLow  = GetValue(time, barsSinceLow);
    plot hL = if (time < HighestAll(timeSinceHigh) or highLevel == 0) then na else highLevel;
    plot lL = if (time < HighestAll(timeSinceLow) or lowLevel == 0) then na else lowLevel;
    plot tsH = timeSinceHigh;
    plot tsL = timeSinceLow;
}
def hL_01_  = getHTF(srcHi1, srcLo1, PivotLookback).hL;
def lL_01_  = getHTF(srcHi1, srcLo1, PivotLookback).lL;
def tSH_01_ = getHTF(srcHi1, srcLo1, PivotLookback).tsH;
def tSL_01_ = getHTF(srcHi1, srcLo1, PivotLookback).tsL;
def hL_02_  = getHTF(srcHi2, srcLo2, PivotLookback).hL;
def lL_02_  = getHTF(srcHi2, srcLo2, PivotLookback).lL;
def tSH_02_ = getHTF(srcHi2, srcLo2, PivotLookback).tsH;
def tSL_02_ = getHTF(srcHi2, srcLo2, PivotLookback).tsL;
def hL_03_  = getHTF(srcHi3, srcLo3, PivotLookback).hL;
def lL_03_  = getHTF(srcHi3, srcLo3, PivotLookback).lL;
def tSH_03_ = getHTF(srcHi3, srcLo3, PivotLookback).tsH;
def tSL_03_ = getHTF(srcHi3, srcLo3, PivotLookback).tsL;
def hL_04_  = getHTF(srcHi4, srcLo4, PivotLookback).hL;
def lL_04_  = getHTF(srcHi4, srcLo4, PivotLookback).lL;
def tSH_04_ = getHTF(srcHi4, srcLo4, PivotLookback).tsH;
def tSL_04_ = getHTF(srcHi4, srcLo4, PivotLookback).tsL;
#---
def hL_01  = hL_01_;
def lL_01  = lL_01_;
def tSH_01 = tSH_01_;
def tSL_01 = tSL_01_;

def hL_02  = hL_02_;
def lL_02  = lL_02_;
def tSH_02 = tSH_02_;
def tSL_02 = tSL_02_;

def hL_03  = hL_03_;
def lL_03  = lL_03_;
def tSH_03 = tSH_03_;
def tSL_03 = tSL_03_;

def hL_04  = hL_04_;
def lL_04  = lL_04_;
def tSH_04 = tSH_04_;
def tSL_04 = tSL_04_;
#---
def chartTFInMinutes = GetAggregationPeriod();
def time = GetTime();
def TF1Check = firstTimeframe < chartTFInMinutes;
def TF2Check = SecondTimeframe < chartTFInMinutes;
def TF3Check = ThirdTimeframe < chartTFInMinutes;
def TF4Check = FourthTimeframe < chartTFInMinutes;

def phC =  findpivots(srcHi,  1, PivotLookback, PivotLookback);
def plC =  findpivots(srcLo, -1, PivotLookback, PivotLookback);

#// Plot historical pivot points for debugging and configuring the lookback period.
plot ppH = if showPivotPoints and phC then phC else na;
plot ppL = if showPivotPoints and plC then plC else na;
ppH.SetDefaultColor(Color.YELLOW);
ppL.SetDefaultColor(Color.YELLOW);
ppH.SetPaintingStrategy(PaintingStrategy.BOOLEAN_WEDGE_UP);
ppL.SetPaintingStrategy(PaintingStrategy.BOOLEAN_WEDGE_DOWN);

#// 1st Timeframe
plot highLine1 = if TF1Check then na else
                 if showMtfLevels then hL_01 else na;
plot lowLine1  = if TF1Check then na else
                 if showMtfLevels then lL_01 else na;
#// 2nd Timeframe
plot highLine2 = if TF2Check then na else
                 if showMtfLevels then hL_02 else na;
plot lowLine2  = if TF2Check then na else
                 if showMtfLevels then lL_02 else na;
#// 3rd Timeframe
plot highLine3 = if TF3Check then na else
                 if showMtfLevels then hL_03 else na;
plot lowLine3  = if TF3Check then na else
                 if showMtfLevels then lL_03 else na;
#// 4th Timeframe
plot highLine4 = if TF3Check then na else
                 if showMtfLevels then hL_04 else na;
plot lowLine4  = if TF3Check then na else
                 if showMtfLevels then lL_04 else na;

highLine1.SetPaintingStrategy(PaintingStrategy.HORIZONTAL);
highLine2.SetPaintingStrategy(PaintingStrategy.HORIZONTAL);
highLine3.SetPaintingStrategy(PaintingStrategy.HORIZONTAL);
highLine4.SetPaintingStrategy(PaintingStrategy.HORIZONTAL);
lowLine1.SetPaintingStrategy(PaintingStrategy.HORIZONTAL);
lowLine2.SetPaintingStrategy(PaintingStrategy.HORIZONTAL);
lowLine3.SetPaintingStrategy(PaintingStrategy.HORIZONTAL);
lowLine4.SetPaintingStrategy(PaintingStrategy.HORIZONTAL);

highLine1.SetDefaultColor(Color.YELLOW);
highLine2.SetDefaultColor(Color.YELLOW);
highLine3.SetDefaultColor(Color.YELLOW);
highLine4.SetDefaultColor(Color.YELLOW);
lowLine1.SetDefaultColor(Color.YELLOW);
lowLine2.SetDefaultColor(Color.YELLOW);
lowLine3.SetDefaultColor(Color.YELLOW);
lowLine4.SetDefaultColor(Color.YELLOW);

ppH.Hide();
highLine1.Hide();
highLine2.Hide();
highLine3.Hide();
highLine4.Hide();

lowLine1.Hide();
lowLine2.Hide();
lowLine3.Hide();
lowLine4.Hide();
ppL.Hide();


#// == TREND CALCULATIONS (USING A TUPLE TO CONSOLIDATE REPETATIVE CODE AND GENERATE MULTIPE VARIABLES WITH ONE FUNCTION ==
script tfInMinutes {
    input agg = AggregationPeriod.DAY;
    def tf     = agg;
    def min_   = 60 * 1000;
    def hour_  =  min_ * 60;
    def day_   = hour_ * 24;
    def week_  = day_ * 7;
    def month_ = week_ * 4;

    def chartTf;
    def tfLabel;
    if tf < hour_ {
        chartTf = tf / min_;
        tfLabel = 1;
    } else
    if tf < day_ {
        chartTf = tf / hour_;
        tfLabel = 2;
    } else
    if tf < week_ {
        chartTf = tf / day_;
        tfLabel = 3;
    } else
    if tf < month_ {
        chartTf = tf / week_;
        tfLabel = 4;
    } else
    if tf {
        chartTf = tf / month_;
        tfLabel = 5;
    } else {
        chartTf = chartTf[1];
        tfLabel = tfLabel[1];
    }
    plot ctf = chartTf;
    plot ltf = tfLabel;
}
script f_signal {
    input highLevel = high;
    input lowLevel  = low;
    def uptrendSignal   = high > highLevel;
    def downtrendSignal = low < lowLevel;
    def inUptrend = if uptrendSignal[1] then yes else
                    if downtrendSignal[1] then no else inUptrend[1];
    plot up = if IsNaN(inUptrend) then 0 else inUptrend;
}
def inUptrend1   = f_signal(hL_01, lL_01);#  // 1st Timeframe
def inUptrend2   = f_signal(hL_02, lL_02);#  // 2nd Timeframe
def inUptrend3   = f_signal(hL_03, lL_03);#  // 3rd Timeframe
def inUptrend4   = f_signal(hL_04, lL_04);#  // 4th Timeframe

#// Define glyphs
def glyph1 = inUptrend1;
def glyph2 = inUptrend2;
def glyph3 = inUptrend3;
def glyph4 = inUptrend4;

def tf1 = tfInMinutes(firstTimeframe).ctf;
def tf2 = tfInMinutes(SecondTimeframe).ctf;
def tf3 = tfInMinutes(ThirdTimeframe).ctf;
def tf4 = tfInMinutes(FourthTimeframe).ctf;

def ltf1 = tfInMinutes(firstTimeframe).ltf;
def ltf2 = tfInMinutes(SecondTimeframe).ltf;
def ltf3 = tfInMinutes(ThirdTimeframe).ltf;
def ltf4 = tfInMinutes(FourthTimeframe).ltf;


AddLabel(!TF1Check , tf1 + if ltf1 == 1 then " Min" else
                           if ltf1 == 2 then " H" else
                           if ltf1 == 3 then " D" else
                           if ltf1 == 4 then " W" else " M", if glyph1 then Color.GREEN else Color.RED);
AddLabel(!TF2Check , tf2 + if ltf2 == 1 then " Min" else
                           if ltf2 == 2 then " H" else
                           if ltf2 == 3 then " D" else
                           if ltf2 == 4 then " W" else " M", if glyph2 then Color.GREEN else Color.RED);
AddLabel(!TF3Check , tf3 + if ltf3 == 1 then " Min" else
                           if ltf3 == 2 then " H" else
                           if ltf3 == 3 then " D" else
                           if ltf3 == 4 then " W" else " M", if glyph3 then Color.GREEN else Color.RED);
AddLabel(!TF4Check , tf4 + if ltf4 == 1 then " Min" else
                           if ltf4 == 2 then " H" else
                           if ltf4 == 3 then " D" else
                           if ltf4 == 4 then " W" else " M", if glyph4 then Color.GREEN else Color.RED);
#-- END of CODE

#Just make cloud size zero to turn off clouds
input CloudSize = 0.2;
input Lineweight = 1;
input LineType = PaintingStrategy.HORIZONTAL;
DefineGlobalColor("CloudS", Color.GREEN);
DefineGlobalColor("CloudR", Color.RED);
#Global Color For Levels(Support)
DefineGlobalColor("UpLevels", Color.GREEN);
#Global Color For Levels(Resistance)
DefineGlobalColor("DnLevels", Color.RED);

#++++++++++++++++++++++++++++++++++++++++++++++++++++++++++++++++++++++
#++++++++++++++++++++++++++++++++++++++++++++++++++++++++++++++++++++++
plot cloud1_top = highLine1;
plot cloud1_bot = highLine1 - CloudSize;

plot cloud2_top = highLine2;
plot cloud2_bot = highLine2 - CloudSize;

AddCloud(cloud1_top, cloud1_bot, GlobalColor("CloudR"), GlobalColor("CloudR"), yes);
AddCloud(cloud2_top, cloud2_bot, GlobalColor("CloudR"), GlobalColor("CloudR"), yes);

#Global Levels (Color)
cloud1_top.AssignValueColor(GlobalColor("DnLevels"));
cloud1_bot.AssignValueColor(GlobalColor("DnLevels"));
cloud2_top.AssignValueColor(GlobalColor("DnLevels"));
cloud2_bot.AssignValueColor(GlobalColor("DnLevels"));


#cloud1_top.Hide();
#cloud1_bot.Hide();
#cloud2_top.Hide();
#cloud2_bot.Hide();
#++++++++++++++++++++++++++++++++++++++++++++++++++++++++++++++++++++++
#++++++++++++++++++++++++++++++++++++++++++++++++++++++++++++++++++++++
plot cloud3_top = highLine3;
plot cloud3_bot = highLine3 - CloudSize;

plot cloud4_top = highLine4;
plot cloud4_bot = highLine4 - CloudSize;

AddCloud(cloud3_top, cloud3_bot, GlobalColor("CloudR"), GlobalColor("CloudR"), yes);
AddCloud(cloud4_top, cloud4_bot, GlobalColor("CloudR"), GlobalColor("CloudR"), yes);

#Global Levels (Color)
cloud3_top.AssignValueColor(GlobalColor("DnLevels"));
cloud3_bot.AssignValueColor(GlobalColor("DnLevels"));
cloud4_top.AssignValueColor(GlobalColor("DnLevels"));
cloud4_bot.AssignValueColor(GlobalColor("DnLevels"));

#cloud3_top.Hide();
#cloud3_bot.Hide();
#cloud4_top.Hide();
#cloud4_bot.Hide();
#++++++++++++++++++++++++++++++++++++++++++++++++++++++++++++++++++++++
#++++++++++++++++++++++++++++++++++++++++++++++++++++++++++++++++++++++
plot cloud5_top = lowLine1;
plot cloud5_bot = lowLine1 + CloudSize;

plot cloud6_top = lowLine2;
plot cloud6_bot = lowLine2 + CloudSize;

AddCloud(cloud5_top, cloud5_bot, GlobalColor("CloudS"), GlobalColor("CloudS"), yes);
AddCloud(cloud6_top, cloud6_bot, GlobalColor("CloudS"), GlobalColor("CloudS"), yes);

#Global Levels (Color)
cloud5_top.AssignValueColor(GlobalColor("UpLevels"));
cloud5_bot.AssignValueColor(GlobalColor("UpLevels"));
cloud6_top.AssignValueColor(GlobalColor("UpLevels"));
cloud6_bot.AssignValueColor(GlobalColor("UpLevels"));

#cloud5_top.Hide();
#cloud5_bot.Hide();
#cloud6_top.Hide();
#cloud6_bot.Hide();
#++++++++++++++++++++++++++++++++++++++++++++++++++++++++++++++++++++++
#++++++++++++++++++++++++++++++++++++++++++++++++++++++++++++++++++++++
plot cloud7_top = lowLine3;
plot cloud7_bot = lowLine3 + CloudSize;

plot cloud8_top = lowLine4;
plot cloud8_bot = lowLine4 + CloudSize;

AddCloud(cloud7_top, cloud7_bot, GlobalColor("CloudS"), GlobalColor("CloudS"), yes);
AddCloud(cloud8_top, cloud8_bot, GlobalColor("CloudS"), GlobalColor("CloudS"), yes);

#Global Levels (Color)
cloud7_top.AssignValueColor(GlobalColor("UpLevels"));
cloud7_bot.AssignValueColor(GlobalColor("UpLevels"));
cloud8_top.AssignValueColor(GlobalColor("UpLevels"));
cloud8_bot.AssignValueColor(GlobalColor("UpLevels"));

#cloud7_top.Hide();
#cloud7_bot.Hide();
#cloud8_top.Hide();
#cloud8_bot.Hide();

cloud1_top.SetPaintingStrategy(LineType);
cloud1_top.SetDefaultColor(Color.DARK_RED);
cloud1_top.SetLineWeight(Lineweight);

cloud1_bot.SetPaintingStrategy(LineType);
cloud1_bot.SetDefaultColor(Color.DARK_RED);
cloud1_bot.SetLineWeight(Lineweight);

cloud2_top.SetPaintingStrategy(LineType);
cloud2_top.SetDefaultColor(Color.DARK_RED);
cloud2_top.SetLineWeight(Lineweight);

cloud2_bot.SetPaintingStrategy(LineType);
cloud2_bot.SetDefaultColor(Color.DARK_RED);
cloud2_bot.SetLineWeight(Lineweight);

cloud3_top.SetPaintingStrategy(LineType);
cloud3_top.SetDefaultColor(Color.DARK_RED);
cloud3_top.SetLineWeight(Lineweight);

cloud3_bot.SetPaintingStrategy(LineType);
cloud3_bot.SetDefaultColor(Color.DARK_RED);
cloud3_bot.SetLineWeight(Lineweight);

cloud4_top.SetPaintingStrategy(LineType);
cloud4_top.SetDefaultColor(Color.DARK_RED);
cloud4_top.SetLineWeight(Lineweight);

cloud4_bot.SetPaintingStrategy(LineType);
cloud4_bot.SetDefaultColor(Color.DARK_RED);
cloud4_bot.SetLineWeight(Lineweight);

cloud5_top.SetPaintingStrategy(LineType);
cloud5_top.SetDefaultColor(Color.DARK_GREEN);
cloud5_top.SetLineWeight(Lineweight);

cloud5_bot.SetPaintingStrategy(LineType);
cloud5_bot.SetDefaultColor(Color.DARK_GREEN);
cloud5_bot.SetLineWeight(Lineweight);

cloud6_top.SetPaintingStrategy(LineType);
cloud6_top.SetDefaultColor(Color.DARK_GREEN);
cloud6_top.SetLineWeight(Lineweight);

cloud6_bot.SetPaintingStrategy(LineType);
cloud6_bot.SetDefaultColor(Color.DARK_GREEN);
cloud6_bot.SetLineWeight(Lineweight);

cloud7_top.SetPaintingStrategy(LineType);
cloud7_top.SetDefaultColor(Color.DARK_GREEN);
cloud7_top.SetLineWeight(Lineweight);

cloud7_bot.SetPaintingStrategy(LineType);
cloud7_bot.SetDefaultColor(Color.DARK_GREEN);
cloud7_bot.SetLineWeight(Lineweight);

cloud8_top.SetPaintingStrategy(LineType);
cloud8_top.SetDefaultColor(Color.DARK_GREEN);
cloud8_top.SetLineWeight(Lineweight);

cloud8_bot.SetPaintingStrategy(LineType);
cloud8_bot.SetDefaultColor(Color.DARK_GREEN);
cloud8_bot.SetLineWeight(Lineweight);
Attachments
Last edited: