Need help. Made an attempt to convert TV pine script for Volume Composition.
https://www.tradingview.com/script/d4TDeuRU-Volume-composition-Buy-sell-active-passive/
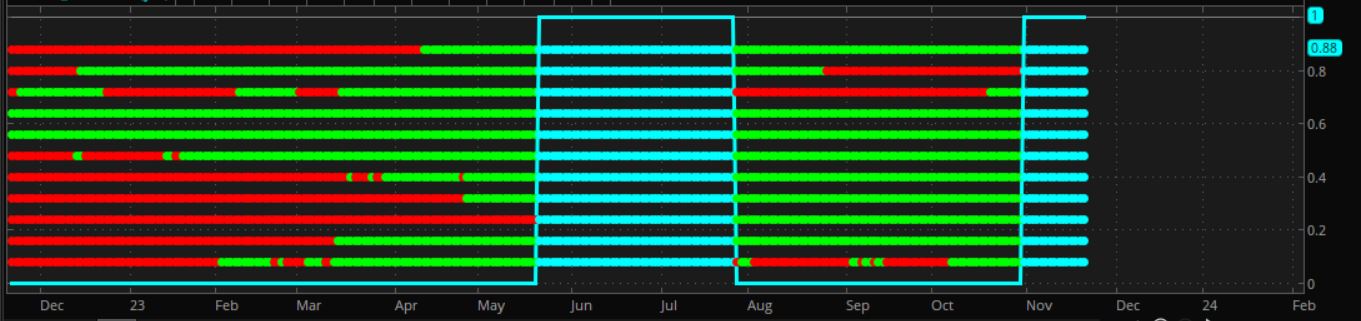
No syntax errors returned but having problems making it a lower study. The converted script also does not produce any visible output on the chart.
#Begin Script
# Fetch volume data
def volume = volume;
def closePrice = close;
# Calculate buy and sell volume
def buyVol;
def sellVol;
if closePrice > closePrice[1] {
buyVol = volume;
sellVol = 0;
} else if closePrice < closePrice[1] {
buyVol = 0;
sellVol = volume;
} else {
buyVol = 0;
sellVol = 0;
}
# Calculate total buy and sell volume
def length = 20; # You can adjust this as needed
def totalBuyVol = Sum(buyVol, length);
def totalSellVol = Sum(sellVol, length);
# Calculate buy and sell volume percentages
def totalVol = totalBuyVol + totalSellVol;
def buyVolPerc = (totalBuyVol / totalVol) * 100;
def sellVolPerc = (totalSellVol / totalVol) * 100;
# Define conditions for high volume
input volThreshold = 70;
def highBuyVolCondition = buyVolPerc >= volThreshold;
def highSellVolCondition = sellVolPerc >= volThreshold;
# Define conditions for high active volume
input volAThreshold = 70;
def highBuyVolACondition = buyVolPerc >= volAThreshold;
def highSellVolACondition = sellVolPerc >= volAThreshold;
# Plot high volume conditions as bubbles
plot highBuyVolBubble = highBuyVolCondition;
plot highSellVolBubble = highSellVolCondition;
highBuyVolBubble.SetPaintingStrategy(PaintingStrategy.BOOLEAN_ARROW_UP);
highBuyVolBubble.SetDefaultColor(Color.GREEN);
highBuyVolBubble.SetLineWeight(1);
highSellVolBubble.SetPaintingStrategy(PaintingStrategy.BOOLEAN_ARROW_DOWN);
highSellVolBubble.SetDefaultColor(Color.RED);
highSellVolBubble.SetLineWeight(1);
# Plot high active volume conditions as bubbles
plot highBuyVolABubble = highBuyVolACondition;
plot highSellVolABubble = highSellVolACondition;
highBuyVolABubble.SetPaintingStrategy(PaintingStrategy.BOOLEAN_ARROW_UP);
highBuyVolABubble.SetDefaultColor(Color.BLUE);
highBuyVolABubble.SetLineWeight(1);
highSellVolABubble.SetPaintingStrategy(PaintingStrategy.BOOLEAN_ARROW_DOWN);
highSellVolABubble.SetDefaultColor(Color.ORANGE);
highSellVolABubble.SetLineWeight(1);
#End Script