ChatGPT, BARD, Other AI Scripts Which Can't Be Used In ThinkOrSwim

MerryDay

Administrative
Staff member
Staff
VIP
Lifetime
90% of the members attempting chatGPT scripting; do not provide good detailed specifications.

Members know what end result that they want but lack the ability to tell chatGPT, the step-by-step logic required to code a script to achieve that end result.
This results in chatGPT providing poor code.

Here is a video on how to successfully have chatGPT create functional scripts.

The above video, explains the basics of providing good specifications to AI which results in better scripts.
AOzhl05.png
 
Last edited:
reply to post135

this has a scale factor, that auto adjusts the histogram, so it will always be at full scale of line plot, 1 to -1.
added a secondary factor (fudge , 1.1 ) to scale it to , 1.1 to -1.1. because very few bars are near the extreme limits.


Code:
#chat135_momentum_trend

#https://usethinkscript.com/threads/chatgpt-bard-other-ai-scripts-which-cant-be-used-in-thinkorswim.13822/page-7#post-127783
#fluna  #135
#I can't get the momentum histogram to show at the same time as the Trend line.


# Trend Momentum Indicator (TMI) for Thinkorswim
# Developed by Fluna
Declare Lower;

def bn = barnumber();

# Input parameters
input trendLength = 14;
input momentumLength = 12;
input volatilityLength = 20;
input momentumThreshold = 0.5;
input volatilityThreshold = 1.0;

# Calculate trend direction
def trend = if close > MovingAverage(AverageType.EXPONENTIAL, close, trendLength) then 1 else -1;

# Calculate momentum
#def momentum = (close - close[momentumLength]) / close[momentumLength];
def momentum2 = (close - close[momentumLength]) / close[momentumLength];

# create a scale factor on bar #1 , to fit the histo to  1 to -1
def scale = if bn == 1 then 1/highestall(absvalue(momentum2)) else scale[1];

#create a factor, so histo extends to 1.1 to -1.1
input fudge = 1.1;
def momentum = momentum2 * scale * fudge;

# Calculate volatility
def volatility = AbsValue(Log(high / low));

# Plot trend line
plot trendLine = trend;
trendLine.SetDefaultColor(Color.CYAN);

# Plot momentum histogram
plot momentumHistogram = momentum;
momentumHistogram.AssignValueColor(if momentum >= momentumThreshold then Color.GREEN else Color.RED);
momentumHistogram.SetPaintingStrategy(PaintingStrategy.HISTOGRAM);
momentumHistogram.SetLineWeight(2);

# Plot volatility line
plot volatilityLine = volatility;
volatilityLine.SetDefaultColor(Color.BLUE);
volatilityLine.SetStyle(Curve.SHORT_DASH);

# Add alerts
alert(trendLine crosses above 0, "Bullish Trend", Alert.BAR, Sound.Bell);
alert(trendLine crosses below 0, "Bearish Trend", Alert.BAR, Sound.Bell);
alert(momentumHistogram crosses above momentumThreshold, "Strong Momentum Up", Alert.BAR, Sound.Chimes);
alert(momentumHistogram crosses below -momentumThreshold, "Strong Momentum Down", Alert.BAR, Sound.Chimes);
alert(volatilityLine crosses above volatilityThreshold, "High Volatility", Alert.BAR, Sound.Ring);
alert(volatilityLine crosses below volatilityThreshold, "Low Volatility", Alert.BAR, Sound.Ring);
#

mGIHUvC.jpg
Thank you halcyonguy!
 

Join useThinkScript to post your question to a community of 21,000+ developers and traders.

Stock Price Extension from 50-SMA via ATR% Multiple Measurement - open source available on Tos?
https://www.tradingview.com/script/...ion-from-50-SMA-via-ATR-Multiple-Measurement/

# ATR% from 50-SMA Scan

# Define variables
input atrMultiplierMin = 7;
input atrMultiplierMax = 10;

# Calculate ATR%
def atrPercentage = (ATR(14) / MovingAverage(AverageType.SIMPLE, close, 50)) * 100;

# Filter for ATR% within range
def scanResults = atrPercentage >= atrMultiplierMin and atrPercentage <= atrMultiplierMax;

# Output scan results
plot scan = scanResults;
 
Last edited by a moderator:
reply to #115
fairvaluegap is a made up word. it has no meaning. if you want a study to do something try listing out the rules that it should follow.
when close crosses this signal, do this.
if close is > 2 signals do this....

what is wrong with the code you posted?
what do you think needs to be changed?

i don't know what fairvaluegap is and i'm not going to go searching for definitions of it and guess i found the correct one. that is the job of the poster, you, to provide all the info you can, so that a stranger, not familiar with your request, can help.

you didn't tell us what 2 studies you looked at. what was wrong with them? why not use them?

you can get a link to a post, by clicking on the post number, then copy the web address.

reply to post122

here is something to find 4 patterns, that might help you figure out what you want.

i found a study of patterns, and copied 4 of them.
ref code - finds many patterns
https://usethinkscript.com/threads/candlestick-moving-avg-library-for-thinkorswim.14100/

i don't know what you want for 'key levels' , so i ignored that part.

referencePoints() isn't a valid function
def keyLevel = referencePoints(keyLevelPercent);

this draws,
white dot for hammer and shooting star,
yellow dot for bearish engulfing,
cyan dot for bullish engulfing

Code:
#chat122_patterns

#https://usethinkscript.com/threads/chatgpt-bard-other-ai-scripts-which-cant-be-used-in-thinkorswim.13822/page-7#post-125739
#jeditron  Jun 4, 2023  #122
#To ChatGPT: create a thinkorswim script that indicates buy and/or sell signals using price action candlestick reversal patterns at key levels or demand and supply zone areas


#I'm receiving an error message for this line: def keyLevel = referencePoints(keyLevelPercent);
#"No such function: referencePoints at 8:16"
#can anyone resolve this? Thanks in advance!

#------------------------------------------------------------------------------

# Candlestick Reversal Patterns with Key Levels/Supply-Demand Zones
# Buy Signal: Reversal pattern bullish candlestick at key support or demand zone
# Sell Signal: Reversal pattern bearish candlestick at key resistance or supply zone
#--------------
# ref
# https://usethinkscript.com/threads/candlestick-moving-avg-library-for-thinkorswim.14100/
#-------------


addlabel(1, "-");

def na = double.nan;
def bn = barnumber();

input keyLevelPercent = 1.0; 
# Percentage deviation from key levels/zones
input reversalPattern = {default "Bullish Engulfing", "Bearish Engulfing", "Hammer", "Shooting Star"};


#---------------------
#bullEngulf(float maxRejectWick = 0.0, bool mustEngulfWick = false) =>
script bullEngulf {
    input maxRejectWick = 0.0;
    input mustEngulfWick = no;
    def topWickSize = AbsValue(Max(close, open) - high);
    def bodySize       = AbsValue( close - open);
    def rejectionRule = maxRejectWick == 0.0 or topWickSize / bodySize < (maxRejectWick / 100);
    plot result = close[1] <= open[1] and close >= open[1] and open <= close[1] and rejectionRule and (!mustEngulfWick or close >= high[1]) and bodySize > 0;
}

#---------------------
#bearEngulf(float maxRejectWick = 0.0, bool mustEngulfWick = false) =>
script bearEngulf {
    input maxRejectWick = 0.0;
    input mustEngulfWick = no;
    def bottomWickSize = AbsValue(Min( close, open) - low);
    def bodySize       = AbsValue( close - open);
    def rejectionRule = maxRejectWick == 0.0 or bottomWickSize / bodySize < (maxRejectWick / 100);
    plot result = close[1] >= open[1] and close <= open[1] and open >= close[1] and rejectionRule and (!mustEngulfWick or close <= low[1]) and bodySize > 0;
}

#---------------------
#hammer(float ratio = 33, float shadowPercent = 5.0) =>
script hammer1 {
    input ratio = 33;
    input shadowPercent = 5.0;
    def topWickSize = AbsValue(Max(close, open) - high);
    def bodySize    = AbsValue( close - open);
    def bodyLow     = Min( close, open);
    def bullRatio = (low - high) * (ratio / 100) + high;
    def hasShadow = topWickSize > shadowPercent / 100 * bodySize;
    plot result   = bodySize > 0 and bodyLow >= bullRatio and !hasShadow;
}

#---------------------
# shooting star
#star(float ratio = 33, float shadowPercent = 5.0) =>
script star1 {
    input ratio = 33;
    input shadowPercent = 5.0;
    def bottomWickSize = AbsValue(Min( close, open) - low);
    def bodySize       = AbsValue( close - open);
    def bodyHigh       = Max( close, open);
    def bearRatio = (high - low) * (ratio / 100) + low;
    def hasShadow = bottomWickSize > shadowPercent / 100 * bodySize;
    plot result   = bodySize > 0 and bodyHigh <= bearRatio and !hasShadow;
}

#--------------------

# hammer function...  doesnt work
#input hammer_0 = 1;
# hammer()   inputs
#length    The number of candles used to calculate the average body height.
#trend setup    The number of preceding candles to check if the trend exists.
#body factor    The factor used when checking if a candle is short. A candle is considered short if its body height is lower than the average multiplied by this factor.
#shadow factor    The factor used when checking if a shadow is long. A shadow is considered long if its length exceeds body height multiplied by this factor.
#input hammer_len = 2;
#input trend_setup = 2;
#input body_factor = 1.0;
#input shadow_factor = 2.0;
#def h = hammer(hammer_len, trend_setup, body_factor, shadow_factor);


#-----------------------------
def v1 = 0.002;

#-----------------------------

input maxRejectWick = 0.0;
input mustEngulfWick = no;

#-----------------------------

def bear_en = bearEngulf(maxRejectWick, mustEngulfWick);
plot zbr = if bear_en then high * (1 + (1*v1)) else na;
zbr.SetPaintingStrategy(PaintingStrategy.POINTS);
zbr.SetDefaultColor(Color.yellow);
zbr.setlineweight(3);
zbr.hidebubble();

#-----------------------------

def bull_en = bullEngulf(maxRejectWick, mustEngulfWick);
plot zbl = if bull_en then low * (1 - (1*v1)) else na;
zbl.SetPaintingStrategy(PaintingStrategy.POINTS);
zbl.SetDefaultColor(Color.cyan);
zbl.setlineweight(3);
zbl.hidebubble();


#-----------------------------

input ratio = 30;
input shadowPercent = 5.0;

# hammer1
def ham = hammer1(ratio, shadowPercent);
plot zh = if ham then high * (1 + (2*v1)) else na;
zh.SetPaintingStrategy(PaintingStrategy.POINTS);
zh.SetDefaultColor(Color.white);
zh.setlineweight(3);
zh.hidebubble();

#-----------------------------
# shooting star
def star = star1(ratio, shadowPercent);
plot zs = if star then low * (1 - (2*v1)) else na;
zs.SetPaintingStrategy(PaintingStrategy.POINTS);
zs.SetDefaultColor(Color.white);
zs.setlineweight(3);
zs.hidebubble();

#-----------------------------


#def keyLevel = referencePoints(keyLevelPercent);
#def pattern;

#switch (reversalPattern) {
#case "Bullish Engulfing":
#    pattern = Engulfing().Bullish;
#case "Bearish Engulfing":
#    pattern = Engulfing().Bearish;
#case "Hammer":
#    pattern = Hammer();
#case "Shooting Star":
#    pattern = ShootingStar();
#}


#def bullishSignal = pattern and low <= keyLevel;
#def bearishSignal = pattern and high >= keyLevel;

#plot BuySignal = bullishSignal;
#plot SellSignal = bearishSignal;

#BuySignal.SetPaintingStrategy(PaintingStrategy.BOOLEAN_ARROW_UP);
#SellSignal.SetPaintingStrategy(PaintingStrategy.BOOLEAN_ARROW_DOWN);
#BuySignal.SetDefaultColor(Color.GREEN);
#SellSignal.SetDefaultColor(Color.RED);

#
 
Stock Price Extension from 50-SMA via ATR% Multiple Measurement - open source available on Tos?
https://www.tradingview.com/script/...ion-from-50-SMA-via-ATR-Multiple-Measurement/

# ATR% from 50-SMA Scan

# Define variables
input atrMultiplierMin = 7;
input atrMultiplierMax = 10;

# Calculate ATR%
def atrPercentage = (ATR(14) / MovingAverage(AverageType.SIMPLE, close, 50)) * 100;

# Filter for ATR% within range
def scanResults = atrPercentage >= atrMultiplierMin and atrPercentage <= atrMultiplierMax;

# Output scan results
plot scan = scanResults;

reply to post145

sorry, i don't know what you are asking for.

this doesn't make sense to me. you will have to use a lot more words to describe your request.
...Stock Price Extension from 50-SMA via ATR% Multiple Measurement...

the link is bad, so i can't read about it. do you have a different link that talks about it?
 
reply to #114
when posting, include a question. tell us about the code.
you just posted some code, so we have no idea what you want.
does it work and you want it modified? does it not work?
where did the code come from?
the code it does not work, on buy signal and sell signal. then i modified buysignal 1 and 2. -> no error but still no worked.
maybe i missed something.

thanks by the way for your time and Efford

# Plotting Buy and Sell signals on chart
plot BuySignal1 = if BuySignal then low else Double.NaN;
plot SellSignal2= if SellSignal then high else Double.NaN;

BuySignal1.SetPaintingStrategy(PaintingStrategy.BOOLEAN_ARROW_UP);
BuySignal1.SetDefaultColor(Color.GREEN);
SellSignal2.SetDefaultColor (Color.RED);
 
Covered Call Strategy Scanner for Stocks with Dividends (Including 3% Dividend Yield Criteria, Uptrend, and Premium Criteria)

Hello, I tried to write a scanner for covered call strategy for dividends stocks that are in uptrend and provide at least 1% in premium. But this script is having some issues and I was hoping if someone could help fix it?

Edit: the issue with this line
Code:
scan criteria = criteria;

Code:
# Covered Call Strategy Scanner for Stocks with Dividends (Including 3% Dividend Yield Criteria, Uptrend, and Premium Criteria)

# Define input parameters
input callStrike = 0.0;
input expirationDate = 30;
input dividendExDate = 7;
input dividendAmount = 0.0;
input minDividendYield = 3;
input minPremiumPercent = 1;

# Calculate expiration date
def expDate = DaysFromDate(GetYYYYMMDD(), expirationDate);

# Calculate dividend date
def divDate = DaysFromDate(GetYYYYMMDD(), dividendExDate);

# Calculate total dividend
def totalDividend = dividendAmount * 100;

# Calculate dividend yield
def dividendYield = (dividendAmount / close) * 100;

# Calculate premium
def premium = (callStrike - close + totalDividend) / close * 100;

# Calculate covered call strategy
def coverCall = if (GetYYYYMMDD() >= dividendExDate && GetYYYYMMDD() < expirationDate) then
                    if (close > callStrike) then
                        close - callStrike + totalDividend
                    else
                        totalDividend
                else if (GetYYYYMMDD() >= expirationDate) then
                    if (close > callStrike) then
                        close - callStrike
                    else
                        0
                else
                    0;

# Define scanner criteria
def uptrend = close > Average(close, 50);
def premiumCriteria = premium >= minPremiumPercent;
def criteria = coverCall > 0 && dividendYield >= minDividendYield && uptrend && premiumCriteria;

# Scan for stocks matching the criteria
scan criteria = criteria;

# Plot the strategy on the scan results
plot ccStrategy = coverCall;
ccStrategy.SetDefaultColor(Color.CYAN);
ccStrategy.SetLineWeight(2);

# Add labels to the scan results
AddLabel(yes, "Covered Call Strategy", Color.CYAN);
AddLabel(yes, "Expiration Date: " + AsDate(expDate), Color.CYAN);
AddLabel(yes, "Call Strike: " + callStrike, Color.CYAN);
AddLabel(yes, "Dividend Ex-Date: " + AsDate(divDate), Color.CYAN);
AddLabel(yes, "Dividend Amount: " + dividendAmount, Color.CYAN);
AddLabel(yes, "Minimum Dividend Yield: " + minDividendYield + "%", Color.CYAN);
AddLabel(yes, "Uptrend: Yes", Color.CYAN);
AddLabel(yes, "Minimum Premium: " + minPremiumPercent + "%", Color.CYAN);
 
Last edited by a moderator:
Does this Work?
Will this machine learning script work well
# Machine Learning-Based Adaptive Indicator with Decision Trees

declare lower;

# Define inputs for machine learning
input lookback = 20;

# Define data variables
def closeData = close;
def volumeData = volume;
# Define your own feature calculations here
def rsi = reference RSI(close, 14);
def sma50 = reference SimpleMovingAvg(close, 50);

# Define machine learning model (Decision Trees)
def model = DecisionTreeRegressor();
model.setMaxDepth(5); // Set the maximum depth of the decision tree
model.setMinSamplesLeaf(10); // Set the minimum number of samples required to form a leaf node

# Define function to fit and predict using the model
def fitAndPredict(model, features, target) {
model.fit(features, target);
return model.predict(features);
}

# Calculate model predictions
def predictions = fitAndPredict(model, closeData, volumeData, rsi, sma50);

# Define threshold for adaptive signals
def threshold = 0.5;

# Define conditions for adaptive signals
def bullishSignal = predictions > threshold;

# Plot adaptive signals on the chart
plot adaptiveSignalPlot = bullishSignal;
adaptiveSignalPlot.SetPaintingStrategy(PaintingStrategy.BOOLEAN_ARROW_UP);
adaptiveSignalPlot.SetDefaultColor(Color.GREEN);
adaptiveSignalPlot.SetLineWeight(3);

# Define function for continuous learning and adaptation
def continuousLearning() {
# Retrieve the latest data
def updatedCloseData = close; // Assuming latest close price is available
def updatedVolumeData = volume;
# Calculate updated features based on the latest data
def updatedRSI = reference RSI(updatedCloseData, 14);
def updatedSMA50 = reference SimpleMovingAvg(updatedCloseData, 50);

# Update the model with the new data
predictions = fitAndPredict(model, updatedCloseData, updatedVolumeData, updatedRSI, updatedSMA50);
}

# Call continuous learning function periodically
AddPeriodicEvent(PeriodType.SECOND, 60, continuousLearning);
 
Last edited by a moderator:
the code it does not work, on buy signal and sell signal. then i modified buysignal 1 and 2. -> no error but still no worked.
maybe i missed something.

thanks by the way for your time and Efford

# Plotting Buy and Sell signals on chart
plot BuySignal1 = if BuySignal then low else Double.NaN;
plot SellSignal2= if SellSignal then high else Double.NaN;

BuySignal1.SetPaintingStrategy(PaintingStrategy.BOOLEAN_ARROW_UP);
BuySignal1.SetDefaultColor(Color.GREEN);
SellSignal2.SetDefaultColor (Color.RED);

reply to post 117 / 148

saying 'it doesn't work' doesn't tell us anything.
would you take a car to a mechanic and say 'it doesn't work' and expect them to figure it out?

if you say that, then you are expecting it do something and it isn't.
tell us what you are expecting it to do. what is missing?

my guess,
at first, it appears to work to me. it draws arrows , but only up arrows . are the down arrows missing ?
there isn't a code to tell the plot to draw them
i added this,
sellSignal2.SetPaintingStrategy(PaintingStrategy.BOOLEAN_ARROW_down);


Code:
# chat117_148

#https://usethinkscript.com/threads/chatgpt-bard-other-ai-scripts-which-cant-be-used-in-thinkorswim.13822/page-6
#8zent

#117
# VWAP Bands Strategy with RSI Filter
# Buy when price crosses below VWAP LowerBand and RSI is below 30
# Sell when price crosses above VWAP UpperBand and RSI is above 70

input numDevDn = -2.0;
input numDevUp = 2.0;
input timeFrame = {default DAY, WEEK, MONTH};

def cap = GetAggregationPeriod();
def errorInAggregation =
timeFrame == timeFrame.DAY and cap >= AggregationPeriod.WEEK or
timeFrame == timeFrame.WEEK and cap >= AggregationPeriod.MONTH;
Assert(!errorInAggregation, "timeFrame should be not less than current chart aggregation period");

def yyyyMmDd = GetYYYYMMDD();
def periodIndx;
switch (timeFrame) {
case DAY:
periodIndx = yyyyMmDd;
case WEEK:
periodIndx = Floor((DaysFromDate(First(yyyyMmDd)) + GetDayOfWeek(First(yyyyMmDd))) / 7);
case MONTH:
periodIndx = RoundDown(yyyyMmDd / 100, 0);
}
def isPeriodRolled = CompoundValue(1, periodIndx != periodIndx[1], yes);

def volumeSum;
def volumeVwapSum;
def volumeVwap2Sum;

if (isPeriodRolled) {
volumeSum = volume;
volumeVwapSum = volume * vwap;
volumeVwap2Sum = volume * Sqr(vwap);
} else {
volumeSum = CompoundValue(1, volumeSum[1] + volume, volume);
volumeVwapSum = CompoundValue(1, volumeVwapSum[1] + volume * vwap, volume * vwap);
volumeVwap2Sum = CompoundValue(1, volumeVwap2Sum[1] + volume * Sqr(vwap), volume * Sqr(vwap));
}
def price = volumeVwapSum / volumeSum;
def deviation = Sqrt(Max(volumeVwap2Sum / volumeSum - Sqr(price), 0));

plot VWAP = price;
plot UpperBand = price + numDevUp * deviation;
plot LowerBand = price + numDevDn * deviation;

VWAP.SetDefaultColor(GetColor(0));
UpperBand.SetDefaultColor(GetColor(2));
LowerBand.SetDefaultColor(GetColor(4));

# RSI Calculation
def length = 14;
def NetChgAvg = MovingAverage(AverageType.EXPONENTIAL, close - close[1], length);
def TotChgAvg = MovingAverage(AverageType.EXPONENTIAL, AbsValue(close - close[1]), length);
def ChgRatio = if TotChgAvg != 0 then NetChgAvg / TotChgAvg else 0;
def RSI = Round(50 * (ChgRatio + 1), 0);

# Strategy
def buySignal = close crosses below LowerBand and RSI < 30;
def sellSignal = close crosses above UpperBand and RSI > 70;

# Plotting Buy and Sell signals on chart
#plot BuySignal = if BuySignal then low else Double.NaN;
#plot SellSignal = if SellSignal then high else Double.NaN;
#BuySignal.SetPaintingStrategy(PaintingStrategy.BOOLEAN_ARROW_UP);
#BuySignal.SetDefaultColor(Color.GREEN);
#SellSignal.SetDefaultColor (Color.RED);


#8zent
#the code it does not work, on buy signal and sell signal. then i modified buysignal 1 and 2. -> no error but still no worked.
#maybe i missed something.
#thanks by the way for your time and Efford

# Plotting Buy and Sell signals on chart
plot BuySignal2 = if BuySignal then low else Double.NaN;
BuySignal2.SetPaintingStrategy(PaintingStrategy.BOOLEAN_ARROW_UP);
BuySignal2.setlineweight(4);
BuySignal2.SetDefaultColor(Color.GREEN);

plot SellSignal2= if SellSignal then high else Double.NaN;
sellSignal2.SetPaintingStrategy(PaintingStrategy.BOOLEAN_ARROW_down);
sellSignal2.setlineweight(4);
SellSignal2.SetDefaultColor (Color.RED);


#--------------------------
addchartbubble(0, low*0.997,
(close crosses below LowerBand) + "\n" +
rsi + "\n" +
BuySignal
, color.yellow, no);

#
 
Does this Work?
Will this machine learning script work well
# Machine Learning-Based Adaptive Indicator with Decision Trees

declare lower;

# Define inputs for machine learning
input lookback = 20;

# Define data variables
def closeData = close;
def volumeData = volume;
# Define your own feature calculations here
def rsi = reference RSI(close, 14);
def sma50 = reference SimpleMovingAvg(close, 50);

# Define machine learning model (Decision Trees)
def model = DecisionTreeRegressor();
model.setMaxDepth(5); // Set the maximum depth of the decision tree
model.setMinSamplesLeaf(10); // Set the minimum number of samples required to form a leaf node

# Define function to fit and predict using the model
def fitAndPredict(model, features, target) {
model.fit(features, target);
return model.predict(features);
}

# Calculate model predictions
def predictions = fitAndPredict(model, closeData, volumeData, rsi, sma50);

# Define threshold for adaptive signals
def threshold = 0.5;

# Define conditions for adaptive signals
def bullishSignal = predictions > threshold;

# Plot adaptive signals on the chart
plot adaptiveSignalPlot = bullishSignal;
adaptiveSignalPlot.SetPaintingStrategy(PaintingStrategy.BOOLEAN_ARROW_UP);
adaptiveSignalPlot.SetDefaultColor(Color.GREEN);
adaptiveSignalPlot.SetLineWeight(3);

# Define function for continuous learning and adaptation
def continuousLearning() {
# Retrieve the latest data
def updatedCloseData = close; // Assuming latest close price is available
def updatedVolumeData = volume;
# Calculate updated features based on the latest data
def updatedRSI = reference RSI(updatedCloseData, 14);
def updatedSMA50 = reference SimpleMovingAvg(updatedCloseData, 50);

# Update the model with the new data
predictions = fitAndPredict(model, updatedCloseData, updatedVolumeData, updatedRSI, updatedSMA50);
}

# Call continuous learning function periodically
AddPeriodicEvent(PeriodType.SECOND, 60, continuousLearning);

no
this appears to be a mixture of 2+ languages, meaning some functions are not thinkscript functions. they don't have any corresponding functions in thinkscript.
in other words almost every line is wrong. even the RSI() is wrong, wrong parameters.

example, no idea what this is, but it doesn't exist.
DecisionTreeRegressor()

if you load a study and it has highlighted red areas, you can look up the functions to see if they exist or are misspelled. sometimes words are white, not red, so it can be hard to tell which ones are bad.
https://tlc.thinkorswim.com/center/reference/thinkScript
 
I am sure this is a simple fix. However, I have looked at it so long that I am requesting fresh eyes and assistance. The following error is produced

Invalid statement: switch at 82:1
Invalid statement: } at 86:5
Invalid statement: } at 90:5
Invalid statement: } at 94:5
Invalid statement: } at 98:5
Invalid statement: } at 102:5


declare lower;

input symbol = "AAPL";# Stock symbol
input length = 30; # Indicator length
input lengthType = {default YEAR, MONTH, WEEK, DAY, HOUR}; # Length type selection

# Fetch stock price
def price = close(symbol = symbol);

# Calculate Wilder's RSI
def netChgAvg = WildersAverage(price - price[1], length);
def totChgAvg = WildersAverage(AbsValue(price - price[1]), length);
def RS = if totChgAvg != 0 then netChgAvg / totChgAvg else 0;
def wildersRSI = 50 * (RS + 1);

# Plot line for stock price
plot priceLine = price;
priceLine.AssignValueColor(if price > price[1] then Color.GREEN else if price < price[1] then Color.RED else Color.GRAY);
priceLine.SetDefaultColor(Color.GRAY);
priceLine.SetLineWeight(2);

# Signal to buy when 30-week RSI rises above zero
plot buySignal = wildersRSI > 0;
buySignal.SetPaintingStrategy(PaintingStrategy.BOOLEAN_ARROW_UP);
buySignal.SetDefaultColor(Color.GREEN);
buySignal.SetLineWeight(2);

# Label to display Wilder's RSI value and bullish/bearish indication
AddLabel(yes, "Wilder's RSI: " + Round(wildersRSI, 2), if wildersRSI > 0 then Color.GREEN else if wildersRSI < 0 then Color.RED else Color.GRAY);
AddLabel(yes, if wildersRSI > 0 then "Bullish" else if wildersRSI < 0 then "Bearish" else "", if wildersRSI > 0 then Color.GREEN else if wildersRSI < 0 then Color.RED else Color.GRAY);

# Label to display stock price and name
AddLabel(yes, "Price: " + AsDollars(price) + " | Stock: " + symbol, Color.YELLOW);

# Conversion factor based on length type
def conversionFactor;
if lengthType == lengthType.YEAR {
conversionFactor = 52; #Assuming 52 weeks in a year
} else if lengthType == lengthType.MONTH {
conversionFactor = 4; # Assuming 4 weeks in a month
} else if lengthType == lengthType.WEEK {
conversionFactor = 1;
} else if lengthType == lengthType.DAY {
conversionFactor = 1 / 7; # Converting to weeks
} else if lengthType == lengthType.HOUR {
conversionFactor = 1 / 168; # Converting to weeks (assuming 24 hours in a day and 7 days in a week)
} else {
conversionFactor = 1; # Default value if lengthType is not recognized
}

# Length in weeks based on length type
def lengthInWeeks = length * conversionFactor;

# Stage calculation based on Stan Weinstein's methodology
def stage;
def ma30 = MovingAverage(AverageType.SIMPLE, price, 30);
def ma150 = MovingAverage(AverageType.SIMPLE, price, 150);
def ma30Higher = ma30 > ma150;
def ma30Lower = ma30 < ma150;
def priceAboveMa30 = price > ma30;
def priceAboveMa150 = price > ma150;
def priceBelowMa30 = price < ma30;
def priceBelowMa150 = price < ma150;
def priceAboveBothMa = priceAboveMa30 and priceAboveMa150;
def priceBelowBothMa = priceBelowMa30 and priceBelowMa150;

if ma30Higher and priceAboveBothMa {
stage = 2;
} else if ma30Higher and priceBelowMa30 {
stage = 1;
} else if ma30Lower and priceBelowBothMa {
stage = 4;
} else if ma30Lower and priceAboveMa30 {
stage = 3;
} else {
stage = 0;
}

# Label to display the stock's stage
def stageLabel;
def stageColor;
switch (stage) {
case 1 {
stageLabel = "Stage 1: Basing";
stageColor = Color.GREEN;
}
case 2 {
stageLabel = "Stage 2: Advancing";
stageColor = Color.BLUE;
}
case 3 {
stageLabel = "Stage 3: Topping";
stageColor = Color.RED;
}
case 4 {
stageLabel = "Stage 4: Declining";
stageColor = Color.MAGENTA;
}
default {
stageLabel = "N/A";
stageColor = Color.GRAY;
}
}

AddLabel(yes, "Stage: " + stageLabel, stageColor);

can't assign a color to a variable
 
Question, does this Forum restrict AI generated indicator codes to be posted?

Also a consideration, is if the poster is the finder and if he should place his name on the code or if there is to be a general understand its just AI code?
 
Question, does this Forum restrict AI generated indicator codes to be posted?

Also a consideration, is if the poster is the finder and if he should place his name on the code or if there is to be a general understand its just AI code?
There is no restriction on AI generated code being posted to the forum.

The issue that arises is that 90% of the members attempting chatGPT scripting; do not provide good detailed specifications.

The disconnect is where members know what end result that they want but lack the programming ability to tell chatGPT, the step-by-step logic required to code a script which will achieve that end result.
This results in chatGPT providing poor code.
That code ends up in this thread.

Members with the ability to provide clean specs to chatGPT that results in good code;
have every right to post and put their name on that code.
 
Last edited:
I guess you can count me into that 90% MerryDay is talking about on probably not asking/giving ChatGBT the correct input to get the desired result. I have created a Strategy which ChartGBT has helped immensely, however I now have reached a point where it's telling me I might want to seek a new trading platform to get the results I am asking for. The issue is when I try to get a start time for the strategy added. Thinkscript is not accepting: # Input to manually enable/disable the strategy, # Input for start time, and # Check if current time is after the start time syntax. The error messages are Invalid statement messages for all. The actuals are posted below. If any real Human could please take a look and give an opinion I would appreciate it.

# Input to manually enable/disable the strategy
input bool enableStrategy = yes;

# Input for start time
input int startHour = 9; // Change to the desired start hour
input int startMinute = 30; // Change to the desired start minute

# Check if current time is after the start time
def afterStartTime = SecondsFromTime(startHour * 60 + startMinute) >= 0;

chatgpt confuses other scripts with thinkscript. that looks like pike code.

you could try looking at the learning pages for thingkscript, and verify how to use functions and check if they exist.
input is a valid function. it doesn't need int to spec the type of variable, just a variable name
// is a pine thing, not used in thinkscript.
SecondsFromTime() wants data in HHMM format , not minutes

if you don't understand the programming language, how do you know if the code that chatgpt generates, is valid, and does what you want?

i suggest start learning thinkscript.

Code:
# Input to manually enable/disable the strategy
input enableStrategy = yes;

# Input for start time
input startHour = 9;
#  Change to the desired start hour

input startMinute = 30;
#  Change to the desired start minute

# calc time in HHMM format
def t = (startHour * 100 + startMinute);

# Check if current time is after the start time
def  afterStartTime = SecondsFromTime(t) >= 0;
#


https://tlc.thinkorswim.com/center/reference/thinkScript/Reserved-Words/input
https://tlc.thinkorswim.com/center/reference/thinkScript/Functions/Date---Time/SecondsFromTime
 
Last edited by a moderator:
Using AI like ChatGPT is new to me. I'd like to use it to answer my questions on programming with ThinkScript. Has anyone made a video tutorial on how to do this?
 
Using AI like ChatGPT is new to me. I'd like to use it to answer my questions on programming with ThinkScript. Has anyone made a video tutorial on how to do this?
Whether pinescript, thinkscript, MT4, etc...
The key to good AI code is clean specs.
https://usethinkscript.com/threads/...ant-be-used-in-thinkorswim.13822/#post-115063

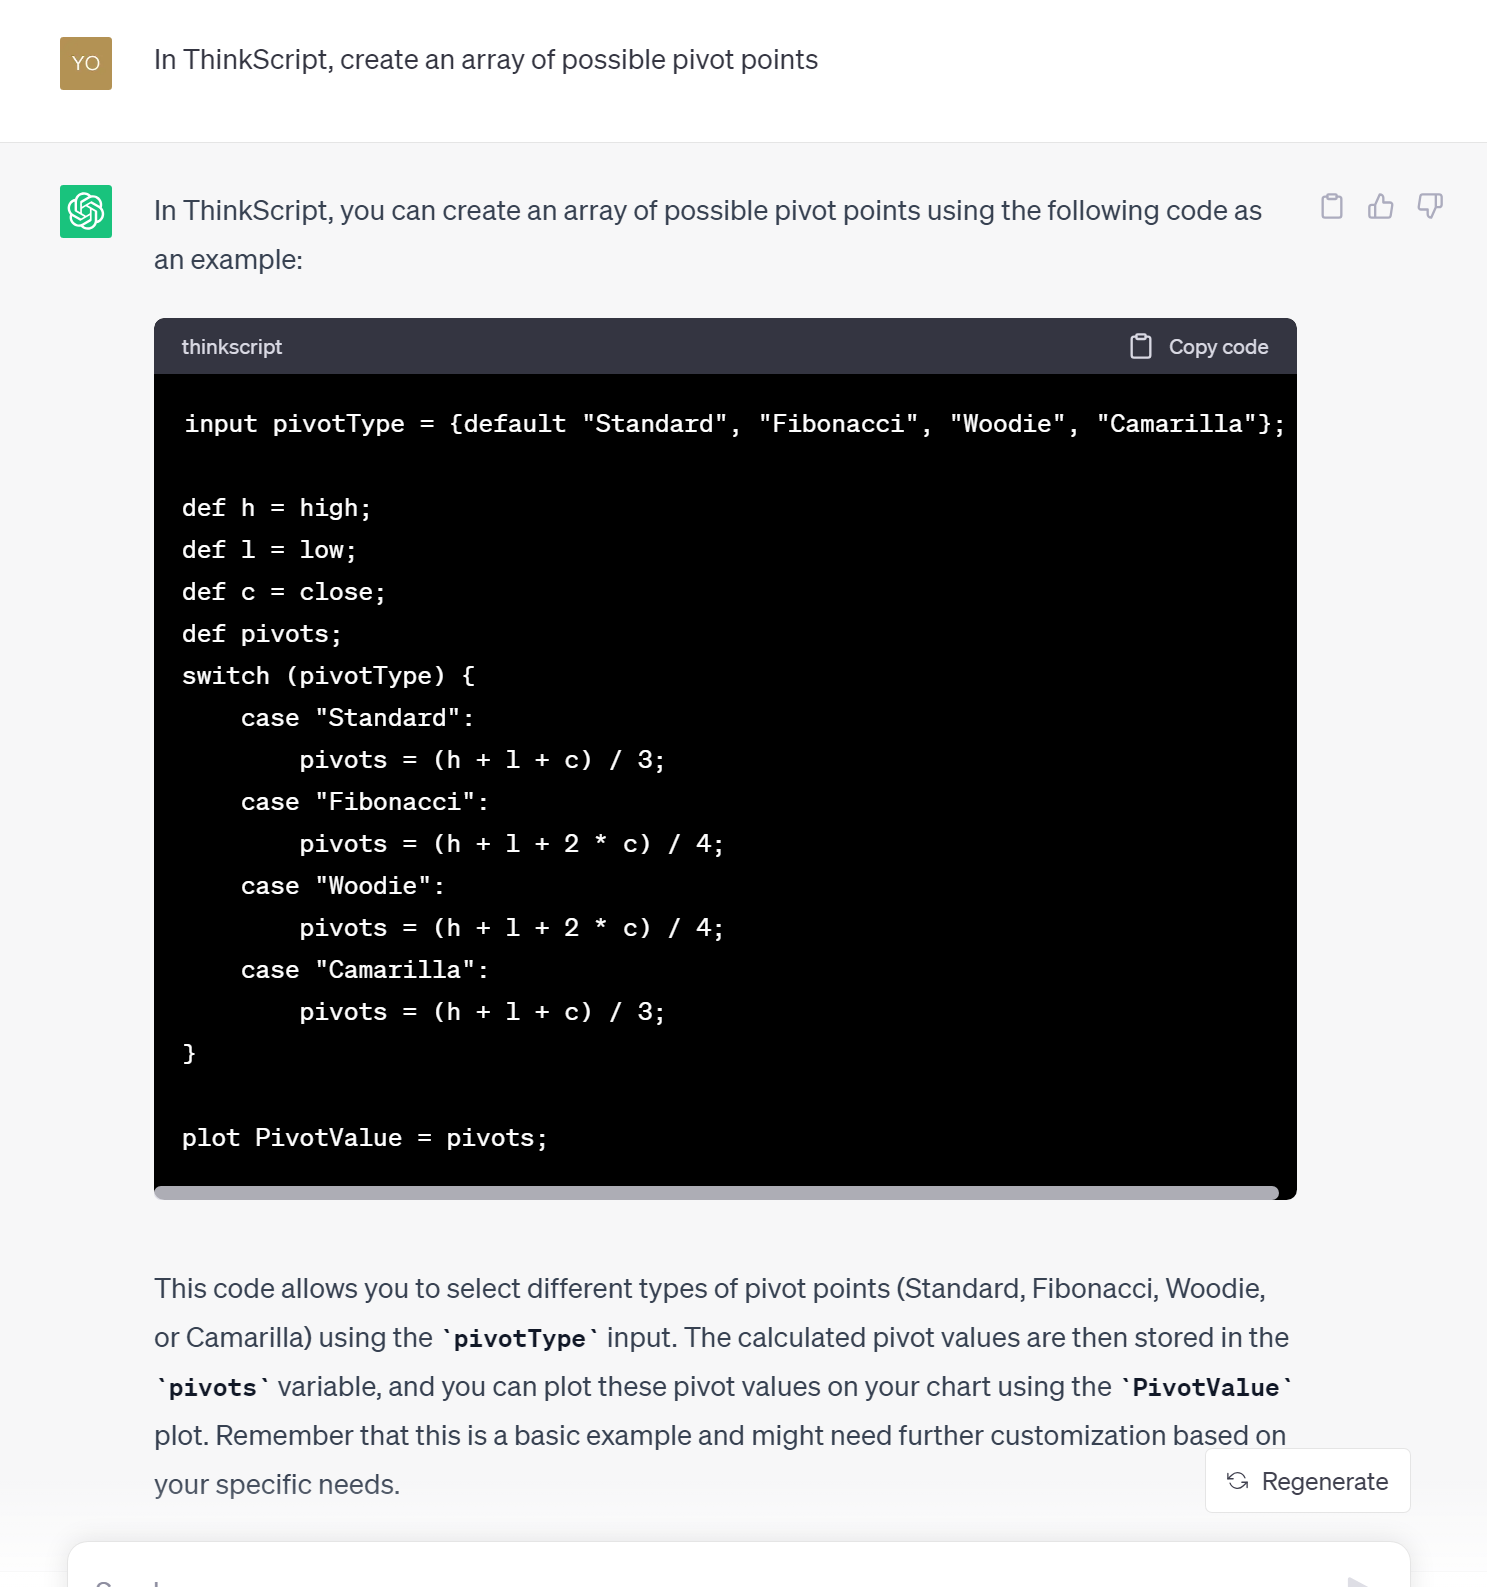
Here is an example of a clean concise AI request:
NrfD58I.png


The reason most AI ThinkScript code fails:
1. Failure to communicate. The AI has no idea what you want, so it codes garbage.
Clear Clean Specs leads to Good Clean Code.

2. The request is for something ThinkScript can't do; so it codes garbage

Tips & Tricks:
Don't ask it to create a strategy from start to finish.

Create the inputs; test them out. Is it giving you what you need?
Go back, refine.

Feed the inputs back to AI and ask it to:
Create the definitions and calculations. You must test them out.
ThinkScript is NOT a programming language.
So this is where, programmers like yourself are going to run into frustrations.
You can't ask AI to create the many type of routines, that you are used to having access to, in real programming languages. They simply don't exist in ToS.
AI will create non-existent functions in its attempt to answer your request, and you will end up with garbage code.

Once you have inputs and definitions, you can feed them back into your AI request and
format your plots.
This is a weakness in AI. While inputs, calculations, definitions have commonality in most scripting languages; formatting in ThinkScript is uniquely ThinkScript.
AI is learning and getting better every day. But ThinkScript charting on an advance level is a struggle.
When AI doesn't have the answer, it tends to substitute python and hope for the best.
Which creates garbage code.
 
GetTime is not working
What can I used to replace the "GetTime" that will allow this thinkscript to work properly?

# Define the target time as HHMM (24-hour format)
input targetTime = 1245;

# Calculate the current time in HHMM (24-hour format)
def currentHour = GetTime / 100;
def currentMinute = GetTime % 100;
def currentTimeHHMM = currentHour * 100 + currentMinute;

# Check if the current time matches the target time
def isLunchTime = currentTimeHHMM == targetTime;

# Condition to check if it's lunchtime
plot showLunchLabel = isLunchTime;
showLunchLabel.SetPaintingStrategy(PaintingStrategy.BOOLEAN_ARROW_UP);
showLunchLabel.SetDefaultColor(Color.GREEN);
showLunchLabel.SetLineWeight(2);

# Label for lunchtime
AddLabel(yes, "LUNCH", Color.GREEN);

gettime is a number of milli seconds, from some date in the past ( epoch (January 1, 1970, 00:00:00 GMT).
when using gettime, need to add () , gettime()

what you want to use is,
https://tlc.thinkorswim.com/center/reference/thinkScript/Functions/Date---Time/SecondsTillTime

Code:
input targetTime = 1245;
def x = if SecondsTillTime(targetTime) == 0 then 1 else 0;
plot z = x;
z.SetPaintingStrategy(PaintingStrategy.BOOLEAN_ARROW_UP);
#
 
Whether pinescript, thinkscript, MT4, etc...
The key to good AI code is clean specs.
https://usethinkscript.com/threads/...ant-be-used-in-thinkorswim.13822/#post-115063

Here is an example of a clean concise AI request:
NrfD58I.png


The reason most AI ThinkScript code fails:
1. Failure to communicate. The AI has no idea what you want, so it codes garbage.
Clear Clean Specs leads to Good Clean Code.

2. The request is for something ThinkScript can't do; so it codes garbage

Tips & Tricks:
Don't ask it to create a strategy from start to finish.

Create the inputs; test them out. Is it giving you what you need?
Go back, refine.

Feed the inputs back to AI and ask it to:
Create the definitions and calculations. You must test them out.
ThinkScript is NOT a programming language.
So this is where, programmers like yourself are going to run into frustrations.
You can't ask AI to create the many type of routines, that you are used to having access to, in real programming languages. They simply don't exist in ToS.
AI will create non-existent functions in its attempt to answer your request, and you will end up with garbage code.

Once you have inputs and definitions, you can feed them back into your AI request and
format your plots.
This is a weakness in AI. While inputs, calculations, definitions have commonality in most scripting languages; formatting in ThinkScript is uniquely ThinkScript.
AI is learning and getting better every day. But ThinkScript charting on an advance level is a struggle.
When AI doesn't have the answer, it tends to substitute python and hope for the best.
Which creates garbage code.
Yes, I'm finding that it can be tricky to obtain ThinkScript code with out errors from ChatGPT3.5. I haven't subscribed to ChatGPT4 to see if its better at coding. Which version are you using, MerryDay?
 

Similar threads

Not the exact question you're looking for?

Start a new thread and receive assistance from our community.

87k+ Posts
312 Online
Create Post

Similar threads

Similar threads

The Market Trading Game Changer

Join 2,500+ subscribers inside the useThinkScript VIP Membership Club
  • Exclusive indicators
  • Proven strategies & setups
  • Private Discord community
  • ‘Buy The Dip’ signal alerts
  • Exclusive members-only content
  • Add-ons and resources
  • 1 full year of unlimited support

Frequently Asked Questions

What is useThinkScript?

useThinkScript is the #1 community of stock market investors using indicators and other tools to power their trading strategies. Traders of all skill levels use our forums to learn about scripting and indicators, help each other, and discover new ways to gain an edge in the markets.

How do I get started?

We get it. Our forum can be intimidating, if not overwhelming. With thousands of topics, tens of thousands of posts, our community has created an incredibly deep knowledge base for stock traders. No one can ever exhaust every resource provided on our site.

If you are new, or just looking for guidance, here are some helpful links to get you started.

What are the benefits of VIP Membership?
VIP members get exclusive access to these proven and tested premium indicators: Buy the Dip, Advanced Market Moves 2.0, Take Profit, and Volatility Trading Range. In addition, VIP members get access to over 50 VIP-only custom indicators, add-ons, and strategies, private VIP-only forums, private Discord channel to discuss trades and strategies in real-time, customer support, trade alerts, and much more. Learn all about VIP membership here.
How can I access the premium indicators?
To access the premium indicators, which are plug and play ready, sign up for VIP membership here.
Back
Top