90% of the members attempting chatGPT scripting; do not provide good detailed specifications.
Members know what end result that they want but lack the ability to tell chatGPT, the step-by-step logic required to code a script to achieve that end result.
This results in chatGPT creating non-working garbage code.
Here is a video on how to successfully have chatGPT create functional scripts.
The above video, explains the basics of providing good specifications to AI which results in better scripts.
Not sure if this is the right place for this thread, but I'll give it a try.
I've been reading Brian Shannon's Book "Anchored VWAP" and found it to be very helpful even for intraday trading. I began writing an AWAP thinkscript which is in the spirit of the book.
Objective: Create a thinkscript that draws 2 separate AVWAP lines, one anchored to the High-Of-Day and the other to the Low-Of-Day.
Potential issues: I'm not sure if thinkscript can redraw the AVWAP lines if the HOD/LOD changes.
Code snippet of something I tried
----
Ruby:
#for ETH to RTH crossover and day to day crossover.
def isCrossover = (isRTH and !isRTH[1]) or (GetYYYYMMDD() != GetYYYYMMDD()[1]);

#Get High Of Day
def hodValue = if isCrossover then high
    else if high > hodValue[1] then high
    else hodValue[1];

#Get the timestamp of the HOD - to be used for identifying bars past this time for VWAP calculation
def getHodTime = if high == HighestAll(hodValue) then GetTime() else getHodTime[1];

def postHod = if SecondsTillTime(getHodTime) <= 0 then 1 else 0;
#I get an error on this previous line due to getHodTime not being constant.
---
The thought was to get the timestamp of the HOD, the apply the following code to calculate AVWAP. The following is not my code but I've seen it on the forums and it works well.
---
Ruby:
input anchorTime = 1030;
def postAnchorTime = if SecondsTillTime(anchorTime) <= 0 and today then 1 else 0;

plot anchoredVWAP = TotalSum(if postAnchorTime then ((high+low+close+open)/4)*(volume) else 0)/TotalSum(if postAnchorTime then volume else 0);
---
How do i get AVWAP to anchor to the HOD and LOD?
The screenshot is what' i'm looking for. Note: the screenshot had anchor points set manually. I'm looking for auto anchor points attached to the HOD/LOD.
# VWAP Bands Strategy with RSI Filter
# Buy when price crosses below VWAP LowerBand and RSI is below 30
# Sell when price crosses above VWAP UpperBand and RSI is above 70
def cap = GetAggregationPeriod();
def errorInAggregation =
timeFrame == timeFrame.DAY and cap >= AggregationPeriod.WEEK or
timeFrame == timeFrame.WEEK and cap >= AggregationPeriod.MONTH;
Assert(!errorInAggregation, "timeFrame should be not less than current chart aggregation period");
# Strategy
def buySignal = close crosses below LowerBand and RSI < 30;
def sellSignal = close crosses above UpperBand and RSI > 70;
# Plotting Buy and Sell signals on chart
plot BuySignal = if BuySignal then low else Double.NaN;
plot SellSignal = if SellSignal then high else Double.NaN;
I was trying to write a code that calculates the distance from 9ema to the VWAP, but there is something wrong as the result is not correct, Can anyone take a look at this script to see what is the problem? Thanks for your help.
Here is the code:
# Calculate the 9EMA for the current chart time frame
input length = 9;
def ema9 = ExpAverage(close, length);
# Calculate the VWAP for the current chart time frame
def vwapValue = vwap;
# Calculate the distance between 9EMA and VWAP
def distance = ema9 - vwapValue;
# Calculate the percentage distance between 9EMA and VWAP
def percentageDistance = (distance / vwapValue) * 100;
# Display the percentage distance as a label on the chart
AddLabel(yes, "Distance from VWAP (%): " + AsPercent(percentageDistance / 100), Color.WHITE);
PLEASE HELP ME
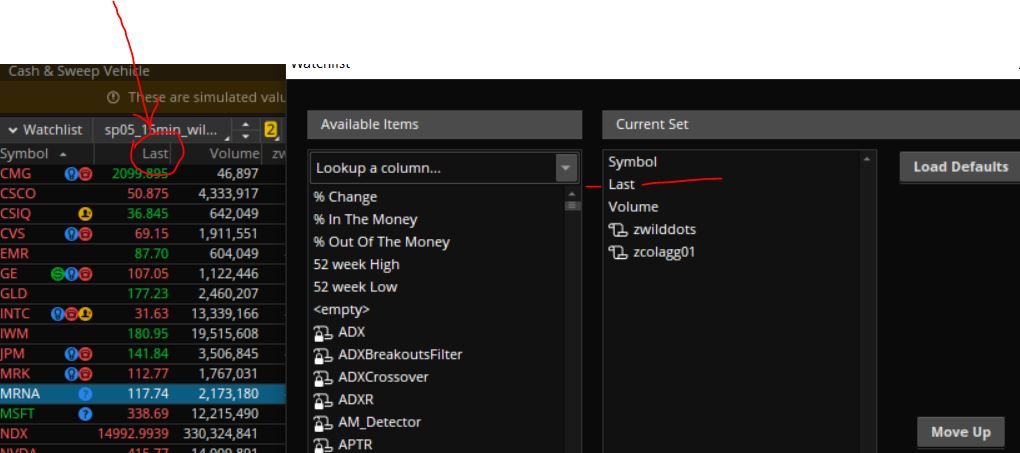
Not sure if it's possible but, I need script so my watchlist will display EXACT LAST TRADED PRICE for stocks in afterhours session. Not Last closing price, not BID or ASK, no MARK price which is very misleading, but Last price of the stack value traded last - not always but should be betwen of BID ans ASK range.
I was able to find one for displaying EXACT LAST price on Chart, but I must have one in watchlist somehow. Is it anyone that can HELP?? Please.
P.S. This script for displaying last price on chart - but I need one in watchlist >
# After Hours Last Price
# Displays the exact last price of a stock during aftermarket trading session
declare lower;
# Define the aggregation period (e.g., 1 minute, 5 minutes, etc.)
input aggregationPeriod = AggregationPeriod.MIN;
# Calculate the aftermarket last price
def lastPrice = close(period = aggregationPeriod);
plot AfterHoursLastPrice = lastPrice;
# Customize the appearance of the plot
AfterHoursLastPrice.SetDefaultColor(color.white);
AfterHoursLastPrice.SetStyle(Curve.SHORT_DASH);
I've been currently running a Delta indicator similar to the MACD. Essentially I asked Chatgpt to code me a delta indicator along with a moving average line and took the histogram section of the MACD and applied it together. The issue Im running into is when the delta reaches an upper threshold and lower threshold. It double.nan and disables it from the chart. Can anyone help me fix this section of the script so that it doesn't double.nan and still plots the last known number?
Here's the script:
Line 32 is where my issue is and Im just not advanced enough to figure it out.
Ruby:
declare lower;

# Define the input parameters
input length = 20;
input showDeltaExp = yes;
input DexTrendLbl = yes;
input DexStrengthLbl = yes;
input DiffLbl = yes;

# Define the plot data
def delta = Delta();
def deltaExp = TEMA(delta - delta[length]);
def deltaAccum = Sum(deltaExp, length);

# Add a zero line to the chart
plot ZeroLine = 0;
ZeroLine.SetDefaultColor(Color.GRAY);
ZeroLine.SetStyle(Curve.SHORT_DASH);


# Calculate the smoothed line using a simple moving average
def smaDeltaExp = SimpleMovingAvg(deltaExp, length);


# Plot the smoothed line
plot SmoothedLine = smaDeltaExp;
SmoothedLine.AssignValueColor(if Smoothedline > zeroline then Color.green else color.dark_red);
SmoothedLine.HideBubble();
SmoothedLine.HideTitle();


# Plot The Diff
plot Diff = deltaExp - smoothedLine;
Diff.SetDefaultColor(GetColor(5));
Diff.SetPaintingStrategy(PaintingStrategy.HISTOGRAM);
Diff.SetLineWeight(3);
Diff.DefineColor("Positive and Up", Color.GREEN);
Diff.DefineColor("Positive and Down", Color.DARK_GREEN);
Diff.DefineColor("Negative and Down", Color.RED);
Diff.DefineColor("Negative and Up", Color.dark_red);
Diff.AssignValueColor(if Diff >= 0 then if Diff > Diff[1] then Diff.color("Positive and Up") else Diff.color("Positive and Down") else if Diff < Diff[1] then Diff.color("Negative and Down") else Diff.color("Negative and Up"));


# Add a legend
AddLabel(DexTrendLbl, "DeXTrend: " + AsText(deltaExp, NumberFormat.TWO_DECIMAL_PLACES), if DeltaExpansion > 0 then Color.GREEN else Color.Yellow);


AddLabel(DiffLbl, "Diff: " + AsText(diff, NumberFormat.TwO_DECIMAL_PLACES),  if Diff < 0 then Color.Red else if Diff > .5 then color.dark_orange else if Diff < -.5 then color.dark_orange else color.green);
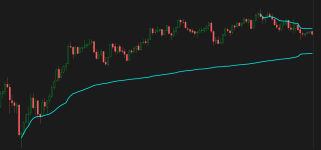
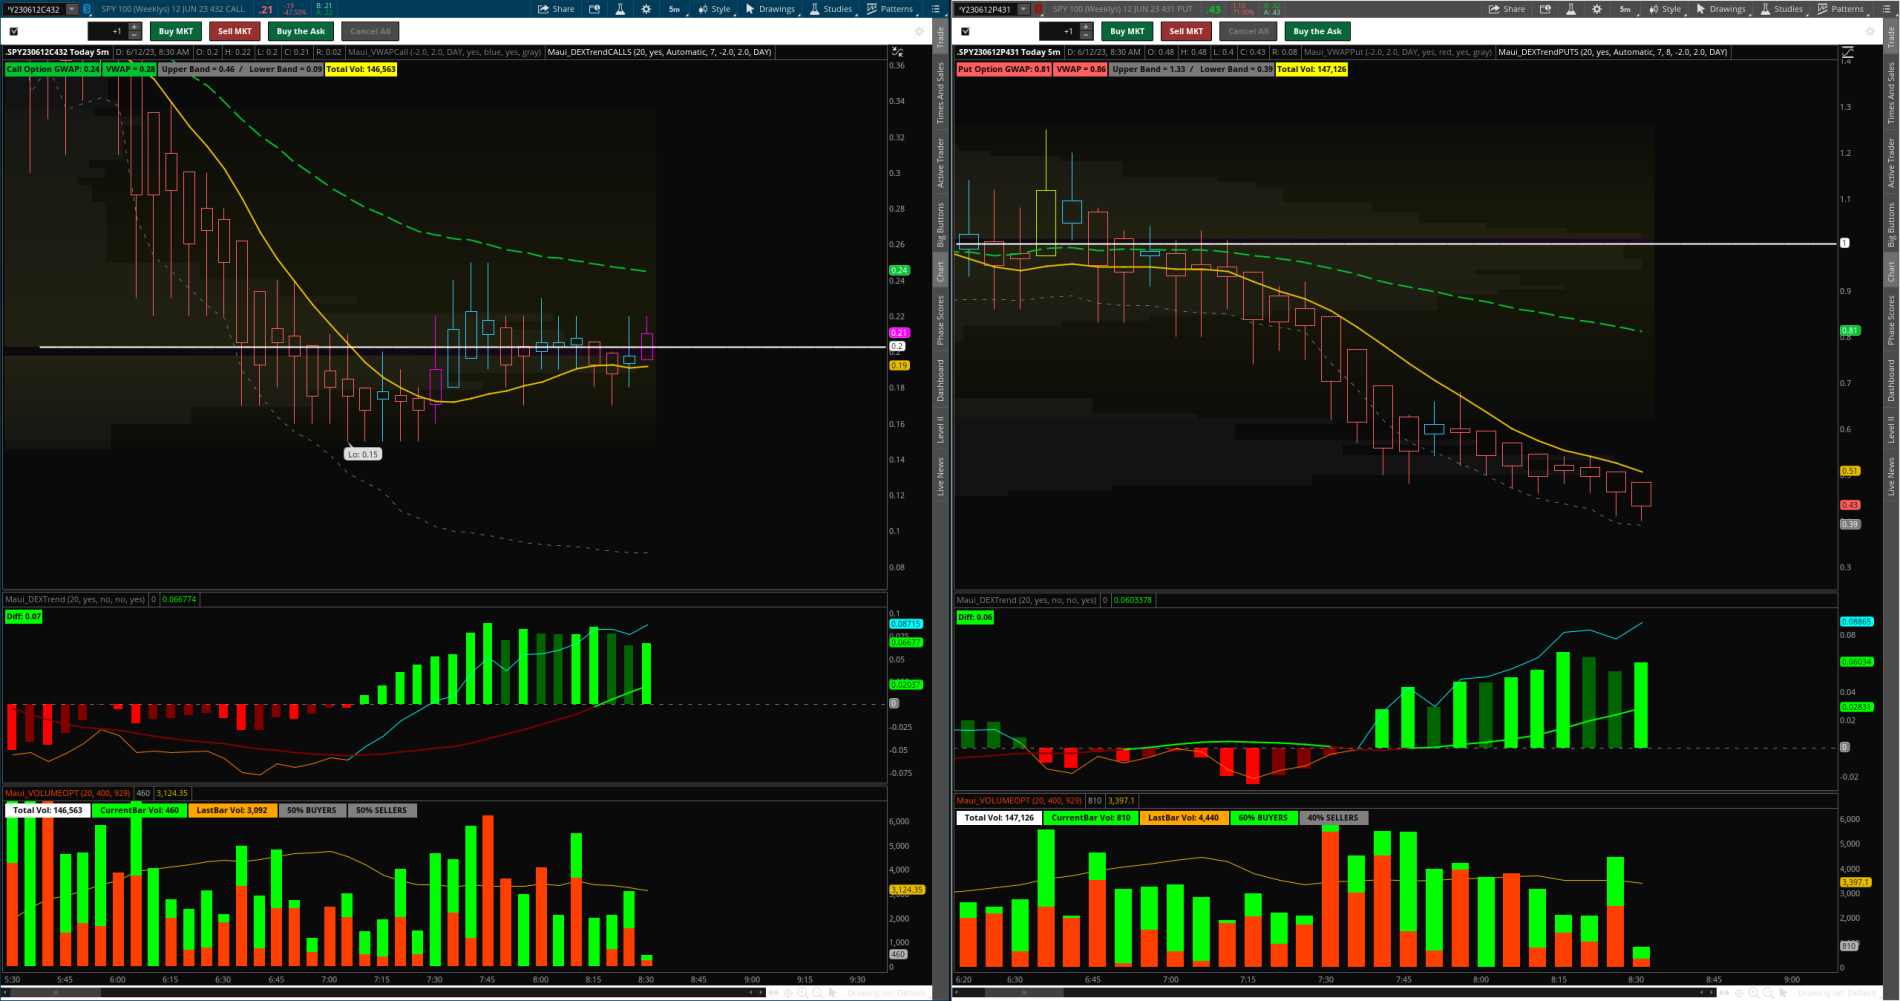
Here's a photo of what its suppose to look like when there is strength to the call side, as well as another indicator on the price chart that paintbars the magenta for entries. Has similar coding.
This is what i get when it double.nan's. Which also removes the magenta paintbar.
any help would be greatly appreciated and would further educate me in coding as well to fix the GWAP indicator as well when it Nan's out or zeros. Thank you!
that's great if it can provide something useful for your project.
i agree, new technology always seems to shift the job market, usually to something more automated related.
my beef with it is, people who don't know any thinkscript are asking it to generate a code, and expect it to work, and it doesn't. i think a tool shouldn't exist until it works.
i have no position to protect. i'm just a guy, doing a hobby. i have random pockets of free time, that i like to use to volunteer on this site, to help out others.
why is it i see Nothing on Using CHAT GPT in regards to what it can or cannot do
with ThinkScript . R there any working Prompts .what up with the silence .
He managed to get correction done on the errors. He apparently asked ChatGPT to correct the specific error and got the correction that worked. Good Luck.
can one help please. this code from chat has error:
# Define input parameters
input underlyingSymbol = "SPX";
input volatility = imp_volatility(underlyingSymbol);
# Get option data
def optionChain = OptionChain(underlyingSymbol, GetYYYYMMDD());
def strikeCount = optionChain.GetStrikeCount();
def closePrice = close(underlyingSymbol);
Hello - I'm new to the forum and I'm hoping someone can help me fix this momentum indicator i've been working on. I can't get the momentum histogram to show at the same time as the Trend line. Can anyone help?
Hello - I'm new to the forum and I'm hoping someone can help me fix this momentum indicator i've been working on. I can't get the momentum histogram to show at the same time as the Trend line. Can anyone help?
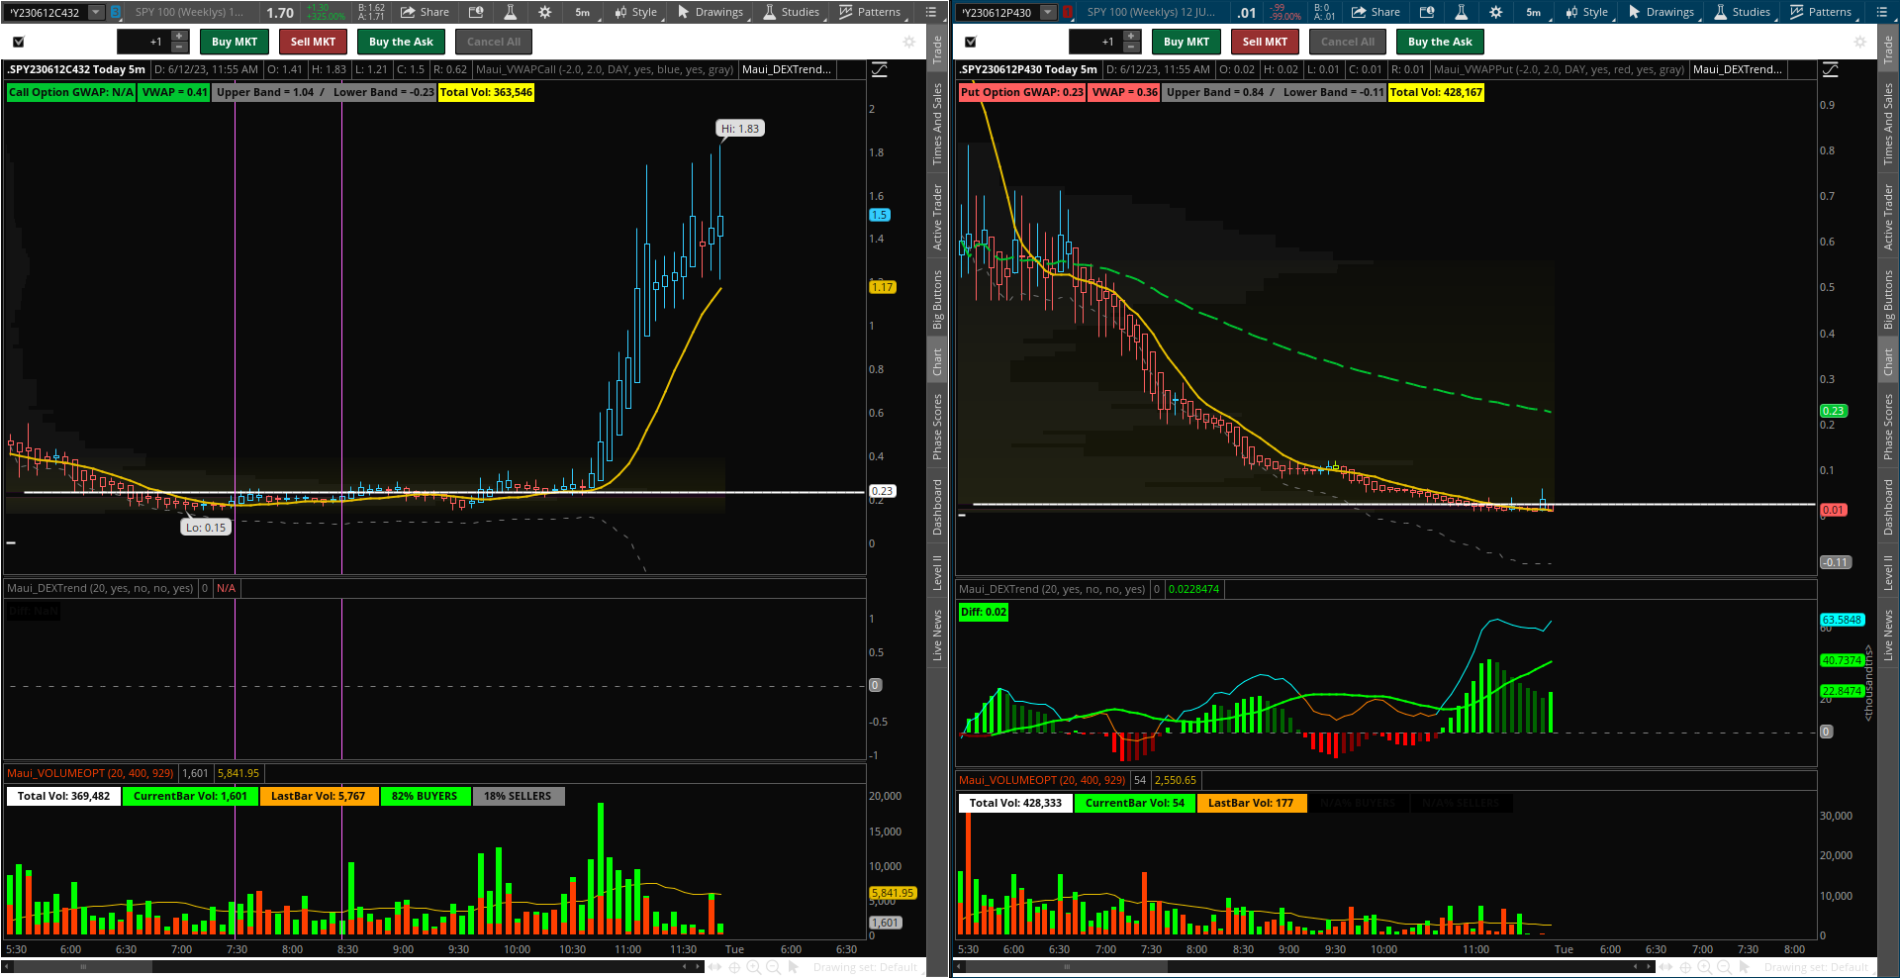
All are plotting, the issue comes down to the mathematical results. Since your trend line will always be +1 or -1, the small values for your histogram and vol line results are much smaller values (.0011975 and .0044909, respectively, for 7/5/23) relative to the +/-1, so they're barely blips on the graph. Multiply the results of these by 10 or 100 to shift the decimal over and you'll now have results that will better show visual change in values against your +/-1 range.
you didn't describe what you are trying to do, so i can't fix this.
i can get rid of the errors, and have some lines draw, but i have no idea if it's what you want.
this is a strategy. it has addorder() functions.
this is plotting variations of what are normally lower studies, macd and rsi, on the main chart.
there is no function called OptimizeDataRange( ).
no idea what you want for this,
def optimalTimeFrame = OptimizeDataRange(5, 60, 5, "minutes"); # Time frame optimization range
verify average function parameters. using optimalTimeFrame as a length in average.
def fastMA = MovingAverage(AverageType.EXPONENTIAL, close, optimalTimeFrame);
Hello - I'm new to the forum and I'm hoping someone can help me fix this momentum indicator i've been working on. I can't get the momentum histogram to show at the same time as the Trend line. Can anyone help?
this has a scale factor, that auto adjusts the histogram, so it will always be at full scale of line plot, 1 to -1.
added a secondary factor (fudge , 1.1 ) to scale it to , 1.1 to -1.1. because very few bars are near the extreme limits.
Code:
#chat135_momentum_trend

#https://usethinkscript.com/threads/chatgpt-bard-other-ai-scripts-which-cant-be-used-in-thinkorswim.13822/page-7#post-127783
#fluna  #135
#I can't get the momentum histogram to show at the same time as the Trend line.


# Trend Momentum Indicator (TMI) for Thinkorswim
# Developed by Fluna
Declare Lower;

def bn = barnumber();

# Input parameters
input trendLength = 14;
input momentumLength = 12;
input volatilityLength = 20;
input momentumThreshold = 0.5;
input volatilityThreshold = 1.0;

# Calculate trend direction
def trend = if close > MovingAverage(AverageType.EXPONENTIAL, close, trendLength) then 1 else -1;

# Calculate momentum
#def momentum = (close - close[momentumLength]) / close[momentumLength];
def momentum2 = (close - close[momentumLength]) / close[momentumLength];

# create a scale factor on bar #1 , to fit the histo to  1 to -1
def scale = if bn == 1 then 1/highestall(absvalue(momentum2)) else scale[1];

#create a factor, so histo extends to 1.1 to -1.1
input fudge = 1.1;
def momentum = momentum2 * scale * fudge;

# Calculate volatility
def volatility = AbsValue(Log(high / low));

# Plot trend line
plot trendLine = trend;
trendLine.SetDefaultColor(Color.CYAN);

# Plot momentum histogram
plot momentumHistogram = momentum;
momentumHistogram.AssignValueColor(if momentum >= momentumThreshold then Color.GREEN else Color.RED);
momentumHistogram.SetPaintingStrategy(PaintingStrategy.HISTOGRAM);
momentumHistogram.SetLineWeight(2);

# Plot volatility line
plot volatilityLine = volatility;
volatilityLine.SetDefaultColor(Color.BLUE);
volatilityLine.SetStyle(Curve.SHORT_DASH);

# Add alerts
alert(trendLine crosses above 0, "Bullish Trend", Alert.BAR, Sound.Bell);
alert(trendLine crosses below 0, "Bearish Trend", Alert.BAR, Sound.Bell);
alert(momentumHistogram crosses above momentumThreshold, "Strong Momentum Up", Alert.BAR, Sound.Chimes);
alert(momentumHistogram crosses below -momentumThreshold, "Strong Momentum Down", Alert.BAR, Sound.Chimes);
alert(volatilityLine crosses above volatilityThreshold, "High Volatility", Alert.BAR, Sound.Ring);
alert(volatilityLine crosses below volatilityThreshold, "Low Volatility", Alert.BAR, Sound.Ring);
#
can one help please. this code from chat has error:
# Define input parameters
input underlyingSymbol = "SPX";
input volatility = imp_volatility(underlyingSymbol);
# Get option data
def optionChain = OptionChain(underlyingSymbol, GetYYYYMMDD());
def strikeCount = optionChain.GetStrikeCount();
def closePrice = close(underlyingSymbol);
no, i don't think anyone can help you.
posting just 'help please' tells us nothing.
there are too many problems with this and you didn't explain what it is supposed to do.
you told chatgpt something to make this code? then edit your post and add it.
PLEASE HELP ME
Not sure if it's possible but, I need script so my watchlist will display EXACT LAST TRADED PRICE for stocks in afterhours session. Not Last closing price, not BID or ASK, no MARK price which is very misleading, but Last price of the stack value traded last - not always but should be betwen of BID ans ASK range.
I was able to find one for displaying EXACT LAST price on Chart, but I must have one in watchlist somehow. Is it anyone that can HELP?? Please.
P.S. This script for displaying last price on chart - but I need one in watchlist >
# After Hours Last Price
# Displays the exact last price of a stock during aftermarket trading session
declare lower;
# Define the aggregation period (e.g., 1 minute, 5 minutes, etc.)
input aggregationPeriod = AggregationPeriod.MIN;
# Calculate the aftermarket last price
def lastPrice = close(period = aggregationPeriod);
plot AfterHoursLastPrice = lastPrice;
# Customize the appearance of the plot
AfterHoursLastPrice.SetDefaultColor(color.white);
AfterHoursLastPrice.SetStyle(Curve.SHORT_DASH);
All are plotting, the issue comes down to the mathematical results. Since your trend line will always be +1 or -1, the small values for your histogram and vol line results are much smaller values (.0011975 and .0044909, respectively, for 7/5/23) relative to the +/-1, so they're barely blips on the graph. Multiply the results of these by 10 or 100 to shift the decimal over and you'll now have results that will better show visual change in values against your +/-1 range.
this has a scale factor, that auto adjusts the histogram, so it will always be at full scale of line plot, 1 to -1.
added a secondary factor (fudge , 1.1 ) to scale it to , 1.1 to -1.1. because very few bars are near the extreme limits.
Code:
#chat135_momentum_trend

#https://usethinkscript.com/threads/chatgpt-bard-other-ai-scripts-which-cant-be-used-in-thinkorswim.13822/page-7#post-127783
#fluna  #135
#I can't get the momentum histogram to show at the same time as the Trend line.


# Trend Momentum Indicator (TMI) for Thinkorswim
# Developed by Fluna
Declare Lower;

def bn = barnumber();

# Input parameters
input trendLength = 14;
input momentumLength = 12;
input volatilityLength = 20;
input momentumThreshold = 0.5;
input volatilityThreshold = 1.0;

# Calculate trend direction
def trend = if close > MovingAverage(AverageType.EXPONENTIAL, close, trendLength) then 1 else -1;

# Calculate momentum
#def momentum = (close - close[momentumLength]) / close[momentumLength];
def momentum2 = (close - close[momentumLength]) / close[momentumLength];

# create a scale factor on bar #1 , to fit the histo to  1 to -1
def scale = if bn == 1 then 1/highestall(absvalue(momentum2)) else scale[1];

#create a factor, so histo extends to 1.1 to -1.1
input fudge = 1.1;
def momentum = momentum2 * scale * fudge;

# Calculate volatility
def volatility = AbsValue(Log(high / low));

# Plot trend line
plot trendLine = trend;
trendLine.SetDefaultColor(Color.CYAN);

# Plot momentum histogram
plot momentumHistogram = momentum;
momentumHistogram.AssignValueColor(if momentum >= momentumThreshold then Color.GREEN else Color.RED);
momentumHistogram.SetPaintingStrategy(PaintingStrategy.HISTOGRAM);
momentumHistogram.SetLineWeight(2);

# Plot volatility line
plot volatilityLine = volatility;
volatilityLine.SetDefaultColor(Color.BLUE);
volatilityLine.SetStyle(Curve.SHORT_DASH);

# Add alerts
alert(trendLine crosses above 0, "Bullish Trend", Alert.BAR, Sound.Bell);
alert(trendLine crosses below 0, "Bearish Trend", Alert.BAR, Sound.Bell);
alert(momentumHistogram crosses above momentumThreshold, "Strong Momentum Up", Alert.BAR, Sound.Chimes);
alert(momentumHistogram crosses below -momentumThreshold, "Strong Momentum Down", Alert.BAR, Sound.Chimes);
alert(volatilityLine crosses above volatilityThreshold, "High Volatility", Alert.BAR, Sound.Ring);
alert(volatilityLine crosses below volatilityThreshold, "Low Volatility", Alert.BAR, Sound.Ring);
#
reply to #115
fairvaluegap is a made up word. it has no meaning. if you want a study to do something try listing out the rules that it should follow.
when close crosses this signal, do this.
if close is > 2 signals do this....
what is wrong with the code you posted?
what do you think needs to be changed?
i don't know what fairvaluegap is and i'm not going to go searching for definitions of it and guess i found the correct one. that is the job of the poster, you, to provide all the info you can, so that a stranger, not familiar with your request, can help.
you didn't tell us what 2 studies you looked at. what was wrong with them? why not use them?
you can get a link to a post, by clicking on the post number, then copy the web address.
useThinkScript is the #1 community of stock market investors using indicators and other tools to power their trading strategies. Traders of all skill levels use our forums to learn about scripting and indicators, help each other, and discover new ways to gain an edge in the markets.
How do I get started?
We get it. Our forum can be intimidating, if not overwhelming. With thousands of topics, tens of thousands of posts, our community has created an incredibly deep knowledge base for stock traders. No one can ever exhaust every resource provided on our site.
If you are new, or just looking for guidance, here are some helpful links to get you started.
VIP members get exclusive access to these proven and tested premium indicators: Buy the Dip, Advanced Market Moves 2.0, Take Profit, and Volatility Trading Range. In addition, VIP members get access to over 50 VIP-only custom indicators, add-ons, and strategies, private VIP-only forums, private Discord channel to discuss trades and strategies in real-time, customer support, trade alerts, and much more. Learn all about VIP membership here.
How can I access the premium indicators?
To access the premium indicators, which are plug and play ready, sign up for VIP membership here.