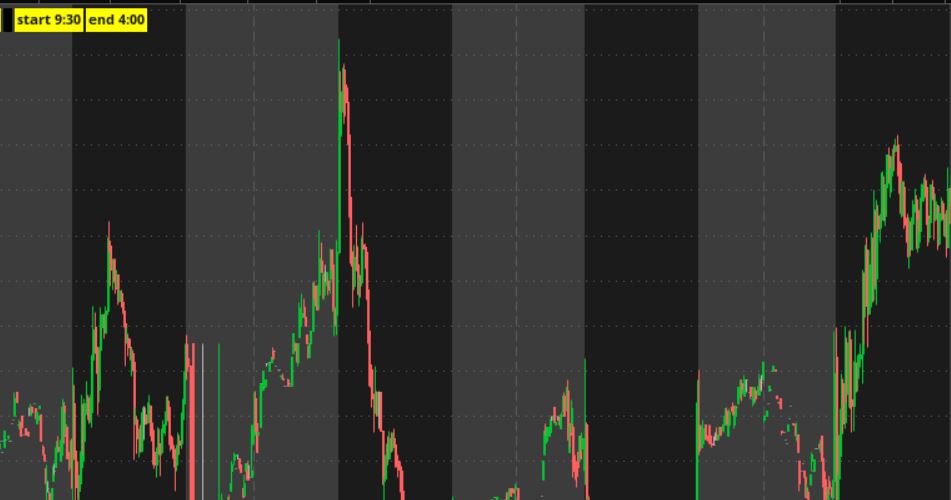
unusual option volume with buy and sell strategy
Can someone help me refine the code where i can use it for mobile. My idea is that when there is massive options buying either call or put the premium of either one is overbought or oversold. next two days they will sell or buy. so i combine with the option volume scanner plus B4 indicator and RS percentile.
code: Buying
#```thinkscript
# Define the time period for the scan
input scanPeriod = 30; # Number of trading days to consider
# Calculate the average daily option volume
def avgOptionVolume = Average(volume(period = AggregationPeriod.DAY), scanPeriod);
# Calculate the average daily call option volume
def avgCallVolume = Average(volume(period = AggregationPeriod.DAY) * (close > open), scanPeriod);
# Calculate the average daily put option volume
def avgPutVolume = Average(volume(period = AggregationPeriod.DAY) * (close < open), scanPeriod);
# Calculate the current day's call option volume
def currentCallVolume = volume * (close > open);
# Calculate the current day's put option volume
def currentPutVolume = volume * (close < open);
# Calculate the ratio of current call option volume to average call option volume
def callVolumeRatio = currentCallVolume / avgCallVolume;
# Calculate the ratio of current put option volume to average put option volume
def putVolumeRatio = currentPutVolume / avgPutVolume;
# Define the threshold for unusual option buying activity
input threshold = 2.0;
# Scan for stocks with unusual call option buying activity
def unusualCallBuying = callVolumeRatio >= threshold;
# Scan for stocks with unusual put option buying activity
def unusualPutBuying = putVolumeRatio >= threshold;
# Combine the scan conditions to find stocks with either unusual call or put option buying activity
#def unusualOptionBuying = unusualCallBuying or unusualPutBuying;
def unusualOptionBuying = unusualputBuying;
# Plot the scan results on the scan tab
#plot scanResults = unusualOptionBuying;
#______________________________
#rsspx
# RSpercentile
#-------------------- Header End ----------------------------
input OverBought = 95;
input OverSold = 10;
input Middle = 50;
input length = 7;
#def RS = if IsNan(relativeStrength("SPX")) then 0 else relativeStrength("SPX") ;
def RS = RelativeStrength("SPX");
def RSLow = Lowest(RS, length);
def RSHigh = Highest(RS, length);
def RSRank = 100 * (RS - RSLow) / (RSHigh - RSLow);
def RSRank_ = RSRank;
def rsrankall = rsrank_;
#AddLabel (yes, if RSRank >= 1 and RSRank < 100 then "000" + astext(RSRank) else astext( RSRank) );
def overbought_ = overbought;
def middle_ = middle;
def oversold_ = oversold;
#cluster
def cluster=if RSrankall >overbought then 100 else if rsrankall<oversold then 10 else double.nan;
##________________
# B4 Signal
#
# Free for use for non commercial. Header credits must be included when any form of the code included in this package is used.
# User assumes all risk. Author not responsible for errors or use of tool.
# Copyright (c) 2021 B4 Signals
#
# Get support at:
https://b4signals.com
# Join us at:
https://discord.gg/kD3pKE2CQd
#
#
# v3.0 - barbros / chuck - official release
### MACDBB
input MACDBB_FastLength = 12;
input MACDBB_SlowLength = 26;
input MACDBB_BandLength = 15;
input MACDBB_NumDev = 1.0;
def MACDBB_Data = MACD(fastLength = MACDBB_FastLength, slowLength = MACDBB_SlowLength, MACDLength = 5);
def MACDBB_Upper = reference BollingerBands(price = MACDBB_Data, length = MACDBB_BandLength,
Num_Dev_Dn = -MACDBB_NumDev, Num_Dev_Up = MACDBB_NumDev).UpperBand;;
def MACDBB_Lower = reference BollingerBands(price = MACDBB_Data, length = MACDBB_BandLength,
Num_Dev_Dn = -MACDBB_NumDev, Num_Dev_Up = MACDBB_NumDev).Lowerband;
def MACDBB_Buy = MACDBB_Data > MACDBB_Upper;
def MACDBB_Sell = MACDBB_Data <= MACDBB_Lower;
### RSI/STOCASTIC/MACD CONFLUENCE COMBO
def RSM_MACD_Diff = reference MACD(fastLength = 12, slowLength = 26, MACDLength = 9).Diff;
def RSM_MACD_ZeroLine = 0;
def RSM_RSI = reference RSI(length = 7).RSI;
def RSM_Stoch_Val = 100 * (close - lowest(low, 14)) / (highest(high, 14) - lowest(low, 14));
def RSM_StochSlowK = SimpleMovingAvg(SimpleMovingAvg(RSM_Stoch_Val,3),3);
def RSM_rsiGreen = RSM_RSI >= 50;
def RSM_rsiRed = RSM_RSI < 50;
def RSM_stochGreen = RSM_StochSlowK >= 50;
def RSM_stochRed = RSM_StochSlowK < 50;
def RSM_macdGreen = RSM_MACD_Diff >= 0;
def RSM_macdRed = RSM_MACD_Diff < 0;
def RSM_Buy = RSM_rsiGreen and RSM_stochGreen and RSM_macdGreen;
def RSM_Sell = RSM_rsiRed and RSM_stochRed and RSM_macdRed;
### RSI IFT
def RSI_IFT_R = reference RSI(5, close) - 50;
def RSI_IFT_AvgRSI = MovingAverage(AverageType.Exponential,RSI_IFT_R,9);
def RSI_IFT_InverseRSI = (Power(Double.E, 2 * RSI_IFT_AvgRSI) - 1) / (Power(Double.E, 2 * RSI_IFT_AvgRSI) + 1);
def RSI_IFT_Direction = if BarNumber() == 0 then 0
else if (RSI_IFT_InverseRSI[1] > 0) and (RSI_IFT_InverseRSI < 0) then -1
else if (RSI_IFT_InverseRSI > 0) and (RSI_IFT_InverseRSI[1] < 0) then 1
else RSI_IFT_Direction[1];
### Fibonacci SuperTrend
input FST_Length = 11;
input FST_Retrace = 23.6;
input FST_UseHighLow = yes;
def FST_h = if FST_UseHighLow then high else close;
def FST_l = if FST_UseHighLow then low else close;
def FST_minL = Lowest(FST_l, FST_Length);
def FST_maxH = Highest(FST_h, FST_Length);
def FST_hh = if FST_h > FST_maxH[1] then FST_h else FST_hh[1];
def FST_ll = if FST_l < FST_minL[1] then FST_l else FST_ll[1];
def FST_trend = if FST_h > FST_maxH[1] then 1 else if FST_l < FST_minL[1] then -1 else FST_trend[1];
def FST_Direction = if BarNumber() == 0 then 0
else if FST_trend != 1 then -1
else if FST_trend == 1 then 1
else FST_Direction[1];
### Strategy
input BullBear_Include_FST = yes; #hint BullBear_Include_FST: Include Fibonacci SuperTrend in the vertical line strategy
input BullBear_Include_RSI_IFT = yes; #hint BullBear_Include_RSI_IFT: Include RSI IFT in the vertical line strategy
def BullBear_Buy = (!BullBear_Include_FST or FST_Direction == 1) and
(!BullBear_Include_RSI_IFT or RSI_IFT_Direction == 1);
def BullBear_Sell = (!BullBear_Include_FST or FST_Direction == -1) and
(!BullBear_Include_RSI_IFT or RSI_IFT_Direction == -1);
def Strategy_Buy = BullBear_Buy and MACDBB_Buy and RSM_Buy;
def Strategy_Sell = BullBear_Sell and MACDBB_Sell and RSM_Sell;
plot scanResults = unusualOptionBuying && strategy_sell && cluster ;
# Customize the appearance of the scan results plot
scanResults.SetPaintingStrategy(PaintingStrategy.BOOLEAN_ARROW_up);
scanResults.SetLineWeight(3);
scanResults.SetDefaultColor(Color.green);
scanResults.HideBubble();
code : Selling
#```thinkscript
# Define the time period for the scan
input scanPeriod = 30; # Number of trading days to consider
# Calculate the average daily option volume
def avgOptionVolume = Average(volume(period = AggregationPeriod.DAY), scanPeriod);
# Calculate the average daily call option volume
def avgCallVolume = Average(volume(period = AggregationPeriod.DAY) * (close > open), scanPeriod);
# Calculate the average daily put option volume
def avgPutVolume = Average(volume(period = AggregationPeriod.DAY) * (close < open), scanPeriod);
# Calculate the current day's call option volume
def currentCallVolume = volume * (close > open);
# Calculate the current day's put option volume
def currentPutVolume = volume * (close < open);
# Calculate the ratio of current call option volume to average call option volume
def callVolumeRatio = currentCallVolume / avgCallVolume;
# Calculate the ratio of current put option volume to average put option volume
def putVolumeRatio = currentPutVolume / avgPutVolume;
# Define the threshold for unusual option buying activity
input threshold = 2.0;
# Scan for stocks with unusual call option buying activity
def unusualCallBuying = callVolumeRatio >= threshold;
# Scan for stocks with unusual put option buying activity
def unusualPutBuying = putVolumeRatio >= threshold;
# Combine the scan conditions to find stocks with either unusual call or put option buying activity
#def unusualOptionBuying = unusualCallBuying or unusualPutBuying;
def unusualOptionBuying = unusualcallBuying;
# Plot the scan results on the scan tab
#plot scanResults = unusualOptionBuying;
# RSpercentile
input OverBought = 95;
input OverSold = 10;
input Middle = 50;
input length = 7;
#def RS = if IsNan(relativeStrength("SPX")) then 0 else relativeStrength("SPX") ;
def RS = RelativeStrength("SPX");
def RSLow = Lowest(RS, length);
def RSHigh = Highest(RS, length);
def RSRank = 100 * (RS - RSLow) / (RSHigh - RSLow);
def RSRank_ = RSRank;
def rsrankall = rsrank_;
#AddLabel (yes, if RSRank >= 1 and RSRank < 100 then "000" + astext(RSRank) else astext( RSRank) );
def overbought_ = overbought;
def middle_ = middle;
def oversold_ = oversold;
#cluster
def cluster=if RSrankall >overbought then 100 else if rsrankall<oversold then 10 else double.nan;
### MACDBB
input MACDBB_FastLength = 12;
input MACDBB_SlowLength = 26;
input MACDBB_BandLength = 15;
input MACDBB_NumDev = 1.0;
def MACDBB_Data = MACD(fastLength = MACDBB_FastLength, slowLength = MACDBB_SlowLength, MACDLength = 5);
def MACDBB_Upper = reference BollingerBands(price = MACDBB_Data, length = MACDBB_BandLength,
Num_Dev_Dn = -MACDBB_NumDev, Num_Dev_Up = MACDBB_NumDev).UpperBand;;
def MACDBB_Lower = reference BollingerBands(price = MACDBB_Data, length = MACDBB_BandLength,
Num_Dev_Dn = -MACDBB_NumDev, Num_Dev_Up = MACDBB_NumDev).Lowerband;
def MACDBB_Buy = MACDBB_Data > MACDBB_Upper;
def MACDBB_Sell = MACDBB_Data <= MACDBB_Lower;
### RSI/STOCASTIC/MACD CONFLUENCE COMBO
def RSM_MACD_Diff = reference MACD(fastLength = 12, slowLength = 26, MACDLength = 9).Diff;
def RSM_MACD_ZeroLine = 0;
def RSM_RSI = reference RSI(length = 7).RSI;
def RSM_Stoch_Val = 100 * (close - lowest(low, 14)) / (highest(high, 14) - lowest(low, 14));
def RSM_StochSlowK = SimpleMovingAvg(SimpleMovingAvg(RSM_Stoch_Val,3),3);
def RSM_rsiGreen = RSM_RSI >= 50;
def RSM_rsiRed = RSM_RSI < 50;
def RSM_stochGreen = RSM_StochSlowK >= 50;
def RSM_stochRed = RSM_StochSlowK < 50;
def RSM_macdGreen = RSM_MACD_Diff >= 0;
def RSM_macdRed = RSM_MACD_Diff < 0;
def RSM_Buy = RSM_rsiGreen and RSM_stochGreen and RSM_macdGreen;
def RSM_Sell = RSM_rsiRed and RSM_stochRed and RSM_macdRed;
### RSI IFT
def RSI_IFT_R = reference RSI(5, close) - 50;
def RSI_IFT_AvgRSI = MovingAverage(AverageType.Exponential,RSI_IFT_R,9);
def RSI_IFT_InverseRSI = (Power(Double.E, 2 * RSI_IFT_AvgRSI) - 1) / (Power(Double.E, 2 * RSI_IFT_AvgRSI) + 1);
def RSI_IFT_Direction = if BarNumber() == 0 then 0
else if (RSI_IFT_InverseRSI[1] > 0) and (RSI_IFT_InverseRSI < 0) then -1
else if (RSI_IFT_InverseRSI > 0) and (RSI_IFT_InverseRSI[1] < 0) then 1
else RSI_IFT_Direction[1];
### Fibonacci SuperTrend
input FST_Length = 11;
input FST_Retrace = 23.6;
input FST_UseHighLow = yes;
def FST_h = if FST_UseHighLow then high else close;
def FST_l = if FST_UseHighLow then low else close;
def FST_minL = Lowest(FST_l, FST_Length);
def FST_maxH = Highest(FST_h, FST_Length);
def FST_hh = if FST_h > FST_maxH[1] then FST_h else FST_hh[1];
def FST_ll = if FST_l < FST_minL[1] then FST_l else FST_ll[1];
def FST_trend = if FST_h > FST_maxH[1] then 1 else if FST_l < FST_minL[1] then -1 else FST_trend[1];
def FST_Direction = if BarNumber() == 0 then 0
else if FST_trend != 1 then -1
else if FST_trend == 1 then 1
else FST_Direction[1];
### Strategy
input BullBear_Include_FST = yes; #hint BullBear_Include_FST: Include Fibonacci SuperTrend in the vertical line strategy
input BullBear_Include_RSI_IFT = yes; #hint BullBear_Include_RSI_IFT: Include RSI IFT in the vertical line strategy
def BullBear_Buy = (!BullBear_Include_FST or FST_Direction == 1) and
(!BullBear_Include_RSI_IFT or RSI_IFT_Direction == 1);
def BullBear_Sell = (!BullBear_Include_FST or FST_Direction == -1) and
(!BullBear_Include_RSI_IFT or RSI_IFT_Direction == -1);
def Strategy_Buy = BullBear_Buy and MACDBB_Buy and RSM_Buy;
def Strategy_Sell = BullBear_Sell and MACDBB_Sell and RSM_Sell;
plot scanResults = unusualOptionBuying && strategy_BUY && cluster ;
# Customize the appearance of the scan results plot
scanResults.SetPaintingStrategy(PaintingStrategy.BOOLEAN_ARROW_down);
scanResults.SetLineWeight(3);
scanResults.SetDefaultColor(Color.red);
scanResults.HideBubble();
this codes itself can be use with thinkorswim platform but i can not use it on mobile and i would like to use it on Mobile app.
using this code alone "
# Define the time period for the scan
input scanPeriod = 30; # Number of trading days to consider
# Calculate the average daily option volume
def avgOptionVolume = Average(volume(period = AggregationPeriod.DAY), scanPeriod);
# Calculate the average daily call option volume
def avgCallVolume = Average(volume(period = AggregationPeriod.DAY) * (close > open), scanPeriod);
# Calculate the average daily put option volume
def avgPutVolume = Average(volume(period = AggregationPeriod.DAY) * (close < open), scanPeriod);
# Calculate the current day's call option volume
def currentCallVolume = volume * (close > open);
# Calculate the current day's put option volume
def currentPutVolume = volume * (close < open);
# Calculate the ratio of current call option volume to average call option volume
def callVolumeRatio = currentCallVolume / avgCallVolume;
# Calculate the ratio of current put option volume to average put option volume
def putVolumeRatio = currentPutVolume / avgPutVolume;
# Define the threshold for unusual option buying activity
input threshold = 2.0;
# Scan for stocks with unusual call option buying activity
def unusualCallBuying = callVolumeRatio >= threshold;
# Scan for stocks with unusual put option buying activity
def unusualPutBuying = putVolumeRatio >= threshold;
# Combine the scan conditions to find stocks with either unusual call or put option buying activity
#def unusualOptionBuying = unusualCallBuying or unusualPutBuying;
def unusualOptionBuying = unusualputBuying;
# Plot the scan results on the scan tab
#plot scanResults = unusualOptionBuying;"""""
will work on mobile but i want the combine strategy combine and it gives me the arrow. can someone help. thanks


