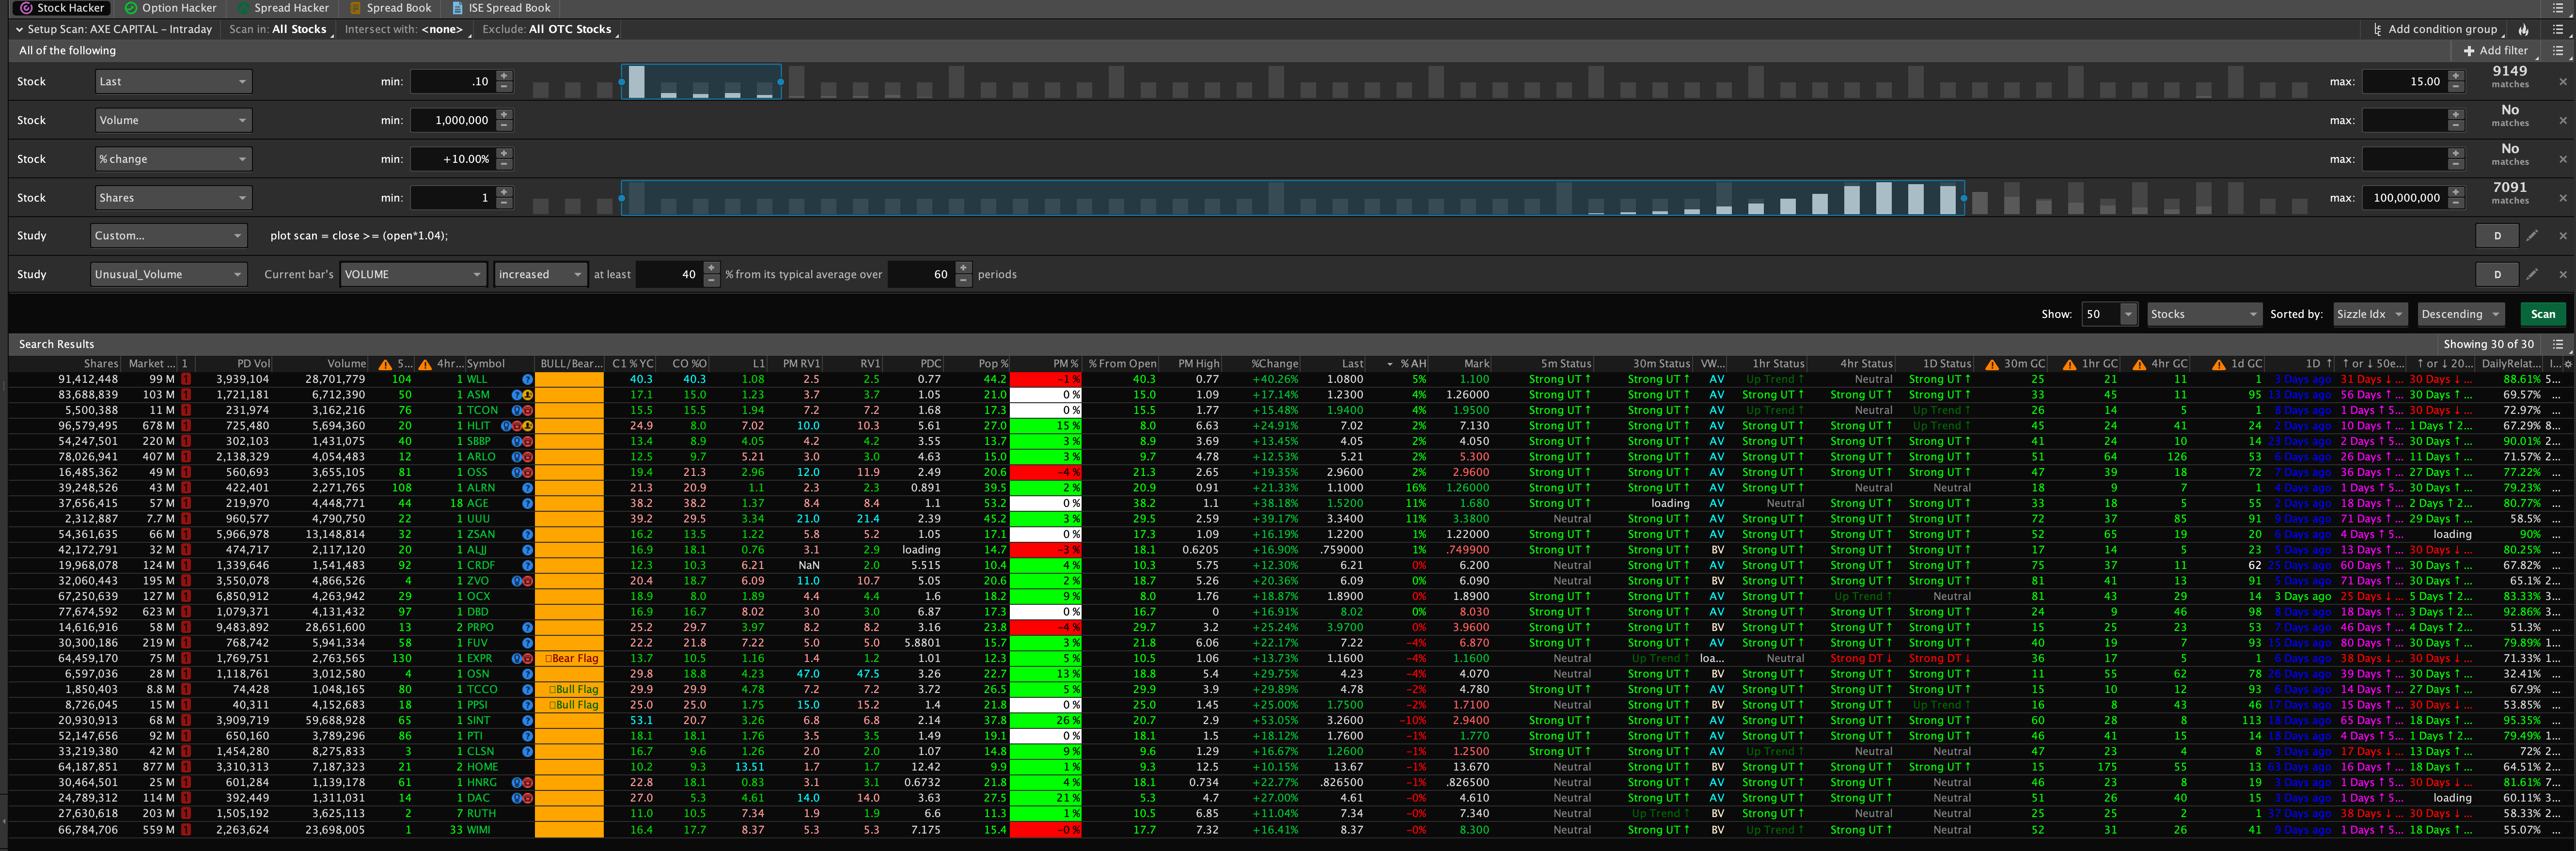
Bull Flag and Bear Flag Formations for ThinkorSwim

I have the code in my laptop and my desk top. The laptop does not paint the bars blue, whereas the desktop paints them. Why does it paint the bars blue. Arrows show on both machines though
@stamenski Try two things - check your appearance settings for the pricebar color, and/or check if you have any study loaded on the chart that changes the pricebar color. The codes in post #1 do not change the color of your bars.
 
Can this indicator be added to the chart?
@stormy77 yes, the indicator script is included in the thread. It has an arrow that indicates Bull/Bear Flag completion. I have mine just to show Bullish arrows (YELLOW). I've added an alert, which I prefer. Add the following lines if you've like at the end of the script.

Alert(bearish, Round(close, 2) + " Bearish Flag", Alert.BAR);
Alert(bullish, Round(close, 2) + " Bullish Flag", Alert.BAR);
 
Last edited by a moderator:
Old man needs help !!! I use TOS and I have a watchlist with 25 etf's and or stocks. I would like for someone to write a ThinkScript to run in a sub graph to show how many are up on the day based on the time frame I chose "5min, 30min or what ever" !!! If it requires 25 inputs that is OK or if it looks at a watchlist is OK. Will not have to count during the day !!!
 
Last edited by a moderator:
Regarding the code on the main page of this thread, I'm finding the signal on the chart does not exactly correlate to the thumbs up signal in the watchlist column. The watchlist will show a thumbs up even if the arrow up on the chart came 5-10 bars ago, even on a daily.
Would be great if this can be fixed to only show the thumbs up signal (in the watchlist) if the chart signal is within one or two bars.
Otherwise I'm finding this is almost useless as a watchlist column.
 
@Hybety Great Catch! Chart script is now fixed. Copy&Paste the new code for the upper study in post#1
It now matches the WatchList code.
Screenshot (87).png

Screenshot (88).png
 
@Hybety Ken Rose provided the update to the watchlist to weed out false signals by adding a moving average filter.
If you like the previous version better, find the below statements in the study and in the watchlist and remove the struck-through words.
def Bulltrigger = trend and MacdLow and trigATR and PriceSma ;
def BearTrigger = TrendBear and MacdHighBear and BtrigATR and BPriceSma ;
 
Still not working ughh.. here is a screenshot see how it shows orange bars and only 2/3 have bearflag /bull i added that because the thumbs arent working..

--- UPDATE FROM KEN --- it doesn't work on MAC apples he said.

MT8zFXR.png


If you click on the 3 bar icon at the top and click share scan can you send me the link cuz maybe that will work for me.
Anyone know how to make this work for a MAC? When adding:

AddLabel(yes, if Bulltrigger then "👍" else if BearTrigger then "👎" else " ", if BearTrigger then Color.dark_red else if Bulltrigger then Color.dark_GREEN else Color.ORANGE);
AssignBackgroundColor(color.light_ORANGE);

I get an error message: AddLabel is not allowed in this context

Not sure how to fix this. Does anyone know?

TIA
 
@Galbs There is no work-around.
The author of the script works for TDAmeritrade. If Ken says it won't work on Macs. It's the truth.
 
Last edited:
I've had this script for years,...and began to explore it's code.
# __ Bull flag indicator for Thinkorswim by Steve from thestudentloanranger.wordpress.com


# Input and basic definitions

input pChg = 1.50; # Daily minimum percent increase during expansion phase (def=1.50)

def C = close;
def O = open;
def H = high;
def L = low;
def V = volume;


# isHigh is to stop a plotting issue inertia code, don't touch it!
def isHigh = C > 20000;


# Expansion range price and volume
def XRANGE = C[3] - O[5];
def XRANGEH = H[3] - O[5];
def XVOL = V[5] + V[4] + V[3];


# Define average true ranges and amount above
def atr = Average(TrueRange(high, C, low), 1.0);
def EXPANDER = atr > (Average(atr) * 1.10);
def EXPNDR = if EXPANDER[5] && EXPANDER[4] && EXPANDER[3] then 1 else 0;


# Percentage change characteristics
def PercentChg = Round(100 * (C / C[1] - 1), 3);
def PCCOUNT = if (PercentChg[5] > pChg && PercentChg[4] > pChg && PercentChg[3] > pChg)
or Round(100 * (C[3] / C[5] - 1), 3) > 10.0 then 1 else 0;


# Higher than average V characteristics
def Volavg = if (V[5] + V[4] + V[3]) / 3 > Average(V) * 1.10 then 1 else 0;


# Price action characteristics
def CandleAction = (C[5] > O[5] && C[4] > O[4] && C[3] > O[3]);
def Signal = if EXPNDR == 1 && Volavg == 1 && CandleAction && PCCOUNT then 1 else 0;


# 3-day consolidation settings

def CRANGE = Highest(H, 3) - Lowest(L, 3);
def UPDRIFT = Highest(H, 3) < (H[3] + (XRANGEH * 0.25));
def CONVOL = V[0] + V[1] + V[2];


# Ratio calculations

def XCRATIO = XRANGE / CRANGE;
def XVRATIO = XVOL / CONVOL;


# Confirmations and plot formatting

plot BULL = if XCRATIO > 2 && XVRATIO > 1.20 && UPDRIFT && Signal == 1 then 1 else 0;
BULL.SetPaintingStrategy(PaintingStrategy.BOOLEAN_ARROW_UP);
BULL.SetDefaultColor(Color.LIME);
BULL.SetLineWeight(2);
AssignPriceColor(if BULL then Color.BLUE else Color.CURRENT);

plot STPPRICE = If(BULL and C > 0, (C[3] - (XRANGE * 0.40)), If(C < 0 and !BULL , (C[0] + (XRANGE * 0.95)), Double.NaN));
STPPRICE.SetPaintingStrategy(PaintingStrategy.HORIZONTAL);
STPPRICE.SetDefaultColor(Color.RED);
STPPRICE.SetLineWeight(2);

plot TGTPRICE = If(BULL and C > 0, (C[0] + (XRANGE * 0.90)), If(C < 0 and !BULL , (C[0] - (XRANGE * 0.40)), Double.NaN));
TGTPRICE.SetPaintingStrategy(PaintingStrategy.HORIZONTAL);
TGTPRICE.SetDefaultColor(Color.GREEN);
TGTPRICE.SetLineWeight(2);
 
This is a scan share to the BullFlag,...... https://tos.mx/BjHoijL

⚠ edited by moderator. Shared media blocked.
**Images, Videos, Media content from commercial websites can NOT be shared on this forum. The Internet is not in and of itself public domain. Most commercial material is protected by copyright.
You can edit your post and provide a link to a commercial website but you can't share their images.
 
Last edited by a moderator:
This is a scan share to the BullFlag,...... https://tos.mx/BjHoijL

⚠ edited by moderator. Shared media blocked.
**Images, Videos, Media content from commercial websites can NOT be shared on this forum. The Internet is not in and of itself public domain. Most commercial material is protected by copyright.
You can edit your post and provide a link to a commercial website but you can't share their images.
the above scan does not return anything,

Does it work for you ?
 
Yes, that is the reason the post to play with it. After lunch was a suggestion to run the scan.....so
play as the pattern is perfect flag....things just need to workout in the market.
 
Yes, that is the reason the post to play with it. After lunch was a suggestion to run the scan.....so
play as the pattern is perfect flag....things just need to workout in the market.
Best flags I've seen yet Thomas. This is the one I'll be using.

The way I use it is to combine day, week, and month into one scan.

Cheers and thank you!
 

Join useThinkScript to post your question to a community of 21,000+ developers and traders.

Similar threads

Not the exact question you're looking for?

Start a new thread and receive assistance from our community.

87k+ Posts
473 Online
Create Post

Similar threads

Similar threads

The Market Trading Game Changer

Join 2,500+ subscribers inside the useThinkScript VIP Membership Club
  • Exclusive indicators
  • Proven strategies & setups
  • Private Discord community
  • ‘Buy The Dip’ signal alerts
  • Exclusive members-only content
  • Add-ons and resources
  • 1 full year of unlimited support

Frequently Asked Questions

What is useThinkScript?

useThinkScript is the #1 community of stock market investors using indicators and other tools to power their trading strategies. Traders of all skill levels use our forums to learn about scripting and indicators, help each other, and discover new ways to gain an edge in the markets.

How do I get started?

We get it. Our forum can be intimidating, if not overwhelming. With thousands of topics, tens of thousands of posts, our community has created an incredibly deep knowledge base for stock traders. No one can ever exhaust every resource provided on our site.

If you are new, or just looking for guidance, here are some helpful links to get you started.

What are the benefits of VIP Membership?
VIP members get exclusive access to these proven and tested premium indicators: Buy the Dip, Advanced Market Moves 2.0, Take Profit, and Volatility Trading Range. In addition, VIP members get access to over 50 VIP-only custom indicators, add-ons, and strategies, private VIP-only forums, private Discord channel to discuss trades and strategies in real-time, customer support, trade alerts, and much more. Learn all about VIP membership here.
How can I access the premium indicators?
To access the premium indicators, which are plug and play ready, sign up for VIP membership here.
Back
Top