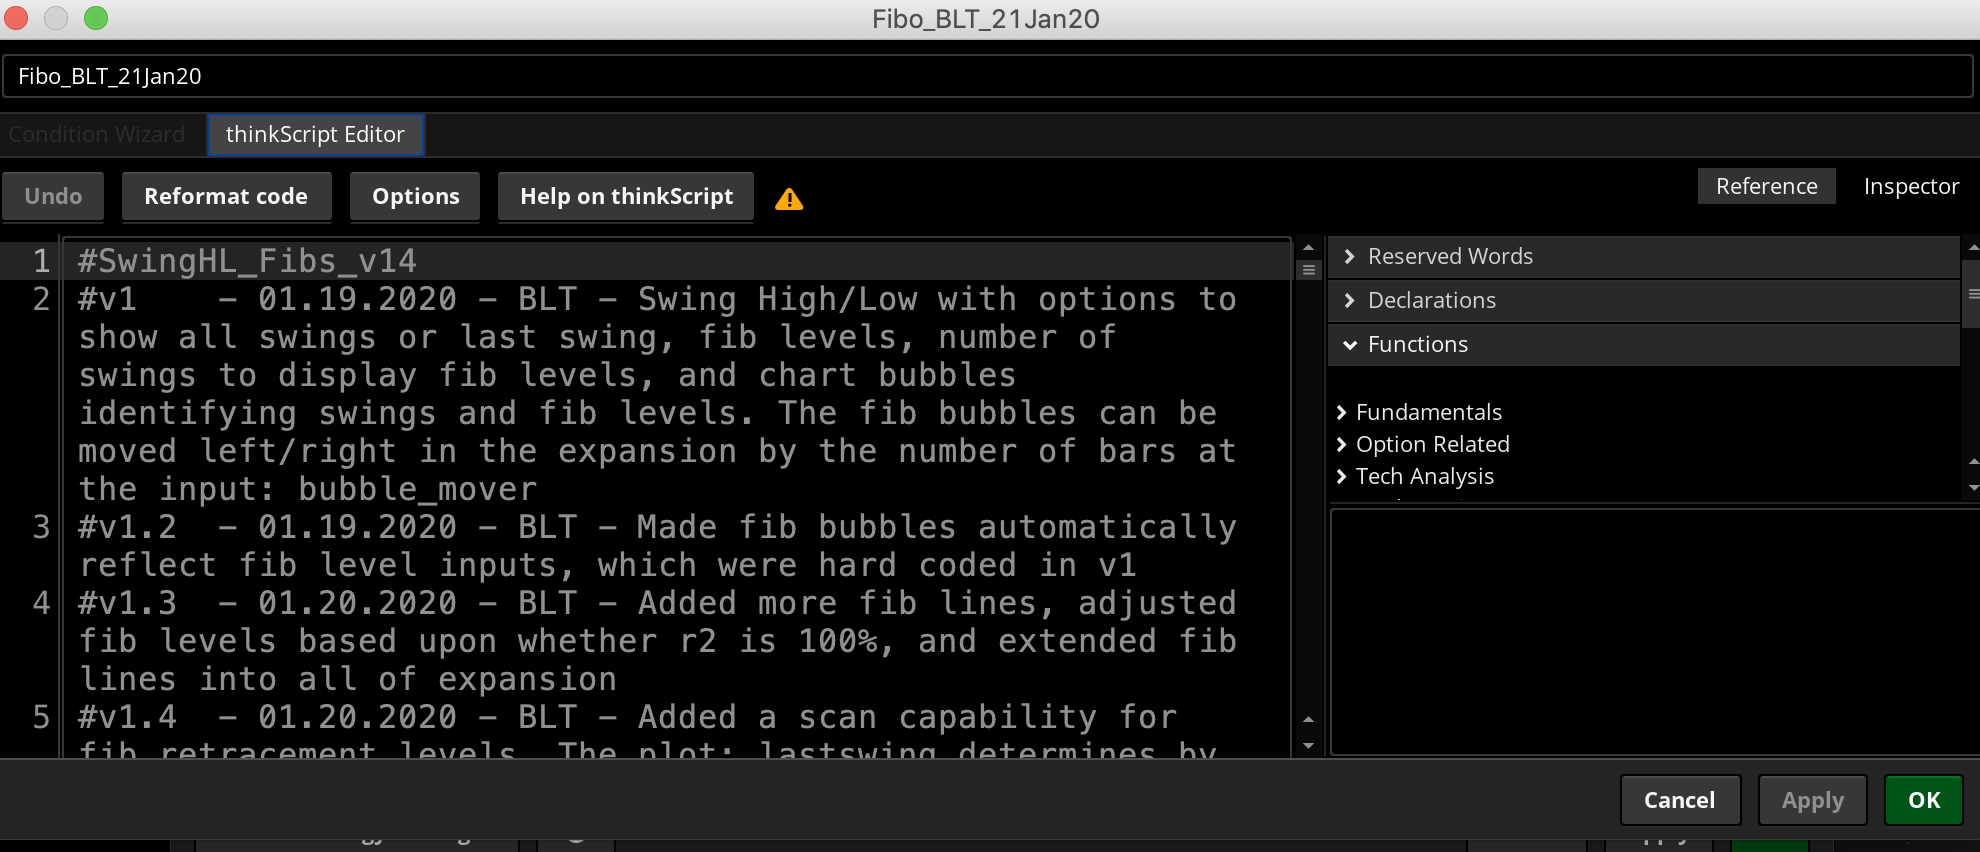
#SwingHL_Fibs_v15
#v1 - 01.19.2020 - BLT - Swing High/Low with options to show all swings or last swing, fib levels, number of swings to display fib levels, and chart bubbles identifying swings and fib levels. The fib bubbles can be moved left/right in the expansion by the number of bars at the input: bubble_mover
#v1.2 - 01.19.2020 - BLT - Made fib bubbles automatically reflect fib level inputs, which were hard coded in v1
#v1.3 - 01.20.2020 - BLT - Added more fib lines, adjusted fib levels based upon whether r2 is 100%, and extended fib lines into all of expansion
#v1.4 - 01.20.2020 - BLT - Added a scan capability for fib retracement levels. The plot: lastswing determines by being 1 or 0 the fib percentage levels as in the following Table
#Table to determine retracement fib levels for scan purposes
#lastswing == 1 (100%) 0 (0%) Upper Level of most recent swing
#fib1 == 23.6% 76.4%
#fib2 == 38.2% 61.8%
#fibm == 50.0% 50.0%
#fib3 == 61.8% 38.2%
#fib4 == 76.4% 23.6%
#Example Scan #1 requested where close > 61.8% and lastswing = 1 (100%) with this studies name saved as: SwingHL_Fibs_v14
#In Scanner enter: close > SwingHL_Fibs_v14().fib3 and SwingHL_Fibs_v14().lastswing is equal to 1
#Example Scan #2 where close crosses above 61.8% within "x" bars and lastswing = 1 (100%) with this studies name saved as: SwingHL_Fibs_v14
#In Scanner enter: close crosses above SwingHL_Fibs_v14().fib3 within 3 bars and SwingHL_Fibs_v14().lastswing is equal to 1
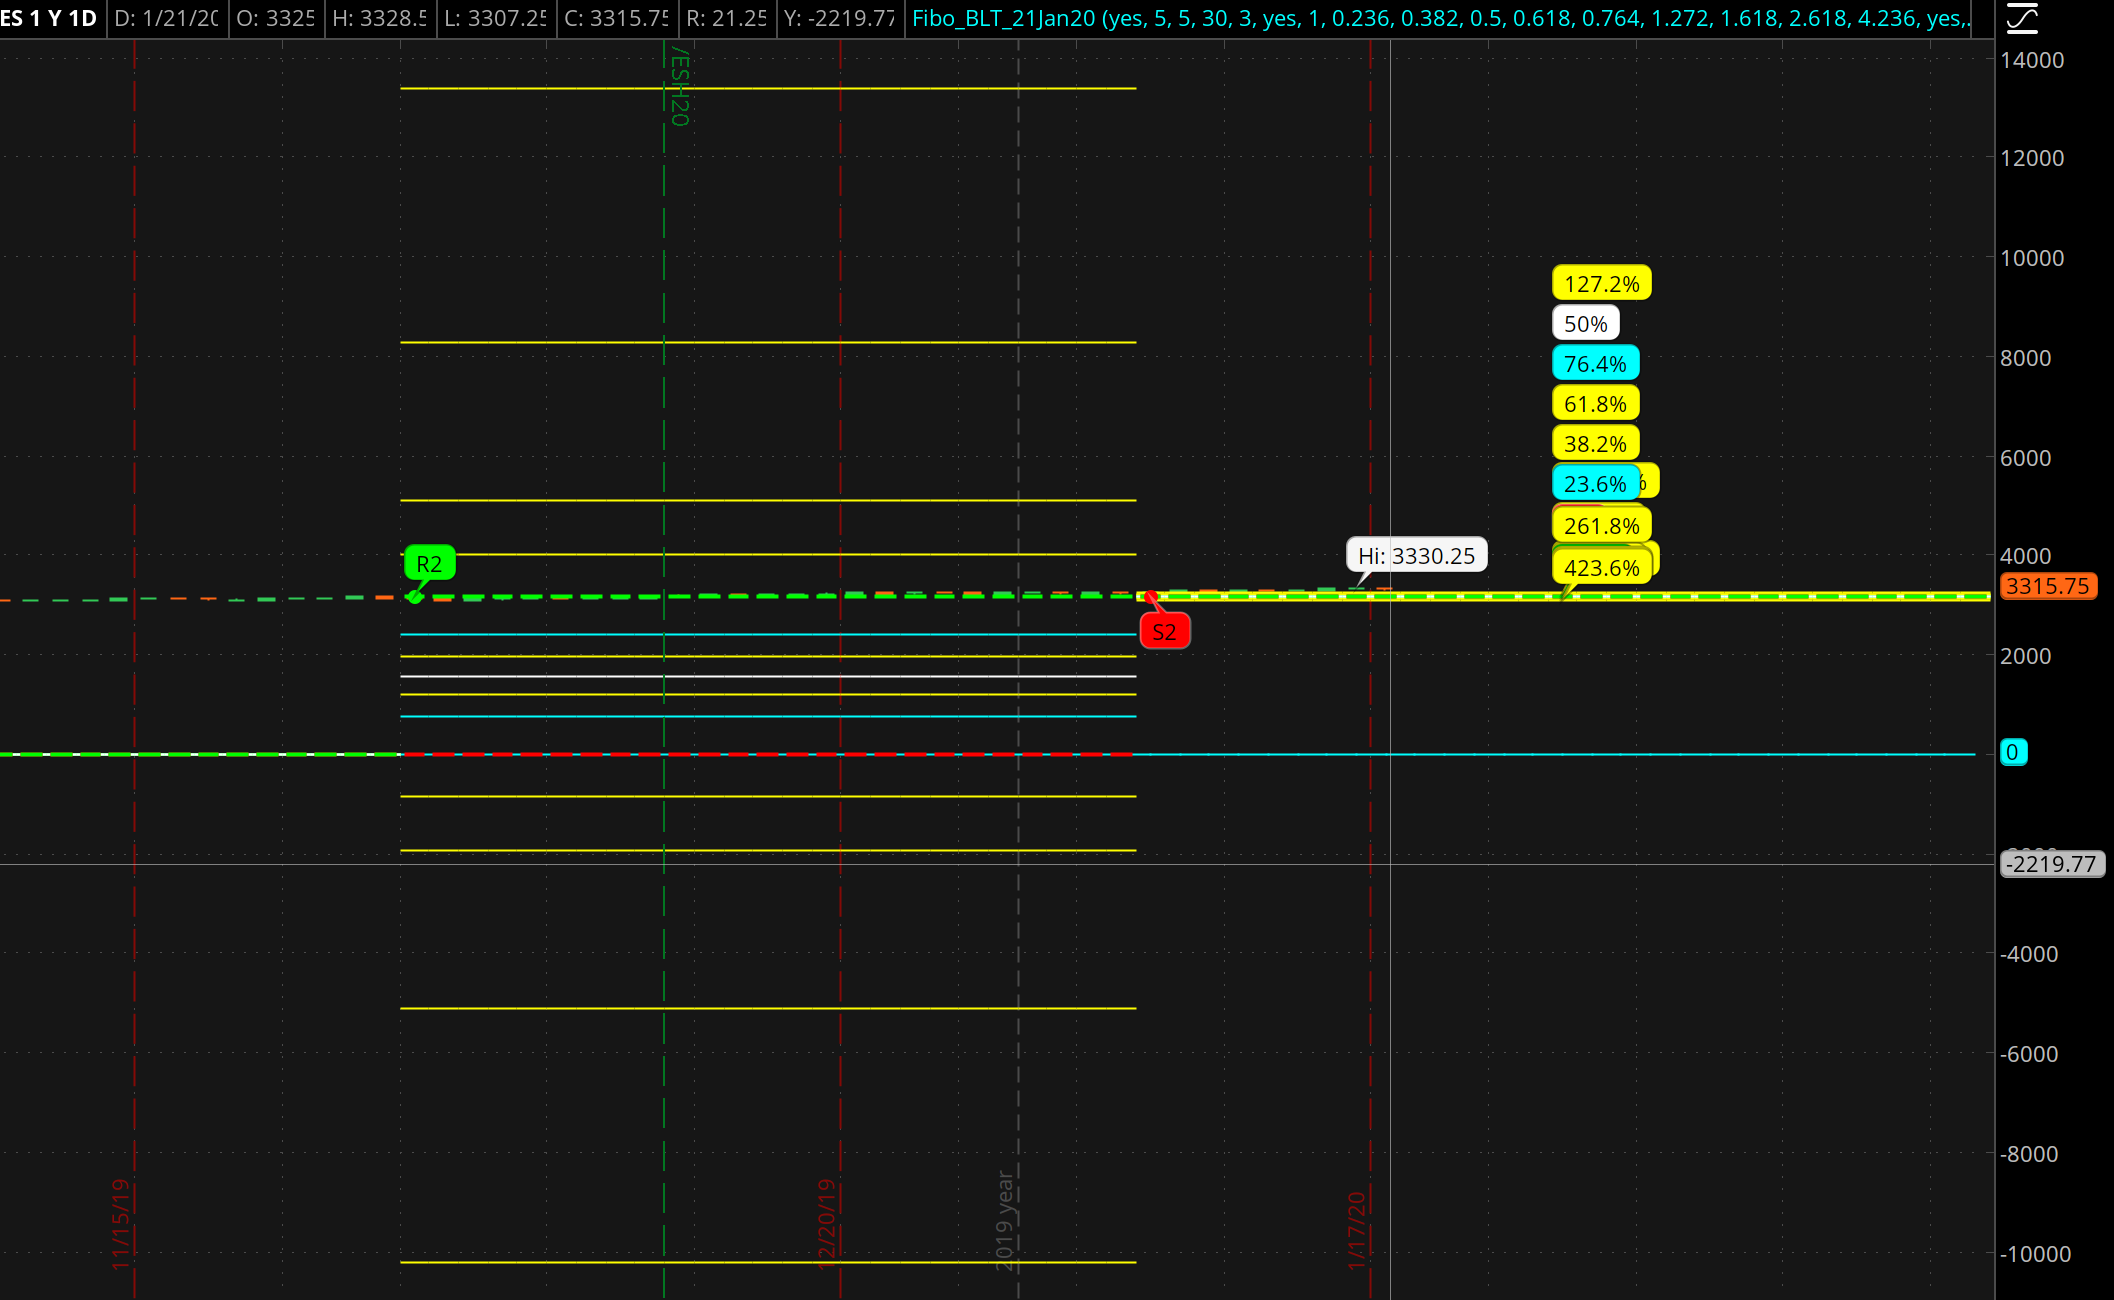
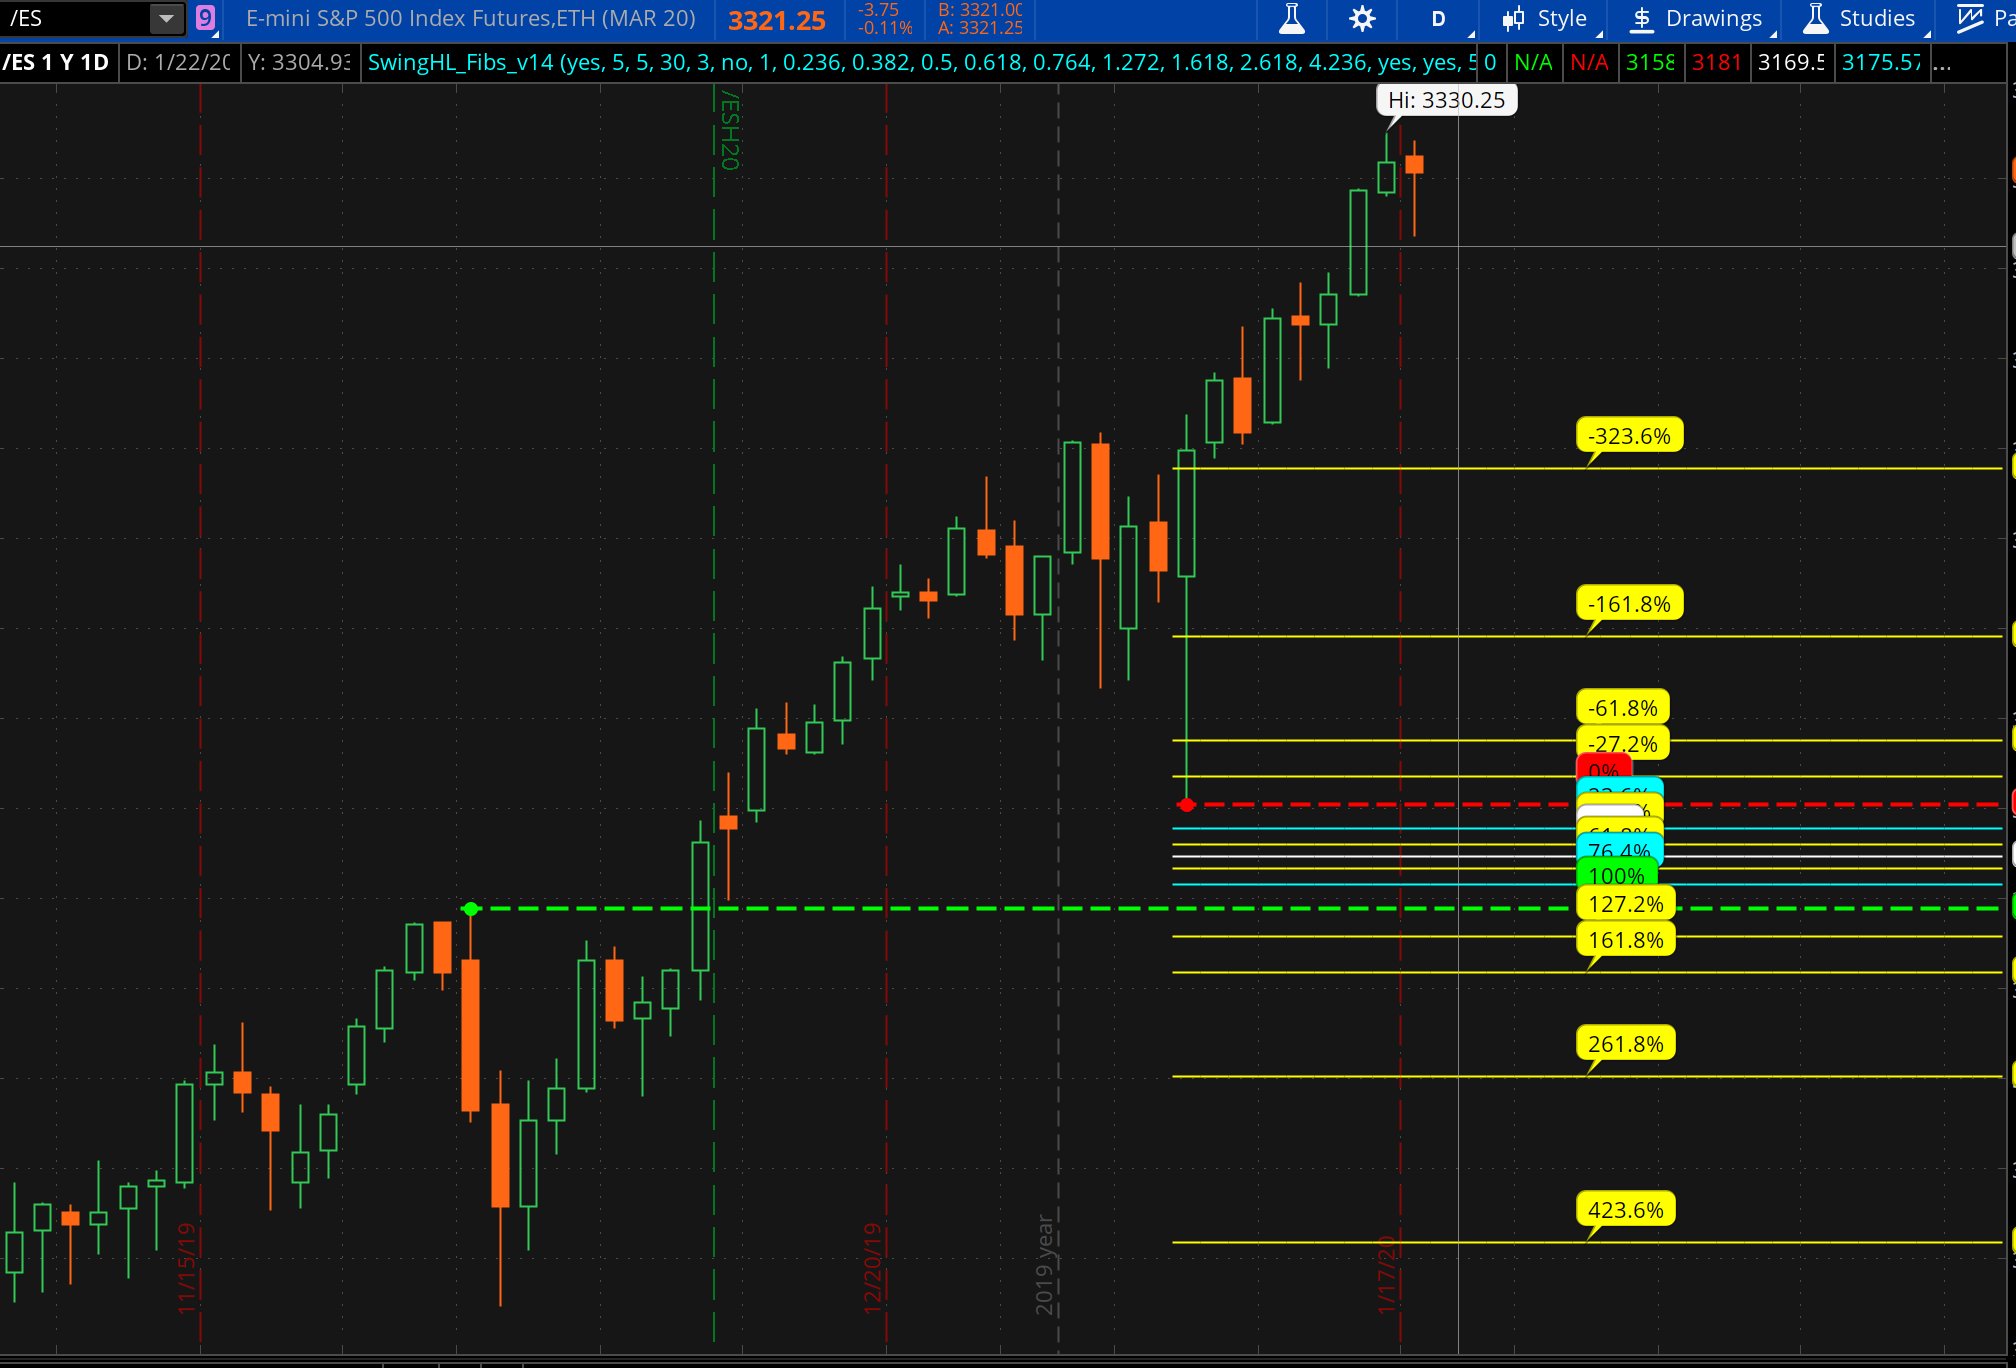
#v1.5 - 01.20.2020 - BLT - After multiple requests for help with scans, chart bubbles can be displayed with the code source of the fib lines. Best way to view this is to set the input showfib_scan_names_bubbles to YES and input showfib_bubbles to NO. See the above examples for how to use these names in scans.
input showlastswing = yes;
input swing_back1 = 5;
input swing_forward1 = 5;
input maxbars1 = 30;
def na = Double.NaN;
def bn = barnumber();
def sb1 = swing_back1;
def sf1 = swing_forward1;
def lfor1 = Lowest(low, sf1)[-sf1];
def lback1 = Lowest(low, sb1)[1];
def swinglow1 = if low < lfor1 and low < lback1 then 1 else 0;
def swinglowbar = if low < lfor1 and low < lback1 then bn else na;
def hfor1 = Highest(high, sf1)[-sf1];
def hback1 = Highest(high, sb1)[1];
def swinghigh1 = if high > hfor1 and high > hback1 then 1 else 0;
def swinghighbar = if high > hfor1 and high > hback1 then bn else na;
plot lastswing = highestall(swinghighbar)>highestall(swinglowbar);
#Swings identifed as points
plot r2 = if showlastswing ==yes and bn==highestall(swinghighbar) then high else if showlastswing == no and swinghigh1 then high else na;
plot s2 = if showlastswing == yes and bn==highestall(swinglowbar) then low else if showlastswing == no and swinglow1 then low else na;
r2.SetStyle(Curve.POINTS);
r2.SetLineWeight(4);
r2.SetDefaultColor(Color.GREEN);
r2.HideBubble();
s2.SetStyle(Curve.POINTS);
s2.SetLineWeight(4);
s2.SetDefaultColor(Color.RED);
s2.HideBubble();
input bubbleoffsetfactor = 3;
input showbubbles_r2s2 = yes;
AddChartBubble(showbubbles_r2s2 and r2, high + TickSize() * bubbleoffsetfactor, "R2", Color.GREEN, yes);
AddChartBubble(showbubbles_r2s2 and s2, low - TickSize() * bubbleoffsetfactor, "S2", Color.RED, no);
#Store Previous Data
def r2save = if !IsNaN(r2) then r2 else r2save[1];
def s2save = if !IsNaN(s2) then s2 else s2save[1];
#Fibonacci
input numberfibstoshow = 1;
#Retracement Fibonacci Levels
input fib1level = .236;
input fib2level = .382;
input fibMlevel = .500;
input fib3level = .618;
input fib4level = .764;
#Extended Fibonacci Levels - These will create complementary extensions below zero as well as those inputs below which are over 1
input fib5extlevel = 1.272;
input fib6extlevel = 1.618;
input fib7extlevel = 2.618;
input fib8extlevel = 4.236;
#Fibonacci Lines
def fibh = r2save;
def fibl = s2save;
def range = if isnan(close) then range[1] else fibh - fibl;
def data = CompoundValue(1, if (r2save == high) and range<0 or (s2save == low) and range>0 then data[1] + 1 else data[1], 0);
def datacount = if isnan(close) then datacount[1] else (HighestAll(data) - data[1]) + 1;
input showfiblines = yes;
plot fibHp = r2save;
plot fibLp = s2save;
def fibmext=if !isnan(fibl + range * fibMlevel) then fibmext[1] else fibl + range * fibMlevel;
plot fibM = if showfiblines == no then na else if datacount <= numberfibstoshow then fibl + range * fibMlevel else na;
plot fib1 = if showfiblines == no then na else if datacount <= numberfibstoshow then fibl + range * fib1level else na;
plot fib2 = if showfiblines == no then na else if datacount <= numberfibstoshow then fibl + range * fib2level else na;
plot fib3 = if showfiblines == no then na else if datacount <= numberfibstoshow then fibl + range * fib3level else na;
plot fib4 = if showfiblines == no then na else if datacount <= numberfibstoshow then fibl + range * fib4level else na;
plot fib5 = if showfiblines == no then na else if datacount <= numberfibstoshow then fibl + range * fib5extlevel else na;
plot fib6 = if showfiblines == no then na else if datacount <= numberfibstoshow then fibl + range * fib6extlevel else na;
plot fib7 = if showfiblines == no then na else if datacount <= numberfibstoshow then fibl + range * fib7extlevel else na;
plot fib8 = if showfiblines == no then na else if datacount <= numberfibstoshow then fibl + range * fib8extlevel else na;
plot fib5a = if showfiblines == no then na else if datacount <= numberfibstoshow then fibh + range * -fib5extlevel else na;
plot fib6a = if showfiblines == no then na else if datacount <= numberfibstoshow then fibh + range * -fib6extlevel else na;
plot fib7a = if showfiblines == no then na else if datacount <= numberfibstoshow then fibh + range * -fib7extlevel else na;
plot fib8a = if showfiblines == no then na else if datacount <= numberfibstoshow then fibh + range * -fib8extlevel else na;
fibHp.SetPaintingStrategy(PaintingStrategy.DASHES);
fibLp.SetPaintingStrategy(PaintingStrategy.DASHES);
fibHp.SetLineWeight(2);
fibLp.SetLineWeight(2);
fibM.SetPaintingStrategy(PaintingStrategy.HORIZONTAL);
fib1.SetPaintingStrategy(PaintingStrategy.HORIZONTAL);
fib2.SetPaintingStrategy(PaintingStrategy.HORIZONTAL);
fib3.SetPaintingStrategy(PaintingStrategy.HORIZONTAL);
fib4.SetPaintingStrategy(PaintingStrategy.HORIZONTAL);
fib5.SetPaintingStrategy(PaintingStrategy.HORIZONTAL);
fib6.SetPaintingStrategy(PaintingStrategy.HORIZONTAL);
fib7.SetPaintingStrategy(PaintingStrategy.HORIZONTAL);
fib8.SetPaintingStrategy(PaintingStrategy.HORIZONTAL);
fib5a.SetPaintingStrategy(PaintingStrategy.HORIZONTAL);
fib6a.SetPaintingStrategy(PaintingStrategy.HORIZONTAL);
fib7a.SetPaintingStrategy(PaintingStrategy.HORIZONTAL);
fib8a.SetPaintingStrategy(PaintingStrategy.HORIZONTAL);
fibHp.SetDefaultColor(Color.GREEN);
fibLp.SetDefaultColor(Color.RED);
fibM.SetDefaultColor(Color.WHITE);
fib1.SetDefaultColor(Color.CYAN);
fib2.SetDefaultColor(Color.YELLOW);
fib3.SetDefaultColor(Color.YELLOW);
fib4.SetDefaultColor(Color.CYAN);
fib5.setdefaultColor(color.yellow);
fib6.setdefaultColor(color.yellow);
fib7.setdefaultColor(color.yellow);
fib8.setdefaultColor(color.yellow);
fib5a.setdefaultColor(color.yellow);
fib6a.setdefaultColor(color.yellow);
fib7a.setdefaultColor(color.yellow);
fib8a.setdefaultColor(color.yellow);
#To Hide Price Bubbles on Right Axis, remove the "#" sign on the following HideBubble() code
#fibM.HideBubble();
#fib1.HideBubble();
#fib2.HideBubble();
#fib3.HideBubble();
#fib4.HideBubble();
#fib5.HideBubble();
#fib6.HideBubble();
#fib7.HideBubble();
#fib8.HideBubble();
#fib5a.HideBubble();
#fib6a.HideBubble();
#fib7a.HideBubble();
#fib8a.HideBubble();
input showfib_bubbles = yes;
input bubble_mover = 5; #Moves bubbles left/right then number of bars input here
def n = bubble_mover;
def n1 = n +1;
AddChartBubble(showfib_bubbles and !IsNaN(close[n1]) and IsNaN(close[n]), fibh[n1], "fibh", Color.green, yes);
AddChartBubble(showfib_bubbles and !IsNaN(close[n1]) and IsNaN(close[n]), fibl[n1], aspercent(if !lastswing then 0 else 1), Color.red, yes);
#Fib Retracement Level Chart Bubbles
AddChartBubble(showfib_bubbles and !IsNaN(close[n1]) and IsNaN(close[n]), fib1[n1], if !lastswing then aspercent(fib1level) else aspercent(1-fib1level), Color.cyan, yes);
AddChartBubble(showfib_bubbles and !IsNaN(close[n1]) and IsNaN(close[n]), fib2[n1], if !lastswing then aspercent(fib2level) else aspercent(1-fib2level), Color.yellow, yes);
AddChartBubble(showfib_bubbles and !IsNaN(close[n1]) and IsNaN(close[n]), fib3[n1], if !lastswing then aspercent(fib3level) else aspercent(1-fib3level), Color.yellow, yes);
AddChartBubble(showfib_bubbles and !IsNaN(close[n1]) and IsNaN(close[n]), fib4[n1], if !lastswing then aspercent(fib4level) else aspercent(1-fib4level), Color.cyan, yes);
AddChartBubble(showfib_bubbles and !IsNaN(close[n1]) and IsNaN(close[n]), fibm[n1], if !lastswing then aspercent(fibmlevel) else aspercent(1-fibmlevel), Color.white, yes);
#Fib Extension Levels Chart Bubbles
AddChartBubble(showfib_bubbles and !IsNaN(close[n1]) and IsNaN(close[n]), fib5[n1], if lastswing then aspercent(1-fib5extlevel) else aspercent(fib5extlevel) , Color.yellow, yes);
AddChartBubble(showfib_bubbles and !IsNaN(close[n1]) and IsNaN(close[n]), fib6[n1], if lastswing then aspercent(1-fib6extlevel) else aspercent(fib6extlevel), Color.yellow, yes);
AddChartBubble(showfib_bubbles and !IsNaN(close[n1]) and IsNaN(close[n]), fib7[n1], if lastswing then aspercent(1-fib7extlevel) else aspercent(fib7extlevel), Color.yellow, yes);
AddChartBubble(showfib_bubbles and !IsNaN(close[n1]) and IsNaN(close[n]), fib8[n1], if lastswing then aspercent(1-fib8extlevel) else aspercent(fib8extlevel), Color.yellow, yes);
AddChartBubble(showfib_bubbles and !IsNaN(close[n1]) and IsNaN(close[n]), fib5a[n1], if lastswing then aspercent(fib5extlevel) else aspercent(1-fib5extlevel) , Color.yellow, yes);
AddChartBubble(showfib_bubbles and !IsNaN(close[n1]) and IsNaN(close[n]), fib6a[n1], if lastswing then aspercent(fib6extlevel) else aspercent(1-fib6extlevel), Color.yellow, yes);
AddChartBubble(showfib_bubbles and !IsNaN(close[n1]) and IsNaN(close[n]), fib7a[n1], if lastswing then aspercent(fib7extlevel) else aspercent(1-fib7extlevel), Color.yellow, yes);
AddChartBubble(showfib_bubbles and !IsNaN(close[n1]) and IsNaN(close[n]), fib8a[n1], if lastswing then aspercent(fib8extlevel) else aspercent(1-fib8extlevel), Color.yellow, yes);
#Fib Bubbles with code names of fib levels to assist in building scans
input showfib_scan_names_bubbles = yes;
AddChartBubble(showfib_scan_names_bubbles and !IsNaN(close[n1]) and IsNaN(close[n]), fibh[n1], aspercent(if !lastswing then 1 else 0), Color.green, yes);
AddChartBubble(showfib_scan_names_bubbles and !IsNaN(close[n1]) and IsNaN(close[n]), fibl[n1], "fibl", Color.red, yes);
#Fib Retracement Level Chart Bubbles
AddChartBubble(showfib_scan_names_bubbles and !IsNaN(close[n1]) and IsNaN(close[n]), fib1[n1], "fib1", Color.cyan, yes);
AddChartBubble(showfib_scan_names_bubbles and !IsNaN(close[n1]) and IsNaN(close[n]), fib2[n1], "fib2", Color.yellow, yes);
AddChartBubble(showfib_scan_names_bubbles and !IsNaN(close[n1]) and IsNaN(close[n]), fib3[n1], "fib3", Color.yellow, yes);
AddChartBubble(showfib_scan_names_bubbles and !IsNaN(close[n1]) and IsNaN(close[n]), fib4[n1], "fib4", Color.cyan, yes);
AddChartBubble(showfib_scan_names_bubbles and !IsNaN(close[n1]) and IsNaN(close[n]), fibm[n1], "fibm", Color.white, yes);
#Fib Extension Levels Chart Bubbles
AddChartBubble(showfib_scan_names_bubbles and !IsNaN(close[n1]) and IsNaN(close[n]), fib5[n1], "fib5" , Color.yellow, yes);
AddChartBubble(showfib_scan_names_bubbles and !IsNaN(close[n1]) and IsNaN(close[n]), fib6[n1], "fib6", Color.yellow, yes);
AddChartBubble(showfib_scan_names_bubbles and !IsNaN(close[n1]) and IsNaN(close[n]), fib7[n1], "fib7", Color.yellow, yes);
AddChartBubble(showfib_scan_names_bubbles and !IsNaN(close[n1]) and IsNaN(close[n]), fib8[n1], "fib8", Color.yellow, yes);
AddChartBubble(showfib_scan_names_bubbles and !IsNaN(close[n1]) and IsNaN(close[n]), fib5a[n1], "fib5a" , Color.yellow, yes);
AddChartBubble(showfib_scan_names_bubbles and !IsNaN(close[n1]) and IsNaN(close[n]), fib6a[n1], "fib6a", Color.yellow, yes);
AddChartBubble(showfib_scan_names_bubbles and !IsNaN(close[n1]) and IsNaN(close[n]), fib7a[n1], "fib7a", Color.yellow, yes);
AddChartBubble(showfib_scan_names_bubbles and !IsNaN(close[n1]) and IsNaN(close[n]), fib8a[n1], "fib8a", Color.yellow, yes);

")