90% of the members attempting chatGPT scripting; do not provide good detailed specifications.
Members know what end result that they want but lack the ability to tell chatGPT, the step-by-step logic required to code a script to achieve that end result.
This results in chatGPT creating non-working garbage code.
Here is a video on how to successfully have chatGPT create functional scripts.
The above video, explains the basics of providing good specifications to AI which results in better scripts.
Hello everyone!! I am new to this and would like to request your help to
debug this script, so that it makes a profit and loss report, between two dates to be determined, in order to speed up the search for strategies. Thank you very much!!
# Initialize the capital
def capital = 10000
def initialcapital = capital
def current capital = capital
def start date=??
def finish date=??
# Initialize the number of shares
actions = 0
# Check the crossings and perform operations
if crossover(hullMA1, hullMA2)
{
# Make purchase
shares = currentcapital / close
currentcapital = 0
}
if crossunder(hullMA1, hullMA2)
{
# Make a sale
currentcapital = shares * close
actions = 0
}
# Calculate the accumulated money
accumulatedmoney = current capital + shares * close
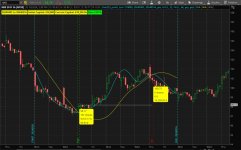
uses the crossing of 2 averages to create buy and sell signals.
default is HULL , 22 and 66 lengths
when a buy happens , a horizontal line starts drawing at the buy price.
can pick 2 dates and choose to enable the range. if dates are on a weekend, it will find the next trading date.
can pick a starting balance.
on a buy signal, the maximum quantity of shares are calculated.
labels,
trading date range , if date range is enabled.
current account value
gain amount. (green or red)
if date range is enabled, then the average lines and signals and bubbles are restricted to within the date range.
can turn on test bubbles and lines. bubbles show shares , buy amount, balance,
Code:
# chat223_profit_loss1

#https://usethinkscript.com/threads/chatgpt-bard-other-ai-scripts-which-cant-be-used-in-thinkorswim.13822/page-12#post-139305
# post223
#  profit and loss report,  between 2 dates

def na = Double.NaN;
def bn = BarNumber();
def price = round(close, 2);

input starting_capital = 10000;
#  date  yyyymmdd
input start_date  = 20240303;
#input start_date  = 20240304;
input finish_date = 20240316;
#input finish_date = 20240317;
#input finish_date = 20240318;

input enable_trade_range = yes;
addlabel(enable_trade_range, asprice(start_date) + " to " + asprice(finish_date), color.yellow);


def date_en = if !enable_trade_range then 1
 else (DaysFromDate(start_date) >= 0 and DaysTillDate(finish_date) >= 0);

def date_start = enable_trade_range and DaysFromDate(start_date)[1] < 0 and DaysFromDate(start_date) >= 0;
def date_end = enable_trade_range and DaysfromDate(finish_date)[1] <0 and DaysfromDate(finish_date) >= 0;

addverticalline(date_start, "START  " + asprice(start_date), color.cyan);
addverticalline(date_end, "END  " + asprice(finish_date), color.cyan);

addchartbubble(0, low,
 DaysFromDate(start_date) + " F\n" +
 DaysTillDate(finish_date) + " T"
, color.yellow, no);


#input avg1_type = AverageType.exponential;
#input avg1_type = AverageType.Simple;
input avg1_type = AverageType.HULL;
input avg1_length = 22;
def avg1 = MovingAverage(avg1_type, price, avg1_length );

#input avg2_type = AverageType.Simple;
input avg2_type = AverageType.HULL;
input avg2_length = 66;
def avg2 = MovingAverage(avg2_type, price, avg2_length );

input show_average_lines = yes;
plot zavg1 = if show_average_lines and date_en then avg1 else na;
plot zavg2 = if show_average_lines and date_en then avg2 else na;
zavg1.SetDefaultColor(Color.CYAN);
zavg1.SetLineWeight(1);
zavg1.HideBubble();
zavg2.SetDefaultColor(Color.YELLOW);
zavg2.SetLineWeight(1);
zavg2.HideBubble();

def xup = avg1 crosses above avg2;
def xdwn = avg1 crosses below avg2;

# Check the crossings and perform buys/sells
# use all money on each trade
def shares;
def shares_value;
def current_capital;
def buy_price;
if bn == 1 then {
  buy_price = 0;
  shares = 0;
  shares_value = 0;
  current_capital = starting_capital;
} else if date_en and xup then {
#  buy
  buy_price = price;
  shares = floor(current_capital[1] / buy_price);
  shares_value = round(shares * price, 2);
  current_capital = current_capital[1] - shares_value;
} else if date_en and xdwn then {
#  sell
  buy_price = 0;
  shares = 0;
  shares_value = 0;
  current_capital = current_capital[1] + (shares[1] * price);
} else {
  buy_price = buy_price[1];
  shares = shares[1];
  shares_value = shares * price;
  current_capital = current_capital[1];
}

def current_value = Current_Capital + (shares[0] * price);
def gain_per = round(100 * (current_value-starting_capital)/starting_capital,2);


AddLabel(yes, "Initial Capital: $" +  starting_capital, color.yellow);
AddLabel(yes, "Current Capital: $" + current_value , color.yellow);
AddLabel(yes, "Gain " + gain_per + " %" , (if gain_per > 0 then color.green else color.red));

# buy price line
plot zb = if buy_price == 0 then na
 else if isnan(close[1]) then na
 else buy_price;


input test_bubbles = no;
addchartbubble(test_bubbles and date_en and (xup or xdwn), low,
 price + "\n" +
 shares + " shares\n" +
 shares_value + " $\n" +
 current_capital + " $\n"
, color.yellow, no);

addverticalline(test_bubbles and date_en and xup, "buy", color.green);
addverticalline(test_bubbles and date_en and xdwn, "sell", color.red);
#
Besides adding the support and resistance, knowing how much an instrument can move in a day/week and when that occurred can help with trading (Predominantly selling covered calls on low volatile instruments like SPY).
I am trying to add the following labels to my chart.
1. Maximum price delta (High - Low) that has occurred over the past x number of bars.
2. Exact date when the Maximum price delta (High - Low) has occurred.
Here is my attempt but I doubt the accuracy of the script.
Code:
# Initialize the maximum difference and its index variables
def maxDifference = fold i = 1 to 365 with maxDiff = Double.NEGATIVE_INFINITY do
    if AbsValue(high[i] - low[i]) > maxDiff then AbsValue(high[i] - low[i]) else maxDiff;

# Add a label to display the maxDifference and its date
AddLabel(yes, "Max Abs Difference: " + maxDifference + "   ", Color.YELLOW);

def maxIndex = fold j = 1 to 365 with idx = 0 do
    if AbsValue(high[j] - low[j]) == maxDifference then j else idx;

def daysPrior = 365 - maxIndex;

AddLabel(yes, "Days ago: " + daysPrior + "  ", Color.YELLOW);
a few things,
1. your loops are not using 'while' , so they look at all 365 possible values, so the result will be too high.
2. you don't need to subtract,
def daysPrior = 365 - maxIndex;
maxindex is the count of bars back to the desired one.
use this,
def daysPrior = maxIndex;
3. there are about 252 trading days in a year, not 365
instead of delta, i will be refering to the data as height, high - low.
when the loop count is bigger than the quantity of bars on the chart, it appears as if it reads data from bars before the first bar. with 251 chart bars, it found a value 270 bars back. i don't know if this is correct or not.
i added while conditions to the loops. they keep the loop active only 'while' that condition is true.
on the first loop, highest height, i added a while condition to the loop, to only read from bars with a valid price.
for the second loop, i used while to check if the bar height is not equal to the highest height. when it becomes equal, the loop stops.
Code:
#max_ht_prev_00

#https://usethinkscript.com/threads/max-price-delta-high-low-and-when-it-occurred.18348/
#Max Price Delta [High-Low] and when it occurred
#traderjoe777  4/2  #1

def na = double.nan;
def bn = barnumber();
# used in test code/bubbles
#def maxbn = highestall(if !isnan(close) then bn else 0);
#def revbn = maxbn - bn + 1;


# from tos chat - mobius
def data = getYYYYMMDD();
def yr = Round(data/10000, 0);
def mo = Round((data % 10000) / 100, 0);
def dy = (data % 100);
input test1 = no;
addLabel(test1, "date: " + mo + "/" + dy + "/" + AsPrice(yr), color.white);


# Initialize the maximum difference and its index variables
#def maxDifference = fold i = 1 to 365 with maxDiff = Double.NEGATIVE_INFINITY do
#    if AbsValue(high[i] - low[i]) > maxDiff then AbsValue(high[i] - low[i]) else maxDiff;
def ht = high - low;
input n = 365;
def maxDifference = fold i = 1 to n
  with maxDiff
  while (!isnan(close) and getvalue(bn,i) > 0)
  do max( (getvalue(high,i) - getvalue(low,i)), maxdiff );

# Add a label to display the maxDifference and its date
AddLabel(yes, "Max Abs Difference: " + maxDifference + "   ", Color.YELLOW);

#def maxIndex = fold j = 1 to 365 with idx = 0 do
#    if AbsValue(high[j] - low[j]) == maxDifference then j else idx;
def maxIndex = fold j = 1 to n
 with idx = 1
 while getvalue(ht,j) != maxDifference
 do idx + 1;


#def daysPrior = n - maxIndex;
def daysPrior = maxIndex;

def mo2 = getvalue(mo,maxIndex);
def dy2 = getvalue(dy,maxindex);
AddLabel(yes, "Days ago: " + daysPrior + "  ", Color.YELLOW);
AddLabel(yes, "Date: " + mo2 + " / " + dy2, Color.YELLOW);


input test2 = no;
def z1 = average(low,4);
addchartbubble(test2, z1*0.95,
bn + " bn\n" +
#maxbn + " mx\n" +
#revbn + " rev\n" +
ht + "\n" +
maxIndex + "\n"
, color.yellow, no);
#
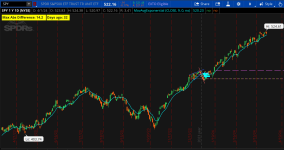
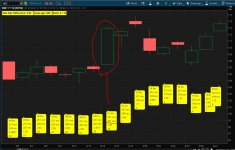
this picture shows the labels,
max height , bars back , date
this shows test bubbles
Hello everyone. I’m trying to get thinkscript to divide High Price by Open Price on options chain with custom columns for each strike price.
The reason is to see how many times risk from open to high eliminating manually calculating for each strike.
# Calculate High divided by Open
def high_divided_by_open = high / open;
# Plot the result with value as label in canyon color
plot HighDividedByOpen = high_divided_by_open;
HighDividedByOpen.AssignValueColor(if high_divided_by_open > 1 then Color.CYAN else Color.RED);
HighDividedByOpen.SetPaintingStrategy(PaintingStrategy.VALUES_BELOW);
i put your code as a lower chart
that way i can see the numbers and see what is going on.
high is always >= open.
on a red candle with no top wick, open and high are =, and results in 1
any other candle will be a tiny ratio, with a number like 1.00005
that is why they are all 1.0
try something like this, to change the number to be something unique,
def high_divided_by_open = round(((high / open)-1)*1000,2);
Strategy with errors Can I get clarification to fix errors?
def EMA8 = ExpAverage(close, 8);
# Define the crossover conditions
def buy = if EMA3 crosses above EMA8 then 1 else 0;
def sell = if EMA3 crosses below EMA8 then 1 else 0;
# Plot arrows on the chart where the conditions are met
plot BuySignal = if buy then low else Double.NaN;
BuySignal.SetPaintingStrategy(PaintingStrategy.BOOLEAN_ARROW_UP);
BuySignal.SetDefaultColor(Color.GREEN);
plot SellSignal = if sell then high else Double.NaN;
SellSignal.SetPaintingStrategy(PaintingStrategy.BOOLEAN_ARROW_DOWN);
SellSignal.SetDefaultColor(Color.RED);
# Alerts
# Alert(SoundAlerts and h > al , "Up", Alert.BAR, Sound.Bell);
# Alert(SoundAlerts and l < bl, "Down", Alert.BAR, Sound.Ding);
AddOrder(OrderType.BUY_AUTO, Bl <> Bl[1] , tickColor = GetColor(0), arrowColor
= GetColor(0), name = "Buy");
AddOrder(OrderType.SELL_TO_CLOSE, Al <> Al[1] , tickColor = GetColor(1),
arrowColor = GetColor(1), name = "Sell");
I'm getting the following errors
No such variable: Bl at 19:30
No such variable: Bl at 19:36
No such variable: Al at 21:35
No such variable: Al at 21:41
in the buy and sell formulas,
crosses is highlighted red. but it isn't the problem.
quite often, the wrong word is highlighted red. you have to look at the whole code line or the line before it.
in the buy and sell formulas,
crosses is highlighted red. but it isn't the problem.
quite often, the wrong word is highlighted red. you have to look at the whole code line or the line before it.
Strategy with errors Can I get clarification to fix errors?
def EMA8 = ExpAverage(close, 8);
# Define the crossover conditions
def buy = if EMA3 crosses above EMA8 then 1 else 0;
def sell = if EMA3 crosses below EMA8 then 1 else 0;
# Plot arrows on the chart where the conditions are met
plot BuySignal = if buy then low else Double.NaN;
BuySignal.SetPaintingStrategy(PaintingStrategy.BOOLEAN_ARROW_UP);
BuySignal.SetDefaultColor(Color.GREEN);
plot SellSignal = if sell then high else Double.NaN;
SellSignal.SetPaintingStrategy(PaintingStrategy.BOOLEAN_ARROW_DOWN);
SellSignal.SetDefaultColor(Color.RED);
# Alerts
# Alert(SoundAlerts and h > al , "Up", Alert.BAR, Sound.Bell);
# Alert(SoundAlerts and l < bl, "Down", Alert.BAR, Sound.Ding);
AddOrder(OrderType.BUY_AUTO, Bl <> Bl[1] , tickColor = GetColor(0), arrowColor
= GetColor(0), name = "Buy");
AddOrder(OrderType.SELL_TO_CLOSE, Al <> Al[1] , tickColor = GetColor(1),
arrowColor = GetColor(1), name = "Sell");
I'm getting the following errors
No such variable: Bl at 19:30
No such variable: Bl at 19:36
No such variable: Al at 21:35
No such variable: Al at 21:41
uses the crossing of 2 averages to create buy and sell signals.
default is HULL , 22 and 66 lengths
when a buy happens , a horizontal line starts drawing at the buy price.
can pick 2 dates and choose to enable the range. if dates are on a weekend, it will find the next trading date.
can pick a starting balance.
on a buy signal, the maximum quantity of shares are calculated.
labels,
trading date range , if date range is enabled.
current account value
gain amount. (green or red)
if date range is enabled, then the average lines and signals and bubbles are restricted to within the date range.
can turn on test bubbles and lines. bubbles show shares , buy amount, balance,
Code:
# chat223_profit_loss1

#https://usethinkscript.com/threads/chatgpt-bard-other-ai-scripts-which-cant-be-used-in-thinkorswim.13822/page-12#post-139305
# post223
#  profit and loss report,  between 2 dates

def na = Double.NaN;
def bn = BarNumber();
def price = round(close, 2);

input starting_capital = 10000;
#  date  yyyymmdd
input start_date  = 20240303;
#input start_date  = 20240304;
input finish_date = 20240316;
#input finish_date = 20240317;
#input finish_date = 20240318;

input enable_trade_range = yes;
addlabel(enable_trade_range, asprice(start_date) + " to " + asprice(finish_date), color.yellow);


def date_en = if !enable_trade_range then 1
 else (DaysFromDate(start_date) >= 0 and DaysTillDate(finish_date) >= 0);

def date_start = enable_trade_range and DaysFromDate(start_date)[1] < 0 and DaysFromDate(start_date) >= 0;
def date_end = enable_trade_range and DaysfromDate(finish_date)[1] <0 and DaysfromDate(finish_date) >= 0;

addverticalline(date_start, "START  " + asprice(start_date), color.cyan);
addverticalline(date_end, "END  " + asprice(finish_date), color.cyan);

addchartbubble(0, low,
 DaysFromDate(start_date) + " F\n" +
 DaysTillDate(finish_date) + " T"
, color.yellow, no);


#input avg1_type = AverageType.exponential;
#input avg1_type = AverageType.Simple;
input avg1_type = AverageType.HULL;
input avg1_length = 22;
def avg1 = MovingAverage(avg1_type, price, avg1_length );

#input avg2_type = AverageType.Simple;
input avg2_type = AverageType.HULL;
input avg2_length = 66;
def avg2 = MovingAverage(avg2_type, price, avg2_length );

input show_average_lines = yes;
plot zavg1 = if show_average_lines and date_en then avg1 else na;
plot zavg2 = if show_average_lines and date_en then avg2 else na;
zavg1.SetDefaultColor(Color.CYAN);
zavg1.SetLineWeight(1);
zavg1.HideBubble();
zavg2.SetDefaultColor(Color.YELLOW);
zavg2.SetLineWeight(1);
zavg2.HideBubble();

def xup = avg1 crosses above avg2;
def xdwn = avg1 crosses below avg2;

# Check the crossings and perform buys/sells
# use all money on each trade
def shares;
def shares_value;
def current_capital;
def buy_price;
if bn == 1 then {
  buy_price = 0;
  shares = 0;
  shares_value = 0;
  current_capital = starting_capital;
} else if date_en and xup then {
#  buy
  buy_price = price;
  shares = floor(current_capital[1] / buy_price);
  shares_value = round(shares * price, 2);
  current_capital = current_capital[1] - shares_value;
} else if date_en and xdwn then {
#  sell
  buy_price = 0;
  shares = 0;
  shares_value = 0;
  current_capital = current_capital[1] + (shares[1] * price);
} else {
  buy_price = buy_price[1];
  shares = shares[1];
  shares_value = shares * price;
  current_capital = current_capital[1];
}

def current_value = Current_Capital + (shares[0] * price);
def gain_per = round(100 * (current_value-starting_capital)/starting_capital,2);


AddLabel(yes, "Initial Capital: $" +  starting_capital, color.yellow);
AddLabel(yes, "Current Capital: $" + current_value , color.yellow);
AddLabel(yes, "Gain " + gain_per + " %" , (if gain_per > 0 then color.green else color.red));

# buy price line
plot zb = if buy_price == 0 then na
 else if isnan(close[1]) then na
 else buy_price;


input test_bubbles = no;
addchartbubble(test_bubbles and date_en and (xup or xdwn), low,
 price + "\n" +
 shares + " shares\n" +
 shares_value + " $\n" +
 current_capital + " $\n"
, color.yellow, no);

addverticalline(test_bubbles and date_en and xup, "buy", color.green);
addverticalline(test_bubbles and date_en and xdwn, "sell", color.red);
#
Thank you very much halcyonguy, thank you very much for the excellent script, it is very useful for backtesting! I am asking you and whoever may be interested, if there is a possibility of taking it to the next level, improving this script in two steps: 1) that it also considers short operations for the calculation of profits, and 2) if there is a possibility of making it The code compares all combinations, at their different lengths, of the two moving averages (and better yet, if possible, of all types of moving averages with each other), and then indicates which of them obtained the best profit. If possible, it would be a great and very useful tool for all users. -
I added a basic example of this, but I need someone experienced to incorporate it so that it works properly. -Thank you in advance.-
# Define the minimum and maximum lengths for the moving averages
input minLength = 5;
input maxLength = 50;
# List of moving average types to test
def maTypes = {SMA, WMA, HullMA, EMA}; # You can add other types of moving averages as needed
# Variables to store the best combination found
def bestProfit = Double.NEGATIVE_INFINITY;
def bestParams = "";
# Loop to test all combinations
foreach length in minLength..maxLength {
foreach maType in maTypes {
# Calculate profits for the current combination
def currentProfit = CalculateProfits(maType, length);
# Update the best combination if one with greater profits is found
if (currentProfit > bestProfit) {
bestProfit = currentProfit;
bestParams = maType + " Length: " + length;
}
}
}
# Print the best combination found
AddLabel(yes, "Best combination: " + bestParams + ", Profit: " + bestProfit);
Please help me find the error in this code. Thank you.
Goal of the code is to Scan for a Moving Average crossing above another moving average AFTER A SPECIFIED NUMBER OF DAYS (BARS)
# Check for crossover and if fastEMA has been below slowEMA for at least 5 days
def belowSlowEMA = fastEMA < slowEMA;
def belowSlowEMAPeriod = Sum(belowSlowEMA, crossPeriod) == crossPeriod;
def cross = if (fastEMA > slowEMA and belowSlowEMAPeriod) then 1 else 0;
# Plot the crossover signal
plot scanSignal = cross;
Lines at the last 3 highest volume vwap level within the last 52 weeks.
This is what i got from ChatGPT. Price is shown but no line is drawn on the chart. This is for just one line for the last highest vwap level.. I need it to draw 3 lines for the last 3 highest vwap level, add a number on each line in ascending order. Thank you for any help.
input lookbackPeriod = 52; # Lookback period in weeks
# Calculate the number of bars in the lookback period
def barsInPeriod = lookbackPeriod * 5;
# Find the highest volume day within the lookback period
def highestVolumeDay = Highest(volume, barsInPeriod);
# Calculate VWAP for the highest volume day
def vwapHighestVolumeDay = if volume == highestVolumeDay then reference VWAP() else Double.NaN;
# Plot horizontal line at the VWAP level of the highest volume day
plot VWAPLine = if !IsNaN(vwapHighestVolumeDay) then vwapHighestVolumeDay else Double.NaN;
VWAPLine.SetDefaultColor(Color.BLUE);
VWAPLine.SetLineWeight(1);
Please help me find the error in this code. Thank you.
Goal of the code is to Scan for a Moving Average crossing above another moving average AFTER A SPECIFIED NUMBER OF DAYS (BARS)
# Check for crossover and if fastEMA has been below slowEMA for at least 5 days
def belowSlowEMA = fastEMA < slowEMA;
def belowSlowEMAPeriod = Sum(belowSlowEMA, crossPeriod) == crossPeriod;
def cross = if (fastEMA > slowEMA and belowSlowEMAPeriod) then 1 else 0;
# Plot the crossover signal
plot scanSignal = cross;
reply to --
the cross = line is wrong,
it should be looking at the previous value of belowSlowEMAPeriod, not the current value.
i added an offset to read a value from 1 bar ago.
replace your code line with this one,
def cross = if (fastEMA > slowEMA and belowSlowEMAPeriod[1] ) then 1 else 0;
Hey guys i'm new here and not a coder by any means, but will appreciate very much if somebody helps me in this.
I would like to build a scan in ToS for at least 3 consistant bar close higher than Upper Bollinger band
to show me intraday overextended stocks like DELL on 04/04/2024
and CZOO on 04/24/2024
When addressing this problem to ChatGPT it provided me with a code that don't work and idk why. The scan criteria are basically simple:
1. Stock should be above upper bollinger band intraday on 2-min chart.
2. Chart must have at least 3 consecutive 2min candles above Upper BB that closed higher one after previous ( so close of candle 3 > close of candle 2 > close of candle 1) and at least 3 consecutive 2min candles which lows are higher than previous two candles (low of candle3> low of candle2> low of candle1)
Lines at the last 3 highest volume vwap level within the last 52 weeks.
This is what i got from ChatGPT. Price is shown but no line is drawn on the chart. This is for just one line for the last highest vwap level.. I need it to draw 3 lines for the last 3 highest vwap level, add a number on each line in ascending order. Thank you for any help.
input lookbackPeriod = 52; # Lookback period in weeks
# Calculate the number of bars in the lookback period
def barsInPeriod = lookbackPeriod * 5;
# Find the highest volume day within the lookback period
def highestVolumeDay = Highest(volume, barsInPeriod);
# Calculate VWAP for the highest volume day
def vwapHighestVolumeDay = if volume == highestVolumeDay then reference VWAP() else Double.NaN;
# Plot horizontal line at the VWAP level of the highest volume day
plot VWAPLine = if !IsNaN(vwapHighestVolumeDay) then vwapHighestVolumeDay else Double.NaN;
VWAPLine.SetDefaultColor(Color.BLUE);
VWAPLine.SetLineWeight(1);
useThinkScript is the #1 community of stock market investors using indicators and other tools to power their trading strategies. Traders of all skill levels use our forums to learn about scripting and indicators, help each other, and discover new ways to gain an edge in the markets.
How do I get started?
We get it. Our forum can be intimidating, if not overwhelming. With thousands of topics, tens of thousands of posts, our community has created an incredibly deep knowledge base for stock traders. No one can ever exhaust every resource provided on our site.
If you are new, or just looking for guidance, here are some helpful links to get you started.
VIP members get exclusive access to these proven and tested premium indicators: Buy the Dip, Advanced Market Moves 2.0, Take Profit, and Volatility Trading Range. In addition, VIP members get access to over 50 VIP-only custom indicators, add-ons, and strategies, private VIP-only forums, private Discord channel to discuss trades and strategies in real-time, customer support, trade alerts, and much more. Learn all about VIP membership here.
How can I access the premium indicators?
To access the premium indicators, which are plug and play ready, sign up for VIP membership here.