ChatGPT, BARD, Other AI Scripts Which Can't Be Used In ThinkOrSwim

MerryDay

Administrative
Staff member
Staff
VIP
Lifetime
90% of the members attempting chatGPT scripting; do not provide good detailed specifications.

Members know what end result that they want but lack the ability to tell chatGPT, the step-by-step logic required to code a script to achieve that end result.
This results in chatGPT providing poor code.

Here is a video on how to successfully have chatGPT create functional scripts.

The above video, explains the basics of providing good specifications to AI which results in better scripts.
AOzhl05.png
 
Last edited:
Hey guys i'm new here and not a coder by any means, but will appreciate very much if somebody helps me in this.

I would like to build a scan in ToS for at least 3 consistant bar close higher than Upper Bollinger band
to show me intraday overextended stocks like DELL on 04/04/2024 View attachment 21700and CZOO on 04/24/2024 View attachment 21701When addressing this problem to ChatGPT it provided me with a code that don't work and idk why. The scan criteria are basically simple:

1. Stock should be above upper bollinger band intraday on 2-min chart.
2. Chart must have at least 3 consecutive 2min candles above Upper BB that closed higher one after previous ( so close of candle 3 > close of candle 2 > close of candle 1) and at least 3 consecutive 2min candles which lows are higher than previous two candles (low of candle3> low of candle2> low of candle1)

Below is the code that ChatGPT provided:
Code:
# Define variables
input length = 20;
input numCandles = 3;

# Calculate Bollinger Bands
def price = close;
def SD = StDev(price, length);
def upperBand = BollingerBands(price, length, 2.0, 2.0).UpperBand;

# Check condition
def aboveUpperBand = close > upperBand;

# Count consecutive candles above upper band
def count = if aboveUpperBand then count[1] + 1 else 0;

# Condition for scan
def signal = count >= numCandles;

# Output
plot scan = signal;

Any help or afdvice will be highly appreciated.

reply to 243
that is surprisingly close, coming from chatgpt.

it is missing the displace input parameter for BollingerBands.
because of this, the length 20 is applied as the displace (sideways shift), instead of 0.
then 2 is used as length, instead of 20.

replace this,
def upperBand = BollingerBands(price, length, 2.0, 2.0).UpperBand;

with this
def upperBand = BollingerBands(price, 0, length, 2.0, 2.0).UpperBand;
 
Last edited:
Greetings and Happy new month!
I have a new study inquiry - with an AI developed study.


The study draws lines for the OHLC on a defined time frame ( in the screenshot- the weekly is set).
The goal is to inquire if Clouds can be added as seen ( in between the High /Low and Open/Close).

The idea is to identify where there was buyer/seller pressure in any given time frame.
The study can be displaced ( in this example, it is ) and has some labels as well.
Thank you to the moderators and organizers of this site/page.
1714690583937.png

Here is the code :
Ruby:
# Define study parameters
input aggregationPeriod = AggregationPeriod.WEEK; # Set aggregation period to WEEK
input displacement = 1; # Set displacement to 1 to target the last completed week

# Calculate OHLC with displacement for the previous week
def openPrice = open(period = aggregationPeriod)[displacement];
def highPrice = high(period = aggregationPeriod)[displacement];
def lowPrice = low(period = aggregationPeriod)[displacement];
def closePrice = close(period = aggregationPeriod)[displacement];

# Determine if the previous week closed positively
def positiveWeek = closePrice > openPrice;
def negativeWeek = closePrice < openPrice;

# Current price retrieval (current close price)
def currClose = close;

# Plot OHLC lines
plot OpenLine = openPrice;
OpenLine.SetDefaultColor(Color.CYAN);

plot HighLine = highPrice;
HighLine.SetDefaultColor(Color.GREEN);

plot LowLine = lowPrice;
LowLine.SetDefaultColor(Color.RED);

plot CloseLine = closePrice;
CloseLine.SetDefaultColor(Color.YELLOW);

# Define price range conditions for labels
def sellCondition = (positiveWeek and currClose > closePrice and currClose <= highPrice) or
(negativeWeek and currClose > openPrice and currClose <= highPrice);

def buyCondition = (positiveWeek and currClose >= lowPrice and currClose < openPrice) or
(negativeWeek and currClose >= lowPrice and currClose < closePrice);

# Add Labels for trading signals
AddLabel(sellCondition, "Sell Press-WK", Color.RED);
AddLabel(buyCondition, "Buy Press-WK", Color.GREEN);

# Conditions for extreme price movements
def extremeUpCondition = currClose > highPrice;
def extremeDownCondition = currClose < lowPrice;

# Add Labels for extreme conditions
AddLabel(extremeUpCondition, "2U-W", Color.LimE);
AddLabel(extremeDownCondition, "2D-W", Color.MAGENTA);
 
Last edited by a moderator:
Greetings and Happy new month!
I have a new study inquiry - with an AI developed study.


The study draws lines for the OHLC on a defined time frame ( in the screenshot- the weekly is set).
The goal is to inquire if Clouds can be added as seen ( in between the High /Low and Open/Close).

The idea is to identify where there was buyer/seller pressure in any given time frame.
The study can be displaced ( in this example, it is ) and has some labels as well.
Thank you to the moderators and organizers of this site/page.

Here is the code :
Ruby:
# Define study parameters
input aggregationPeriod = AggregationPeriod.WEEK; # Set aggregation period to WEEK
input displacement = 1; # Set displacement to 1 to target the last completed week

# Calculate OHLC with displacement for the previous week
def openPrice = open(period = aggregationPeriod)[displacement];
def highPrice = high(period = aggregationPeriod)[displacement];
def lowPrice = low(period = aggregationPeriod)[displacement];
def closePrice = close(period = aggregationPeriod)[displacement];

# Determine if the previous week closed positively
def positiveWeek = closePrice > openPrice;
def negativeWeek = closePrice < openPrice;

# Current price retrieval (current close price)
def currClose = close;

# Plot OHLC lines
plot OpenLine = openPrice;
OpenLine.SetDefaultColor(Color.CYAN);

plot HighLine = highPrice;
HighLine.SetDefaultColor(Color.GREEN);

plot LowLine = lowPrice;
LowLine.SetDefaultColor(Color.RED);

plot CloseLine = closePrice;
CloseLine.SetDefaultColor(Color.YELLOW);

# Define price range conditions for labels
def sellCondition = (positiveWeek and currClose > closePrice and currClose <= highPrice) or
(negativeWeek and currClose > openPrice and currClose <= highPrice);

def buyCondition = (positiveWeek and currClose >= lowPrice and currClose < openPrice) or
(negativeWeek and currClose >= lowPrice and currClose < closePrice);

# Add Labels for trading signals
AddLabel(sellCondition, "Sell Press-WK", Color.RED);
AddLabel(buyCondition, "Buy Press-WK", Color.GREEN);

# Conditions for extreme price movements
def extremeUpCondition = currClose > highPrice;
def extremeDownCondition = currClose < lowPrice;

# Add Labels for extreme conditions
AddLabel(extremeUpCondition, "2U-W", Color.LimE);
AddLabel(extremeDownCondition, "2D-W", Color.MAGENTA);

next time, separate your rules into 2 separate statements.
don't write them combined like this, it's confusing
( in between the High /Low and Open/Close).

based on the picture, i assumed these rules and made this,

should have said,
between high and highest of open and close
between low and lowest of open and close

Code:
#chat246_ohlc_clouds

#https://usethinkscript.com/threads/chatgpt-bard-other-ai-scripts-which-cant-be-used-in-thinkorswim.13822/page-13#post-141165

def na = double.nan;
def bn = barnumber();

# Define study parameters
input aggregationPeriod = AggregationPeriod.WEEK; # Set aggregation period to WEEK
input displacement = 1; # Set displacement to 1 to target the last completed week

# Calculate OHLC with displacement for the previous week
def openPrice = open(period = aggregationPeriod)[displacement];
def highPrice = high(period = aggregationPeriod)[displacement];
def lowPrice = low(period = aggregationPeriod)[displacement];
def closePrice = close(period = aggregationPeriod)[displacement];

# Determine if the previous week closed positively
def positiveWeek = closePrice > openPrice;
def negativeWeek = closePrice < openPrice;

# Current price retrieval (current close price)
def currClose = close;


# Plot OHLC lines
plot OpenLine = openPrice;
OpenLine.SetDefaultColor(Color.CYAN);
openline.SetPaintingStrategy(PaintingStrategy.HORIZONTAL);

plot HighLine = highPrice;
HighLine.SetDefaultColor(Color.GREEN);
highline.SetPaintingStrategy(PaintingStrategy.HORIZONTAL);

plot LowLine = lowPrice;
LowLine.SetDefaultColor(Color.RED);
lowline.SetPaintingStrategy(PaintingStrategy.HORIZONTAL);

plot CloseLine = closePrice;
CloseLine.SetDefaultColor(Color.YELLOW);
closeline.SetPaintingStrategy(PaintingStrategy.HORIZONTAL);

def bodytop = max(openline, closeline);
def bodybot = min(openline, closeline);

input clouds = yes;
def clduppertop = if clouds then highline else na;
def cldlowertop = if clouds then bodybot else na;

addcloud(clduppertop, bodytop, color.red);
addcloud(cldlowertop, lowline, color.green);


# Define price range conditions for labels
def sellCondition = (positiveWeek and currClose > closePrice and currClose <= highPrice) or
(negativeWeek and currClose > openPrice and currClose <= highPrice);

def buyCondition = (positiveWeek and currClose >= lowPrice and currClose < openPrice) or
(negativeWeek and currClose >= lowPrice and currClose < closePrice);

# Add Labels for trading signals
AddLabel(sellCondition, "Sell Press-WK", Color.RED);
AddLabel(buyCondition, "Buy Press-WK", Color.GREEN);

# Conditions for extreme price movements
def extremeUpCondition = currClose > highPrice;
def extremeDownCondition = currClose < lowPrice;

# Add Labels for extreme conditions
AddLabel(extremeUpCondition, "2U-W", Color.LimE);
AddLabel(extremeDownCondition, "2D-W", Color.MAGENTA);
#
Good Day Halcyonguy! Thank you for the coding of this - my sincere apologies for the lack of clarity in my request. Pease have a great evening

 
Hello, can someone help fix the syntax error for this script below please.

declare lower;

input BigTradesThreshold = 25000;
input PositiveBrush = Color.DARK_GREEN;
input NegativeBrush = Color.DARK_RED;
input IntensePositiveBrush = Color.LIME;
input IntenseNegativeBrush = Color.RED;

def barTotal = 0.0;
def barDelta = 0.0;
def barMaxDelta = 1.0;
def barMinDelta = -1.0;
def barOpenTime = 0.0;
def volPerSecond = 0.0;
def deltaPer = 0.0;
def deltaIntense = 0.0;
def deltaShaved = 0.0;

def isNewBar = GetTime() != GetTime()[1];
if (isNewBar) {
barTotal = 0;
barDelta = 0;
barMaxDelta = 1;
barMinDelta = -1;
barOpenTime = GetTime();
}

barTotal = barTotal + volume;
barDelta = if close >= ask then barDelta + volume else if close <= bid then barDelta - volume else barDelta;
barMaxDelta = Max(barMaxDelta, barDelta);
barMinDelta = Min(barMinDelta, barDelta);

def candleSeconds = SecondsFromTime(barOpenTime);
if (candleSeconds == 0) {
candleSeconds = 1;
}

volPerSecond = barTotal / candleSeconds;
deltaPer = if barDelta > 0 then barDelta / barMaxDelta else barDelta / barMinDelta;
deltaIntense = AbsValue((barDelta * deltaPer) * volPerSecond);
deltaShaved = barDelta * deltaPer;

plot DeltaIntensity = AbsValue(deltaShaved);
DeltaIntensity.SetPaintingStrategy(PaintingStrategy.HISTOGRAM);

if (barDelta > 0) {
if (deltaIntense > BigTradesThreshold) {
DeltaIntensity.SetDefaultColor(IntensePositiveBrush);
} else {
DeltaIntensity.SetDefaultColor(PositiveBrush);
}
} else {
if (deltaIntense > BigTradesThreshold) {
DeltaIntensity.SetDefaultColor(IntenseNegativeBrush);
} else {
DeltaIntensity.SetDefaultColor(NegativeBrush);
}
}

reply to 248

this seems to be a chatgpt output, everything is wrong.
so it is hard to guess what this should be doing.
next time, tell us what the code is supposed to do and where you read about it.


can't determine data during a bar. can't read x seconds into a bar and read data. smallest time period is 1 minute.

can't set colors to a variable
input PositiveBrush = Color.DARK_GREEN;

this will always be true
def isNewBar = GetTime() != GetTime()[1];
can't determine data during a bar

when using variables in a if-then with multiple sections, don't assign a value when defining them.
def barTotal = 0.0;
def barDelta = 0.0;

missing else if , else

can't plot within if-then, can't set a color within if-then

comparing volume to 1 ?? or itself
barMaxDelta = Max(barMaxDelta, barDelta);


--------------

i deleted a lot, made some guesses, and came up with this...

Code:
#chat248_fix

#https://usethinkscript.com/threads/chatgpt-bard-other-ai-scripts-which-cant-be-used-in-thinkorswim.13822/page-13#post-141992
#donbashk
##248
#Hello, can someone help fix the syntax error for this script below please.

declare lower;

def na = double.nan;
def bn = barnumber();

input BigTradesThreshold = 25000;

def AskPrice = if bn == 1 then 0
 else if isnan(close(priceType = PriceType.ASK)) then askprice[1]
 else close(priceType = PriceType.ASK);

def bidPrice = if bn == 1 then 0
 else if isnan(close(priceType = PriceType.bid)) then bidprice[1]
 else close(priceType = PriceType.bid);

def barTotal = if bn == 1 then volume else barTotal[1] + volume;

def barDelta = if bn == 1 then 0
 else if close >= askprice then barDelta[1] + volume
 else if close <= bidprice then barDelta[1] - volume
 else barDelta[1];

def barMaxDelta = Max(barMaxDelta[1], barDelta);
def barMinDelta = Min(barMinDelta[1], barDelta);

def deltaPer = if barDelta > 0 then barDelta / barMaxDelta else barDelta / barMinDelta;

def deltaShaved = barDelta * deltaPer;

plot DeltaIntensity = AbsValue(deltaShaved);
DeltaIntensity.SetPaintingStrategy(PaintingStrategy.HISTOGRAM);

DeltaIntensity.AssignValueColor(
    if barDelta > 0 then
      if deltaIntensity > BigTradesThreshold then Color.LIME else Color.DARK_GREEN
       else
      if deltaIntensity > BigTradesThreshold then  Color.RED else Color.DARK_RED);


#----------------------------
input test1 = no;
addchartbubble(test1,0,
askprice + " A\n" +
bidprice + " B\n" +
barDelta + "\n" +
deltaShaved
, color.yellow, no);
#
 

Attachments

  • img1.JPG
    img1.JPG
    159.2 KB · Views: 115
Before anyone says anything, I am looking for specifically the D aggregation. I wish to make a label that, if the market is currently trading, then the label looks for the last complete bar and calculates the halfway point of that bar - as a stop. If the market is currently not trading, then the label makes the calculation using the current bar, i.e. the last complete bar. But I can't seem to find a way to check if the market is currently open on the D aggregation. Any suggestions? This is what I have so far (yes GPT cooked it up).

# Check if the market is open
def isMarketOpen = if SecondsFromTime(0930) >= 0 and SecondsTillTime(1600) > 0 then 1 else 0;

# Calculate the midpoint of the appropriate candle based on market status
def midpoint = if isMarketOpen then Round((high[1] + low[1]) / 2, 2) else Round((high + low) / 2);


# Calculate the percentage difference between the close and the midpoint, using the appropriate candle based on market status
def percentDifference = if isMarketOpen then 100 * AbsValue(close[1] - midpoint) / midpoint else 100 * AbsValue(close - midpoint) / midpoint;


# Add a label to the chart that displays the midpoint and the absolute percentage difference
AddLabel(yes, "Stop: " + AsPrice(midpoint) + " (" + AsPercent(percentDifference / 100) + ")", Color.CURRENT);
 
Hello,

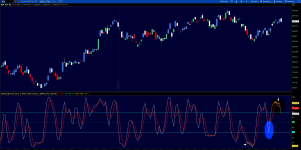
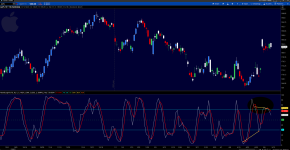
I have came across this post, https://usethinkscript.com/threads/...ivergence-as-picture-below.17589/#post-136165 , and since I have no clue how to code, I had chat switch it to Stochastic Full, you will see the code below with some weird things I did myself. Now what the problem is...After the cycle above Overbought(OB) or below Oversold (OS) the code does not move to the next high or low, I would like if that bottom line had moved to the blue area, I want to see it plot from the highs or lows of %K, (black area) it seems to be plotting off %D, this is the Russell (RUT) and on AAPL see how far it is away from %K highs, if you will adjust this it would be great.

P.S
MoeBettaBlues
I know you are looking at this code like what in the world is this, but we make work, how we know how and chat only get so far...smile !


declare lower;


input over_bought = 70;
input over_sold = 30;
input K_Period = 5;
input D_Period = 3;
input priceH = high;
input priceL = low;
input priceC = close;
input slowing_period = 2;
input averageType = AverageType.SIMPLE;
input showBreakoutSignals = {default "No", "On FullK", "On FullD", "On FullK & FullD"};

def lowest_k = Lowest(priceL, K_Period);
def c1 = priceC - lowest_k;
def c2 = Highest(priceH, K_Period) - lowest_k;
def FastK = if c2 != 0 then c1 / c2 * 100 else 0;

plot FullK = MovingAverage(averageType, FastK, slowing_period);
plot FullD = MovingAverage(averageType, FullK, D_Period);

plot OverBought = over_bought;
plot OverSold = over_sold;


def upK = FullK crosses above OverSold;
def upD = FullD crosses above OverSold;
def downK = FullK crosses below OverBought;
def downD = FullD crosses below OverBought;

FullK.SetDefaultColor(Color.WHITE);
FullD.SetDefaultColor(Color.RED);
FullD.SetLineWeight(2);
OverBought.SetDefaultColor(GetColor(1));
OverSold.SetDefaultColor(GetColor(1));

# Arrows when %K crosses above %D and is above the OVERSOLD line

plot ArrowUp = if FullK crosses FullD and FullK then FullD else Double.NaN;

ArrowUp.SetPaintingStrategy(PaintingStrategy.ARROW_UP);
ArrowUp.SetDefaultColor(Color.UPTICK);
ArrowUp.SetLineWeight(2);

plot ZeroLine = 50;

#__________________#______________________________#_________________________


def c = close;
def h = high;
def l = low;

def highest_high = Highest(h, k_period);
def lowest_low = Lowest(l, k_period);
def fast_k = if highest_high != lowest_low then (c - lowest_low) / (highest_high - lowest_low) * 100 else 0;
def slow_k = ExpAverage(fast_k, slowing_period);
def slow_d = ExpAverage(slow_k, d_period);


def bar = BarNumber();
def Currh = if slow_k > OverBought then fold i = 1 to Floor(k_period / 2) with p = 1 while p do slow_k > getValue(slow_k, -i) else 0;
def CurrPivotH = if (bar > k_period and slow_k == highest(slow_k, Floor(k_period/2)) and Currh) then slow_k else double.NaN;
def Currl = if slow_k < OverSold then fold j = 1 to Floor(k_period / 2) with q = 1 while q do slow_k < getValue(slow_k, -j) else 0;
def CurrPivotL = if (bar > k_period and slow_k == lowest(slow_k, Floor(k_period/2)) and Currl) then slow_k else double.NaN;
def CurrPHBar = if !isNaN(CurrPivotH) then bar else CurrPHBar[1];
def CurrPLBar = if !isNaN(CurrPivotL) then bar else CurrPLBar[1];
def PHpoint = if !isNaN(CurrPivotH) then CurrPivotH else PHpoint[1];
def priorPHBar = if PHpoint != PHpoint[1] then CurrPHBar[1] else priorPHBar[1];
def PLpoint = if !isNaN(CurrPivotL) then CurrPivotL else PLpoint[1];
def priorPLBar = if PLpoint != PLpoint[1] then CurrPLBar[1] else priorPLBar[1];
def HighPivots = bar >= highestAll(priorPHBar);
def LowPivots = bar >= highestAll(priorPLBar);
def pivotHigh = if HighPivots then CurrPivotH else double.NaN;
plot PlotHline = pivotHigh;
PlotHline.enableApproximation();
PlotHline.SetDefaultColor(GetColor(7));
PlotHline.SetStyle(Curve.Short_DASH);
plot pivotLow = if LowPivots then CurrPivotL else double.NaN;
pivotLow.enableApproximation();
pivotLow.SetDefaultColor(GetColor(7));
pivotLow.SetStyle(Curve.Short_DASH);
plot PivotDot = if !isNaN(pivotHigh) then pivotHigh else if !isNaN(pivotLow) then pivotLow else double.NaN;
pivotDot.SetDefaultColor(GetColor(7));
pivotDot.SetPaintingStrategy(PaintingStrategy.POINTS);
pivotDot.SetLineWeight(3);
# End Code Stochastic Full with Divergence
 

Attachments

  • RUT.png
    RUT.png
    252.6 KB · Views: 114
  • AAPL.png
    AAPL.png
    271.2 KB · Views: 116
plot Data = close;

input ticks = 50; # Number of ticks above and below the current price

input priceStep = 1.0; # Step between price levels


# Define colors

defineGlobalColor("Buyers", Color.BLUE);

defineGlobalColor("Sellers", Color.RED);

defineGlobalColor("DeltaPositive", Color.GREEN);

defineGlobalColor("DeltaNegative", Color.RED);


# Calculate the current price

def currentPrice = close;


# Manually add labels for the current price level

AddLabel(yes, "Current Price: " + AsText(currentPrice), Color.YELLOW);


# Price levels above the current price

def priceLevel1 = currentPrice + 1 * priceStep;

def bidVolume1 = if close >= priceLevel1 then volume else 0;

def askVolume1 = if close < priceLevel1 then volume else 0;

def deltaVolume1 = bidVolume1 - askVolume1;

AddLabel(yes, "Price: " + AsText(priceLevel1) +

" | Bids: " + AsText(bidVolume1) +

" | Asks: " + AsText(askVolume1) +

" | Delta: " + AsText(deltaVolume1),

if deltaVolume1 >= 0 then GlobalColor("DeltaPositive") else GlobalColor("DeltaNegative"));


def priceLevel2 = currentPrice + 2 * priceStep;

def bidVolume2 = if close >= priceLevel2 then volume else 0;

def askVolume2 = if close < priceLevel2 then volume else 0;

def deltaVolume2 = bidVolume2 - askVolume2;

AddLabel(yes, "Price: " + AsText(priceLevel2) +

" | Bids: " + AsText(bidVolume2) +

" | Asks: " + AsText(askVolume2) +

" | Delta: " + AsText(deltaVolume2),

if deltaVolume2 >= 0 then GlobalColor("DeltaPositive") else GlobalColor("DeltaNegative"));


def priceLevel3 = currentPrice + 3 * priceStep;

def bidVolume3 = if close >= priceLevel3 then volume else 0;

def askVolume3 = if close < priceLevel3 then volume else 0;

def deltaVolume3 = bidVolume3 - askVolume3;

AddLabel(yes, "Price: " + AsText(priceLevel3) +

" | Bids: " + AsText(bidVolume3) +

" | Asks: " + AsText(askVolume3) +

" | Delta: " + AsText(deltaVolume3),

if deltaVolume3 >= 0 then GlobalColor("DeltaPositive") else GlobalColor("DeltaNegative"));


def priceLevel4 = currentPrice + 4 * priceStep;

def bidVolume4 = if close >= priceLevel4 then volume else 0;

def askVolume4 = if close < priceLevel4 then volume else 0;

def deltaVolume4 = bidVolume4 - askVolume4;

AddLabel(yes, "Price: " + AsText(priceLevel4) +

" | Bids: " + AsText(bidVolume4) +

" | Asks: " + AsText(askVolume4) +

" | Delta: " + AsText(deltaVolume4),

if deltaVolume4 >= 0 then GlobalColor("DeltaPositive") else GlobalColor("DeltaNegative"));


def priceLevel5 = currentPrice + 5 * priceStep;

def bidVolume5 = if close >= priceLevel5 then volume else 0;

def askVolume5 = if close < priceLevel5 then volume else 0;

def deltaVolume5 = bidVolume5 - askVolume5;

AddLabel(yes, "Price: " + AsText(priceLevel5) +

" | Bids: " + AsText(bidVolume5) +

" | Asks: " + AsText(askVolume5) +

" | Delta: " + AsText(deltaVolume5),

if deltaVolume5 >= 0 then GlobalColor("DeltaPositive") else GlobalColor("DeltaNegative"));


# Price levels below the current price

def priceLevel_1 = currentPrice - 1 * priceStep;

def bidVolume_1 = if close >= priceLevel_1 then volume else 0;

def askVolume_1 = if close < priceLevel_1 then volume else 0;

def deltaVolume_1 = bidVolume_1 - askVolume_1;

AddLabel(yes, "Price: " + AsText(priceLevel_1) +

" | Bids: " + AsText(bidVolume_1) +

" | Asks: " + AsText(askVolume_1) +

" | Delta: " + AsText(deltaVolume_1),

if deltaVolume_1 >= 0 then GlobalColor("DeltaPositive") else GlobalColor("DeltaNegative"));


def priceLevel_2 = currentPrice - 2 * priceStep;

def bidVolume_2 = if close >= priceLevel_2 then volume else 0;

def askVolume_2 = if close < priceLevel_2 then volume else 0;

def deltaVolume_2 = bidVolume_2 - askVolume_2;

AddLabel(yes, "Price: " + AsText(priceLevel_2) +

" | Bids: " + AsText(bidVolume_2) +

" | Asks: " + AsText(askVolume_2) +

" | Delta: " + AsText(deltaVolume_2),

if deltaVolume_2 >= 0 then GlobalColor("DeltaPositive") else GlobalColor("DeltaNegative"));


def priceLevel_3 = currentPrice - 3 * priceStep;

def bidVolume_3 = if close >= priceLevel_3 then volume else 0;

def askVolume_3 = if close < priceLevel_3 then volume else 0;

def deltaVolume_3 = bidVolume_3 - askVolume_3;

AddLabel(yes, "Price: " + AsText(priceLevel_3) +

" | Bids: " + AsText(bidVolume_3) +

" | Asks: " + AsText(askVolume_3) +

" | Delta: " + AsText(deltaVolume_3),

if deltaVolume_3 >= 0 then GlobalColor("DeltaPositive") else GlobalColor("DeltaNegative"));


def priceLevel_4 = currentPrice - 4 * priceStep;

def bidVolume_4 = if close >= priceLevel_4 then volume else 0;

def askVolume_4 = if close < priceLevel_4 then volume else 0;

def deltaVolume_4 = bidVolume_4 - askVolume_4;

AddLabel(yes, "Price: " + AsText(priceLevel_4) +

" | Bids: " + AsText(bidVolume_4) +

" | Asks: " + AsText(askVolume_4) +

" | Delta: " + AsText(deltaVolume_4),

if deltaVolume_4 >= 0 then GlobalColor("DeltaPositive") else GlobalColor("DeltaNegative"));


def priceLevel_5 = currentPrice - 5 * priceStep;

def bidVolume_5 = if close >= priceLevel_5 then volume else 0;

def askVolume_5 = if close < priceLevel_5 then volume else 0;

def deltaVolume_5 = bidVolume_5 - askVolume_5;

AddLabel(yes, "Price: " + AsText(priceLevel_5) +

" | Bids: " + AsText(bidVolume_5) +

" | Asks: " + AsText(askVolume_5) +

" | Delta: " + AsText(deltaVolume_5),

if deltaVolume_5 >= 0 then GlobalColor("DeltaPositive") else GlobalColor("DeltaNegative"));
 
New to writing basic scripts and could use some input. Trying to plot RTH previous days average price ((high-low)/2) plotted on the current trading day. Any help would be appreciated.

# Previous Day Avg

input aggregationPeriod = AggregationPeriod.DAY;
def pdavg = (high - low) / 2 (period = aggregationPeriod)[1];


plot Data = pdavg;
 
Before anyone says anything, I am looking for specifically the D aggregation. I wish to make a label that, if the market is currently trading, then the label looks for the last complete bar and calculates the halfway point of that bar - as a stop. If the market is currently not trading, then the label makes the calculation using the current bar, i.e. the last complete bar. But I can't seem to find a way to check if the market is currently open on the D aggregation. Any suggestions? This is what I have so far (yes GPT cooked it up).

# Check if the market is open
def isMarketOpen = if SecondsFromTime(0930) >= 0 and SecondsTillTime(1600) > 0 then 1 else 0;

# Calculate the midpoint of the appropriate candle based on market status
def midpoint = if isMarketOpen then Round((high[1] + low[1]) / 2, 2) else Round((high + low) / 2);


# Calculate the percentage difference between the close and the midpoint, using the appropriate candle based on market status
def percentDifference = if isMarketOpen then 100 * AbsValue(close[1] - midpoint) / midpoint else 100 * AbsValue(close - midpoint) / midpoint;


# Add a label to the chart that displays the midpoint and the absolute percentage difference
AddLabel(yes, "Stop: " + AsPrice(midpoint) + " (" + AsPercent(percentDifference / 100) + ")", Color.CURRENT);

reply to #251
if using day bars, you can't read a time less than day.

here is something similar to yours.
it draws a line and a label
set chart to day

Code:
#chat251_day_mid_01_day

#https://usethinkscript.com/threads/chatgpt-bard-other-ai-scripts-which-cant-be-used-in-thinkorswim.13822/page-13#post-141656

def na = double.nan;
def bn = barnumber();

#def lastbn = HighestAll(If(IsNaN(close), 0, bn));
#def lastbar = if (bn == lastbn) then 1 else 0;
def lastbar = !isnan(close[0]) and isnan(close[-1]);
#def last_close = highestall(if lastbar then close else 0);

input bars_before_last_bar = 1;
input bars_after = 3;
def cls = close;

def t1 = isNaN(cls[-(bars_before_last_bar+1)]);
def t2 = !isNaN(cls[bars_after - 0]);
def linerng = t1 and t2;

def t3 = !isNaN(cls[-(bars_before_last_bar+0)]);
def midbar = t1 and t3;

def mid = if bn == 1 then 0
#  else if midbar then (((high - low)/2)+low)
  else if midbar then round((high + low)/2,2)
  else if linerng then mid[1]
  else 0;

input mid_line = yes;
plot zl = if mid_line and mid > 0 then mid else na;

# Calculate the percentage difference between the close and the midpoint, using the appropriate candle based on market status
def perDiff = (100 * AbsValue(close[0] - mid) / mid);

# Add a label to the chart that displays the midpoint and the absolute percentage difference
AddLabel(yes, "Stop: " + AsPrice(mid) + " (" + AsPercent(perDiff / 100) + ")", Color.yellow);

#------------------------------

input test_bubbles = no;
addchartbubble(test_bubbles, 36,
t1 + "\n" +
t2 + "\n" +
mid
,(if linerng then color.yellow else color.gray), no);

#addchartbubble(test1 and midbar, low,
addchartbubble(test_bubbles, low,
high + "\n" +
mid + "\n" +
low + "\n" +
close + "\n" +
perdiff
, color.yellow, no);
#
 
New to writing basic scripts and could use some input. Trying to plot RTH previous days average price ((high-low)/2) plotted on the current trading day. Any help would be appreciated.

# Previous Day Avg

input aggregationPeriod = AggregationPeriod.DAY;
def pdavg = (high - low) / 2 (period = aggregationPeriod)[1];


plot Data = pdavg;

reply to #254
here you go
have to apply 2nd aggregation to each price parameter, not on the end of a formula
(h+l)/2 is the avg formula


Code:
#prev_day_avg_pr

input agg = AggregationPeriod.DAY;
def o = open(period = agg);
def h = high(period = agg);
def l = low(period = agg);
def c = close(period = agg);

def pdavg = (h[1] + l[1]) / 2;

plot z = pdavg;
z.SetPaintingStrategy(PaintingStrategy.HORIZONTAL);
z.SetDefaultColor(Color.yellow);
#z.setlineweight(1);
z.hidebubble();
#
 
Hi Everyone,
I'm new to programming and need some assitance
I have a simple crossover moving average strategy with buy and sell signals. I was attempting to add a take profit bubble when price moved +/- x but i get multiple take profit bubbles until the condition is no longer valid. can someone help me only display the first take profit bubble? Any help is greatly appreciated

# Moving Average Crossover Strategy with Buy and Sell Signals

# Define input parameters

input fastLength = 10;

input slowLength = 100;

input price = close;

input takeProfit = 0.75; # User-defined take profit input

# Define moving average type options

input fastMAType = {default SMA, EMA, WMA, HMA, Wilders};

input slowMAType = {default SMA, EMA, WMA, HMA, Wilders};

# Calculate fast moving average based on user selection

def fastMA = if fastMAType == fastMAType.SMA then Average(price, fastLength)

else if fastMAType == fastMAType.EMA then ExpAverage(price, fastLength)

else if fastMAType == fastMAType.WMA then WMA(price, fastLength)

else if fastMAType == fastMAType.HMA then HullMovingAvg(price, fastLength)

else WildersAverage(price, fastLength);

# Calculate slow moving average based on user selection

def slowMA = if slowMAType == slowMAType.SMA then Average(price, slowLength)

else if slowMAType == slowMAType.EMA then ExpAverage(price, slowLength)

else if slowMAType == slowMAType.WMA then WMA(price, slowLength)

else if slowMAType == slowMAType.HMA then HullMovingAvg(price, slowLength)

else WildersAverage(price, slowLength);

# Generate crossover signals

def buySignal = Crosses(fastMA, slowMA, CrossingDirection.ABOVE);

def sellSignal = Crosses(fastMA, slowMA, CrossingDirection.BELOW);

# Plot moving averages

plot FastMovingAverage = fastMA;

FastMovingAverage.SetDefaultColor(Color.CYAN);

FastMovingAverage.SetLineWeight(2);

plot SlowMovingAverage = slowMA;

SlowMovingAverage.SetDefaultColor(Color.MAGENTA);

SlowMovingAverage.SetLineWeight(2);

# Add vertical lines for buy and sell signals

AddVerticalLine(buySignal, "Buy", Color.GREEN);

AddVerticalLine(sellSignal, "Sell", Color.RED);

# Variables to track entry prices and take profit targets

def buyPrice = if buySignal then price else buyPrice[1];

def sellPrice = if sellSignal then price else sellPrice[1];

def buyTarget = buyPrice + takeProfit;

def sellTarget = sellPrice - takeProfit;

# Display take profit bubbles

def buyTakeProfitReached = (price >= buyTarget) and (buyPrice != 0);

def sellTakeProfitReached = (price <= sellTarget) and (sellPrice != 0);

AddChartBubble(buyTakeProfitReached, price, "Take Profit", Color.GREEN, yes);

AddChartBubble(sellTakeProfitReached, price, "Take Profit", Color.RED, no);
replace a > with crosses

Code:
def na = double.nan;
def bn = barnumber();

input fastLength = 10;
input slowLength = 100;
input price = close;
input takeProfit = 0.75; # User-defined take profit input

# Define moving average type options
input fastMAType = {default SMA, EMA, WMA, HMA, Wilders};
input slowMAType = {default SMA, EMA, WMA, HMA, Wilders};

# Calculate fast moving average based on user selection
def fastMA = if fastMAType == fastMAType.SMA then Average(price, fastLength)
 else if fastMAType == fastMAType.EMA then ExpAverage(price, fastLength)
 else if fastMAType == fastMAType.WMA then WMA(price, fastLength)
 else if fastMAType == fastMAType.HMA then HullMovingAvg(price, fastLength)
 else WildersAverage(price, fastLength);

# Calculate slow moving average based on user selection
def slowMA = if slowMAType == slowMAType.SMA then Average(price, slowLength)
 else if slowMAType == slowMAType.EMA then ExpAverage(price, slowLength)
 else if slowMAType == slowMAType.WMA then WMA(price, slowLength)
 else if slowMAType == slowMAType.HMA then HullMovingAvg(price, slowLength)
 else WildersAverage(price, slowLength);

# Generate crossover signals
def longSignal = Crosses(fastMA, slowMA, CrossingDirection.ABOVE);
def shortSignal = Crosses(fastMA, slowMA, CrossingDirection.BELOW);

# Plot moving averages
plot FastMovingAverage = fastMA;
FastMovingAverage.SetDefaultColor(Color.CYAN);
FastMovingAverage.SetLineWeight(2);

plot SlowMovingAverage = slowMA;
SlowMovingAverage.SetDefaultColor(Color.MAGENTA);
SlowMovingAverage.SetLineWeight(2);

# Add vertical lines for buy and sell signals
AddVerticalLine(longSignal, "Go Long", Color.GREEN);
AddVerticalLine(shortSignal, "Go Short", Color.RED);

# Variables to track entry prices and take profit targets
def longPrice = if longSignal then price else longPrice[1];
def shortPrice = if shortSignal then price else shortPrice[1];
def longTarget = longPrice + takeProfit;
def shortTarget = shortPrice - takeProfit;

# Display take profit bubbles
#def buyTakeProfitReached = (price >= buyTarget) and (buyPrice != 0);
#def sellTakeProfitReached = (price <= sellTarget) and (sellPrice != 0);
def longTakeProfitReached = (price crosses above longTarget);
def shortTakeProfitReached = (price crosses below shortTarget);

AddChartBubble(longTakeProfitReached, price, "Take Profit", Color.GREEN, yes);
AddChartBubble(shortTakeProfitReached, price, "Take Profit", Color.RED, no);
#
 
Please fix these scripts for divergence detection. Thanks.

Code:
declare lower;

input prd = 5;
input source = close;
input searchdiv = "Regular";
input showindis = "Full";
input showlimit = 1;
input maxpp = 10;
input maxbars = 100;
input shownum = yes;
input showlast = no;
input dontconfirm = no;
input showlines = yes;
input showpivot = no;
input calcmacd = yes;
input calcmacda = yes;
input calcrsi = yes;
input calcstoc = yes;
input calccci = yes;
input calcmom = yes;
input calcobv = yes;
input calcvwmacd = yes;
input calccmf = yes;
input calcmfi = yes;
input calcext = no;
input externalindi = close;

# Define color constants
DefineGlobalColor("PositiveRegDiv", CreateColor(255, 255, 0)); # Yellow
DefineGlobalColor("NegativeRegDiv", CreateColor(0, 0, 255)); # Blue
DefineGlobalColor("PositiveHidDiv", CreateColor(0, 255, 0)); # Green
DefineGlobalColor("NegativeHidDiv", CreateColor(255, 0, 0)); # Red
DefineGlobalColor("PosDivText", CreateColor(0, 0, 0)); # Black
DefineGlobalColor("NegDivText", CreateColor(255, 255, 255)); # White

input reg_div_l_style_ = Curve.MEDIUM_DASH;
input hid_div_l_style_ = Curve.SHORT_DASH;
input reg_div_l_width = 2;
input hid_div_l_width = 1;
input showmas = no;

# Moving Averages
def cma1col = Color.GREEN;
def cma2col = Color.RED;

# Moving Averages
plot ma50 = if showmas then Average(close, 50) else Double.NaN;
ma50.SetDefaultColor(cma1col);

plot ma200 = if showmas then Average(close, 200) else Double.NaN;
ma200.SetDefaultColor(cma2col);

# RSI
def rsiValue = if calcrsi then RSI(close, 14) else Double.NaN;

# MACD
def macd = if calcmacd then MACD(close, 12, 26, 9) else Double.NaN;
def macdValue = if calcmacd then macd[1] - macd[2] else Double.NaN;

# Momentum
def moment = if calcmom then Momentum(close, 10) else Double.NaN;

# CCI
def cciValue = if calccci then CCI(close, 10) else Double.NaN;

# OBV
def obvValue = if calcobv then TotalSum(if close > close[1] then volume else if close < close[1] then -volume else 0) else Double.NaN;

# Stochastic
def stkValue = if calcstoc then StochasticSlow(14, 3) else Double.NaN;

# VW MACD
def vwmacd = if calcvwmacd then MovingAverage(AverageType.WILDERS, close, 12) - MovingAverage(AverageType.WILDERS, close, 26) else Double.NaN;

# Chaikin Money Flow
def cmf = if calccmf then ChaikinMoneyFlow(21) else Double.NaN;

# Money Flow Index
def mfi = if calcmfi then MoneyFlowIndex(close, 14) else Double.NaN;

# Pivot Points
def ph = if source == close then high else low;
def pl = if source == close then low else high;

def phValue = if high == Highest(high, prd) then high else Double.NaN;
def plValue = if low == Lowest(low, prd) then low else Double.NaN;

def phPosition = if !IsNaN(phValue) then BarNumber() else Double.NaN;
def plPosition = if !IsNaN(plValue) then BarNumber() else Double.NaN;

# Divergence Detection
def positiveRegular = if !IsNaN(phPosition) then
    (if macdValue > Highest(macdValue[prd], prd) and low < Lowest(low[prd], prd) then 1 else 0)
else 0;

def negativeRegular = if !IsNaN(plPosition) then
    (if macdValue < Lowest(macdValue[prd], prd) and high > Highest(high[prd], prd) then 1 else 0)
else 0;

def positiveHidden = if !IsNaN(phPosition) then
    (if macdValue < Lowest(macdValue[prd], prd) and low > Lowest(low[prd], prd) then 1 else 0)
else 0;

def negativeHidden = if !IsNaN(plPosition) then
    (if macdValue > Highest(macdValue[prd], prd) and high < Highest(high[prd], prd) then 1 else 0)
else 0;

plot PositiveRegularDivergence = positiveRegular;
PositiveRegularDivergence.SetPaintingStrategy(PaintingStrategy.BOOLEAN_ARROW_UP);
PositiveRegularDivergence.SetDefaultColor(GlobalColor("PositiveRegDiv"));

plot NegativeRegularDivergence = negativeRegular;
NegativeRegularDivergence.SetPaintingStrategy(PaintingStrategy.BOOLEAN_ARROW_DOWN);
NegativeRegularDivergence.SetDefaultColor(GlobalColor("NegativeRegDiv"));

plot PositiveHiddenDivergence = positiveHidden;
PositiveHiddenDivergence.SetPaintingStrategy(PaintingStrategy.BOOLEAN_ARROW_UP);
PositiveHiddenDivergence.SetDefaultColor(GlobalColor("PositiveHidDiv"));

plot NegativeHiddenDivergence = negativeHidden;
NegativeHiddenDivergence.SetPaintingStrategy(PaintingStrategy.BOOLEAN_ARROW_DOWN);
NegativeHiddenDivergence.SetDefaultColor(GlobalColor("NegativeHidDiv"));
 
Last edited by a moderator:
I tried to create the code below via ChatGPT and Gemini
but am I getting a debug error:

Code:
Invalid statement: def at 6:1
Invalid statement: def at 7:1

The requirements were simple:

1. Use the high and low price range for the last 45 minutes of regular trading from the previous day

2. Draw a line in green that extends to current day for the high for the time range shown above

3. Draw a line in red that extends to current day for the low for the time range shown above

Code:
# Define user input for the beginning and end times of the previous day's range
input startTime = 1515; # Default start time 3:15 PM
input endTime = 1600;   # Default end time 4:00 PM

# Calculate the previous day's high and low for the specified time range
def prevDayHigh = if GetDay() == GetLastDay() then highest(high(period = "DAY")[startTime..endTime]) else Double.NaN;
def prevDayLow = if GetDay() == GetLastDay() then lowest(low(period = "DAY")[startTime..endTime]) else Double.NaN;

# Plot the previous day's high as a green line extending to the current day
plot HighLine = prevDayHigh;
HighLine.SetDefaultColor(Color.GREEN);
#Change to LONG_DASH for a dashed line if desired
HighLine.SetStyle(Curve.SOLID);
HighLine.SetLineWeight(2);

# Plot the previous day's low as a red line extending to the current day
plot LowLine = prevDayLow;
LowLine.SetDefaultColor(Color.RED);
#Change to LONG_DASH for a dashed line if desired
LowLine.SetStyle(Curve.SOLID);
LowLine.SetLineWeight(2);

Any help appreciated! Thanks!
 
To all usethinkscript.com users: Sharing an interesting ChatGPT based on the following inquiry and request for an algorthym I was creating. It resolved my coding errors with precision and elegance:
I approached it afterward with the following request to see how it would respond to someone new to thinkscript and simply wanted help with his own script:
"Great. appreciate your help once again. I am learning thinkscript. Sometimes I get stuck and am unable to correct an error message, even after numerous attempts. I hope you can perhaps help me to improve my coding skills by outlining in some detail the basic instruction sets and their definitions for becoming more skillful in writing code in thinkscript. Could you perhaps list some basic commands and instructional sets that will be useful and help me get started to be more familiar with the thinkscript language? "

The Chat, openai.com replied in the following manner. With concise precision and excellent tutoring. We are entering a new age of learning, so that a ready computer generated companion is available 24 hours a day for the curious. I am exceedingly optimistic about the future possibilities within the grasp of human evolution. As a much older contributor I can only say, I encourage every young and curious learner to embrace the possibilities of the current age.
https://chatgpt.com/share/ad3ce88e-a9f2-4aca-9a60-a86472129a27
Click the link to see it's reponse.

Best wishes to All ! Sincerely, MagicQuotes
 
Please fix these scripts for divergence detection. Thanks.

Code:
declare lower;

input prd = 5;
input source = close;
input searchdiv = "Regular";
input showindis = "Full";
input showlimit = 1;
input maxpp = 10;
input maxbars = 100;
input shownum = yes;
input showlast = no;
input dontconfirm = no;
input showlines = yes;
input showpivot = no;
input calcmacd = yes;
input calcmacda = yes;
input calcrsi = yes;
input calcstoc = yes;
input calccci = yes;
input calcmom = yes;
input calcobv = yes;
input calcvwmacd = yes;
input calccmf = yes;
input calcmfi = yes;
input calcext = no;
input externalindi = close;

# Define color constants
DefineGlobalColor("PositiveRegDiv", CreateColor(255, 255, 0)); # Yellow
DefineGlobalColor("NegativeRegDiv", CreateColor(0, 0, 255)); # Blue
DefineGlobalColor("PositiveHidDiv", CreateColor(0, 255, 0)); # Green
DefineGlobalColor("NegativeHidDiv", CreateColor(255, 0, 0)); # Red
DefineGlobalColor("PosDivText", CreateColor(0, 0, 0)); # Black
DefineGlobalColor("NegDivText", CreateColor(255, 255, 255)); # White

input reg_div_l_style_ = Curve.MEDIUM_DASH;
input hid_div_l_style_ = Curve.SHORT_DASH;
input reg_div_l_width = 2;
input hid_div_l_width = 1;
input showmas = no;

# Moving Averages
def cma1col = Color.GREEN;
def cma2col = Color.RED;

# Moving Averages
plot ma50 = if showmas then Average(close, 50) else Double.NaN;
ma50.SetDefaultColor(cma1col);

plot ma200 = if showmas then Average(close, 200) else Double.NaN;
ma200.SetDefaultColor(cma2col);

# RSI
def rsiValue = if calcrsi then RSI(close, 14) else Double.NaN;

# MACD
def macd = if calcmacd then MACD(close, 12, 26, 9) else Double.NaN;
def macdValue = if calcmacd then macd[1] - macd[2] else Double.NaN;

# Momentum
def moment = if calcmom then Momentum(close, 10) else Double.NaN;

# CCI
def cciValue = if calccci then CCI(close, 10) else Double.NaN;

# OBV
def obvValue = if calcobv then TotalSum(if close > close[1] then volume else if close < close[1] then -volume else 0) else Double.NaN;

# Stochastic
def stkValue = if calcstoc then StochasticSlow(14, 3) else Double.NaN;

# VW MACD
def vwmacd = if calcvwmacd then MovingAverage(AverageType.WILDERS, close, 12) - MovingAverage(AverageType.WILDERS, close, 26) else Double.NaN;

# Chaikin Money Flow
def cmf = if calccmf then ChaikinMoneyFlow(21) else Double.NaN;

# Money Flow Index
def mfi = if calcmfi then MoneyFlowIndex(close, 14) else Double.NaN;

# Pivot Points
def ph = if source == close then high else low;
def pl = if source == close then low else high;

def phValue = if high == Highest(high, prd) then high else Double.NaN;
def plValue = if low == Lowest(low, prd) then low else Double.NaN;

def phPosition = if !IsNaN(phValue) then BarNumber() else Double.NaN;
def plPosition = if !IsNaN(plValue) then BarNumber() else Double.NaN;

# Divergence Detection
def positiveRegular = if !IsNaN(phPosition) then
    (if macdValue > Highest(macdValue[prd], prd) and low < Lowest(low[prd], prd) then 1 else 0)
else 0;

def negativeRegular = if !IsNaN(plPosition) then
    (if macdValue < Lowest(macdValue[prd], prd) and high > Highest(high[prd], prd) then 1 else 0)
else 0;

def positiveHidden = if !IsNaN(phPosition) then
    (if macdValue < Lowest(macdValue[prd], prd) and low > Lowest(low[prd], prd) then 1 else 0)
else 0;

def negativeHidden = if !IsNaN(plPosition) then
    (if macdValue > Highest(macdValue[prd], prd) and high < Highest(high[prd], prd) then 1 else 0)
else 0;

plot PositiveRegularDivergence = positiveRegular;
PositiveRegularDivergence.SetPaintingStrategy(PaintingStrategy.BOOLEAN_ARROW_UP);
PositiveRegularDivergence.SetDefaultColor(GlobalColor("PositiveRegDiv"));

plot NegativeRegularDivergence = negativeRegular;
NegativeRegularDivergence.SetPaintingStrategy(PaintingStrategy.BOOLEAN_ARROW_DOWN);
NegativeRegularDivergence.SetDefaultColor(GlobalColor("NegativeRegDiv"));

plot PositiveHiddenDivergence = positiveHidden;
PositiveHiddenDivergence.SetPaintingStrategy(PaintingStrategy.BOOLEAN_ARROW_UP);
PositiveHiddenDivergence.SetDefaultColor(GlobalColor("PositiveHidDiv"));

plot NegativeHiddenDivergence = negativeHidden;
NegativeHiddenDivergence.SetPaintingStrategy(PaintingStrategy.BOOLEAN_ARROW_DOWN);
NegativeHiddenDivergence.SetDefaultColor(GlobalColor("NegativeHidDiv"));
please elaborate.
what needs fixing?
what doesn't it do?
what is it supposed to do?
 
re: Scan for First Pullback Since Bullish Cross

I need help scanning for stocks whose 9EMA has crossed above or is greater than the 21MA and whose Stochastic Momentum Index is currently less than 0, but the stochastic index hasn't gone below 0 since the positive 9EMA cross. Below is a picture as an example and below that is the current code I have but I don't think it is working correctly. Any help would be greatly appreciated thank you!

cNqZus9.png


Code:
# Define the lengths for the EMAs
input shortEmaLength = 9;
input longEmaLength = 21;

# Calculate the 9 EMA and 21 EMA
def shortEma = ExpAverage(close, shortEmaLength);
def longEma = ExpAverage(close, longEmaLength);

# Condition to check if 9 EMA is crossing above 21 EMA
def emaCrossAbove = shortEma crosses above longEma;

# Calculate the Stochastic Momentum Index (SMI)
input smiLength = 14;
input kPeriod = 3;
input dPeriod = 3;
input averageType = AverageType.SIMPLE;

def minLow = Lowest(low, smiLength);
def maxHigh = Highest(high, smiLength);
def smi = if (maxHigh - minLow) != 0 then 100 * (close - (minLow + maxHigh) / 2) / ((maxHigh - minLow) / 2) else 0;
def smiK = ExpAverage(smi, kPeriod);
def smiD = ExpAverage(smiK, dPeriod);

# Track the state of SMI and EMA crossover
def lastEmaCrossAbove = CompoundValue(1, if emaCrossAbove then 1 else if smiK < 20 then 0 else lastEmaCrossAbove[10], 1);
def smiBecomingOversold = smiK crosses below 20;

# Condition to check if SMI is becoming oversold for the first time since the crossover
def smiCondition = smiBecomingOversold and lastEmaCrossAbove;

# Create the scan condition combining both conditions
plot scanCondition = smiCondition and emaCrossAbove[10];
 
Last edited by a moderator:

Join useThinkScript to post your question to a community of 21,000+ developers and traders.

Similar threads

Not the exact question you're looking for?

Start a new thread and receive assistance from our community.

87k+ Posts
296 Online
Create Post

Similar threads

Similar threads

The Market Trading Game Changer

Join 2,500+ subscribers inside the useThinkScript VIP Membership Club
  • Exclusive indicators
  • Proven strategies & setups
  • Private Discord community
  • ‘Buy The Dip’ signal alerts
  • Exclusive members-only content
  • Add-ons and resources
  • 1 full year of unlimited support

Frequently Asked Questions

What is useThinkScript?

useThinkScript is the #1 community of stock market investors using indicators and other tools to power their trading strategies. Traders of all skill levels use our forums to learn about scripting and indicators, help each other, and discover new ways to gain an edge in the markets.

How do I get started?

We get it. Our forum can be intimidating, if not overwhelming. With thousands of topics, tens of thousands of posts, our community has created an incredibly deep knowledge base for stock traders. No one can ever exhaust every resource provided on our site.

If you are new, or just looking for guidance, here are some helpful links to get you started.

What are the benefits of VIP Membership?
VIP members get exclusive access to these proven and tested premium indicators: Buy the Dip, Advanced Market Moves 2.0, Take Profit, and Volatility Trading Range. In addition, VIP members get access to over 50 VIP-only custom indicators, add-ons, and strategies, private VIP-only forums, private Discord channel to discuss trades and strategies in real-time, customer support, trade alerts, and much more. Learn all about VIP membership here.
How can I access the premium indicators?
To access the premium indicators, which are plug and play ready, sign up for VIP membership here.
Back
Top