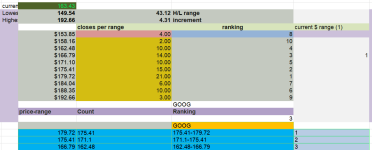
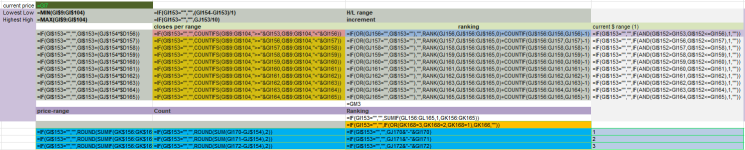
"H/L Top 3 Price Ranges" with # of closes per range, to find long term support and resistance zones.
Hello, I've been trying to get this simple excel set of formulas to become a thinkscript for charting. Most of this script is derived from Chatgpt and the ai cannot fix the incorrect counts either. The problem is all about # of closing counts per range, that are not counted correctly.
Test version listed below: with only 3 ranges, (actually 10 ranges is the goal to further achieve a "top 3 ranges" from the ranges with the most closes.
# this study: 3 Ranges & #of bars that closed within 90 days.
Dividing the timeframes highest close & lowest close, into 3 ranges,
then "count" t/number of bars that closed within each.
ie., range 110-149: 20 bars , 150-159: 40 bars, 160-180: 30 bars .
(Then adding horizontal lines, when it works).
The result provides an indication of chop/congestion price zones, w/support & resistance.
Eventually, when top3 can be added back into it (after the #counting is fixed) :
each range ranked w/t/highest number of closes, becomes a top 3, then only those ranges are plotted into price bubbles (which does work w/chatgpt's provided code, yet not great because t/horizontal lines are not static.)
As a Top 3 range out of 10, this creates a series of 3 strong long term price levels
& t/horizontal range bars update automatically (no drawing required) when the closing counts change.
# Error: the range divisions are always correct whether 1 or 10 ranges.
So the error itself is w/the # of bars within each range. (tested w/fold, nan, compound value, sum and always the wrong # of bars are counted). Either syntax error or a variable is missing.
Oddly,
")
when only 2 ranges are tested over #of days, ie 90.,
then the counts of closing bars per range are correct, and match the candle count: ie., range 1: 30, range 2: 60.
Only when adding the 3rd+ range or using shorter timeframes does the code fall apart.
Hope you can help it might be fun for some of you to see ChatGPT's code, it's easy to read and hopefully the countrange1-countrange3 section can stay that way so other newbies just like me can use it. Yet, a condensed code fold version is fine also. Thanks in advance for your help!!
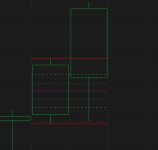
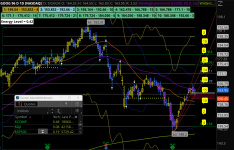
This beta version below works for chart tests.
The chart image displays the 3 ranges as labels, & the price level lines on the chart were drawn, yet the 2nd goal is to have them automatically drawn, from this script.
# Define the lookback period (90 days)
input lookbackPeriod = 90; # Lookback period in days
input levels = 3; # Number of price ranges to divide into
input length = 90; #possibly not needed
# Force the use of daily data for calculations
def aggClose = close(Period = AggregationPeriod.DAY);
# Get the high and low over the lookback period
def highestClose = Highest(aggClose, lookbackPeriod);
def lowestClose = Lowest(aggClose, lookbackPeriod);
# Calculate the range increment
def range = (highestClose - lowestClose);
def increment = range / levels;
#---
# Define Range 1 (lowest range)
def range1Low = lowestClose;
def range1High = range1Low + increment;
# Define Range 2 (second range)
def range2Low = range1High + 0.01; #.01 for boundries between ranges
def range2High = range2Low + increment;
# Define Range 3 (second range)
def range3Low = range2High + 0.01;
def range3High = range3Low + increment;
#---
# Count closing prices within Range 1
def closeInRange1 = if aggClose >= range1Low and aggClose <= range1High then 1 else 0;
def countRange1 = Sum(closeInRange1, lookbackPeriod);
# Count closing prices within Range 2
def closeInRange2 = if aggClose >= range2Low and aggClose <= range2High then 1 else 0;
def countRange2 = Sum(closeInRange2, lookbackPeriod);
# Count closing prices within Range 3
def closeInRange3 = if aggClose >= range3Low and aggClose <= range3High then 1 else 0;
def countRange3 = Sum(closeInRange3, lookbackPeriod);
#---
# Add labels to display the counts
AddLabel(yes, " 1: " + AsText(range1Low) + " - " + AsText(range1High) + " 1: " + countRange1, CreateColor(175, 143, 14));
AddLabel(yes, " 2: " + AsText(range2Low) + " - " + AsText(range2High) + " 2: " + countRange2, CreateColor(127, 196, 203));
AddLabel(yes, " 3: " + AsText(range3Low) + " - " + AsText(range3High) + " 3: " + countRange2, CreateColor(89, 186, 131));
#-------------------------------------------------------------------------------------------
#-------------------------------------------------------------------to add into it------
#--- After the counting is repaired: This section details Ranking for top 3 ranges--- beginning Ranking: with Max defines for the counts (& that code does appear to work, with price bubbles):
# Find the top 3 ranked ranges
#def topRank1 = Max(count1, Max(count2, Max(count3, Max(count4, Max(count5, Max(count6, Max(count7, Max(count8, Max(count9, count10)))))))));
#def topRank2 = Max(If(count1 != topRank1, count1, 0), Max(If(count2 != topRank1, count2, 0), Max(If(count3 != topRank1, count3, 0), Max(If(count4 != topRank1, count4, 0), Max(If(count5 != topRank1, count5, 0), Max(If(count6 != topRank1, count6, 0), Max(If(count7 != topRank1, count7, 0), Max(If(count8 != topRank1, count8, 0), Max(If(count9 != topRank1, count9, 0), If(count10 != topRank1, count10, 0))))))))));
#def topRank3 = Max(If(count1 != topRank1 and count1 != topRank2, count1, 0), Max(If(count2 != topRank1 and count2 != topRank2, count2, 0), Max(If(count3 != topRank1 and count3 != topRank2, count3, 0), Max(If(count4 != topRank1 and count4 != topRank2, count4, 0),
Max(If(count5 != topRank1 and count5 != topRank2, count5, 0), Max(If(count6 != topRank1 and count6 != topRank2, count6, 0), Max(If(count7 != topRank1 and count7 != topRank2, count7, 0), Max(If(count8 != topRank1 and count8 != topRank2, count8, 0), Max(If(count9 != topRank1 and count9 != topRank2, count9, 0), If(count10 != topRank1 and count10 != topRank2, count10, 0))))))))));
#Define the low and high for the top 3 ranked ranges
#def top1Low = if topRank1 == count1 then range1Low else if topRank1 == count2 then range2Low else if topRank1 == count3 then range3Low else if topRank1 == count4 then range4Low else if topRank1 == count5 then range5Low else if topRank1 == count6 then range6Low else if topRank1 == count7 then range7Low else if topRank1 == count8 then range8Low else if topRank1 == count9 then range9Low else range10Low;
#def top1High = if topRank1 == count1 then range1High else if topRank1 == count2 then range2High else if topRank1 == count3 then range3High else if topRank1 == count4 then range4High else if topRank1 == count5 then range5High else if topRank1 == count6 then range6High else if topRank1 == count7 then range7High else if topRank1 == count8 then range8High else if topRank1 == count9 then range9High else range10High;
# Display the top 3 ranked ranges
#AddLabel(yes, "Top Rank 1: " + AsText(top1Low) + " to " + AsText(top1High) + " # " + AsText(topRank1), CreateColor(89, 186, 131));
#AddLabel(yes, "Top Rank 2: Low: " + AsText(top2Low) + " High: " + AsText(top2High) + " # " + AsText(topRank2), CreateColor(175, 143, 14));
#AddLabel(yes, "Top Rank 3: Low: " + AsText(top3Low) + " High: " + AsText(top3High) + " # " + AsText(topRank3), CreateColor(127, 196, 203));
# Plot top 3 ranges as support/resistance lines
#plot Pivot1 = highestClose;
plot Support1 = top1Low;
plot Resistance1 = top1High;
#plot Pivot2 = lowestClose; # Horizontal line
plot Support2 = top2Low;
plot Resistance2 = top2High;
plot Support3 = top3Low;
plot Resistance3 = top3High;
# Formatting lines
#Pivot1.SetDefaultColor(Color.GREEN);
#Pivot1.DefineColor("highestClose", CreateColor(217, 199, 40));
Support1.SetDefaultColor(Color.DARK_GREEN);
Resistance1.SetDefaultColor(Color.DARK_GREEN);
#Pivot2.SetDefaultColor(Color.RED);
Support2.SetDefaultColor(Color.DARK_RED);
Resistance2.SetDefaultColor(Color.DARK_RED);
#Pivot2.SetDefaultColor(Color.BLUE);
#Pivot3.DefineColor("lowestClose", CreateColor(255, 255, 255));
Support3.SetDefaultColor(Color.BLUE);
Resistance3.SetDefaultColor(Color.BLUE);