90% of the members attempting chatGPT scripting; do not provide good detailed specifications.
Members know what end result that they want but lack the ability to tell chatGPT, the step-by-step logic required to code a script to achieve that end result.
This results in chatGPT creating non-working garbage code.
Here is a video on how to successfully have chatGPT create functional scripts.
The above video, explains the basics of providing good specifications to AI which results in better scripts.
repeat this process, looking back at previous formulas and display other variables, to see what is going on.
ps , your variable names add confusion.
preMarketVolume = volume; , this isn't pre market volume, its just volume.
def preMarketVolumeCondition = , not pre market
def currentTime = , this isn't current time, it is a specific time period
close > high15; , this will never be true. high15 is the highest value. close might = the highest, but it can't be greater
limiting a buy/sell time to just 15 minutes in a day, is just silly
def currentTime = SecondsFromTime(entryStartTime) >= 0 and SecondsTillTime(entryEndTime) >= 0;
i am trying to get as part o the postions that i have to isplay next month monthly expiration for call and put delta around .20 or closest one... some how the belwo code is not working; apprecaite the help
#-- Code begin
# User-defined input for the target expiration (Third Friday of the target month)
input targetExpiration = 20241220; # Example: December 20, 2024 (Third Friday)
# Get Delta, Volume, Open Interest, and Bid Price
def delta = Delta();
def volume = if IsNaN(Volume()) then 0 else Volume();
def openInterest = if IsNaN(OpenInterest()) then 0 else OpenInterest();
def bidPrice = if IsNaN(Bid()) then 0 else Bid();
# Define Delta Range for Calls and Puts
def callCondition = delta >= 0.18 and delta <= 0.22; # Adjust delta range if needed
def putCondition = delta <= -0.18 and delta >= -0.22; # Adjust delta range if needed
# Directly use the target expiration as the expiration date
def isTargetExpiration = GetYYYYMMDD() == targetExpiration;
# Combine conditions for valid options
def isValidCall = callCondition and isTargetExpiration;
def isValidPut = putCondition and isTargetExpiration;
# Combine all filters for valid calls and puts
def isFilteredCall = isValidCall and meetsVolumeCondition;
def isFilteredPut = isValidPut and meetsVolumeCondition;
I want to configure a scanner that detects when the TTM_Waves cross the 0 line, if any of the condition is true I want to see that stock in scanner list.
The conditions are as follows:
When all waves are below 0, and a yellow wave appears, with its length decreasing over the last 2-3 consecutive bars.
When all waves are above 0, and brown wave appears and its length is decreasing over the last 2-3 consecutive bars.
I have tried below for first condition but is not working as expected. (Just to try I have selected value 5 but I am not looking at fix value. Is it possible to compare previous 2 waves length according to above conditions?
Below is ChatGPT answer, but still not correct. It is showing stock that has all waves above 0 line.
Ruby:
# Define TTM Wave Indicator
def TTMWave = TTM_Wave();

# Define the yellow wave (assumed to be the wave with a color of Yellow in the TTM_Wave study)
def yellowWave = TTMWave[1]; # For yellow wave detection, you may need to look for specific color logic if defined
# Identify when all waves are below 0
def allWavesBelowZero = TTMWave < 0;

# Check if the yellow wave's length is decreasing from the previous 2-3 bars
def yellowWaveDecreasing = yellowWave < yellowWave[1] and yellowWave[1] < yellowWave[2];

# The condition when all waves are below 0 and the yellow wave is decreasing
plot scan = allWavesBelowZero and yellowWaveDecreasing;
Trying to find out the 3rd Friday of current month and next month.
AI gave me some code, but I cannot make it work.
Can some figure out what went wrong here?
def currentMonth = GetMonth(); #(GetYYYYMMDD());
def currentYear = GetYear(); #(GetYYYYMMDD());
def nextMonth = if currentMonth == 12 then 1 else currentMonth + 1;
def nextYear = if currentMonth == 12 then currentYear + 1 else currentYear;
In the context of this scan, the stocks identified would exhibit price action that aligns with the characteristics of Geometric Brownian Motion (GBM). Here’s a breakdown of what you could expect:
Volatility: Stocks that pass the scan would exhibit relatively high volatility, as measured by the Average True Range (ATR). GBM assumes that volatility is a key factor, meaning the price fluctuates with a certain degree of randomness and uncertainty. This translates to price movements that have a higher chance of significant up or down swings in the short term. Stocks with higher volatility might exhibit wide daily price ranges.
Trend Movement (Drift): The Rate of Change (ROC) filter ensures that stocks with an upward price trend (positive drift) are favored. This means you would see stocks with a noticeable increase in price over the lookback period. These stocks are likely trending upwards, though the movement may still follow a somewhat erratic path due to volatility.
Mean Reversion and Oscillation: While GBM does not exhibit strict mean reversion, stocks with high volatility and drift, especially in combination with MACD momentum, can show oscillating behavior. This could mean that while prices are generally trending upwards (due to positive drift), you may still see pullbacks, sharp reversals, or consolidations as the price fluctuates within the volatility bounds.
Volume Support: The filter for volume ensures that there’s significant market participation behind the price movements. Stocks with higher volume are more likely to see sustained price trends or volatility, as they reflect the involvement of institutional players or large retail groups. This helps provide liquidity for the erratic price moves suggested by a GBM-like process.
Expected Price Action from Scan Results:
Short-Term Trends with High Fluctuations: Given that GBM reflects a random walk, you may see stocks with periods of strong upward movement (following the drift) but also with significant pullbacks or reversals, especially during high volatility periods.
Erratic Path with an Upward Bias: While the overall price movement may show an upward trend (positive drift), the path will not be smooth. The price will likely exhibit frequent oscillations, with higher highs and lower lows within the uptrend, characteristic of stocks with high volatility and momentum.
Potential for Sudden Price Movements: Due to the combination of volatility (ATR) and momentum (MACD and ROC), the price may move rapidly in short bursts, and you could experience sudden, sharp moves in either direction within the broader trend.
In Summary:
You can expect stocks that meet the scan's criteria to show volatility-driven trends with a higher likelihood of price swings, in alignment with the GBM framework. This would mean that while the price generally follows an upward trend (drift), there will be frequent price fluctuations (randomness) along the way, with periods of both strong momentum and pullbacks.
I would love for someone to look at it by putting into a scan and just give feedback here is the script.
Code:
# Monte Carlo-Inspired Stock Scan with GBM Approximation and Enhancements

# Define Inputs
input RelativeVolatilityThreshold = 0.005;  # Minimum relative volatility threshold (e.g., 0.5%)
input ROCThreshold = 0.02;                  # Minimum rate of change threshold (2%)
input MACDThreshold = -0.5;                 # Allows for early momentum detection
input VolumeAvgPeriod = 20;                 # Period for average volume calculation
input VolumeMultiplier = 1.5;               # Current volume must be 150% of average
input lookbackPeriod = 14;                  # Period for ROC and volatility calculations
input ATRPeriod = 14;
input MACDFastLength = 12;
input MACDSlowLength = 26;
input MACDSignalLength = 9;
input MinPrice = 5;
input TrendDirection = {default Bullish, Bearish, Both};

# Calculate Relative Volatility using GBM approximation
def logReturns = Log(close / close[1]);
def historicalVolatility = StDev(logReturns, lookbackPeriod) * Sqrt(252);  # Annualized volatility
def meetsVolatility = historicalVolatility > RelativeVolatilityThreshold;

# Calculate Price Rate of Change (ROC)
def ROC = (close / close[lookbackPeriod]) - 1;

# Determine ROC condition based on Trend Direction
def meetsROC;
switch (TrendDirection) {
    case Bullish:
        meetsROC = ROC > ROCThreshold;
    case Bearish:
        meetsROC = ROC < -ROCThreshold;
    case Both:
        meetsROC = AbsValue(ROC) > ROCThreshold;
}

# Calculate MACD Histogram and Signal
def MACDLine = MACD(fastLength = MACDFastLength, slowLength = MACDSlowLength, MACDLength = MACDSignalLength)."Value";
def SignalLine = MACD(fastLength = MACDFastLength, slowLength = MACDSlowLength, MACDLength = MACDSignalLength)."Avg";
def MACDHistogram = MACDLine - SignalLine;
def MACDCross = MACDLine crosses above SignalLine;

# Use MACD Histogram Slope or Crossover
def meetsMACD = MACDHistogram > MACDThreshold;

# Calculate Volume Conditions
def avgVolume = Average(volume, VolumeAvgPeriod);
def relVolume = volume / avgVolume;
def meetsVolume = relVolume > VolumeMultiplier;

# Price Condition
def meetsPrice = close > MinPrice;

# Combine All Conditions
def meetsAllConditions = meetsVolatility and meetsROC and meetsMACD and meetsVolume and meetsPrice;

# Plot for Potential Trend
plot TrendPotential = meetsAllConditions;
TrendPotential.SetPaintingStrategy(PaintingStrategy.BOOLEAN_ARROW_UP);
TrendPotential.SetDefaultColor(Color.GREEN);
TrendPotential.SetLineWeight(2);

# Plot Individual Conditions (Optional)
plot VolatilityCondition = if meetsVolatility then 1 else 0;
VolatilityCondition.SetDefaultColor(Color.RED);
VolatilityCondition.SetPaintingStrategy(PaintingStrategy.HISTOGRAM);
VolatilityCondition.Hide();

plot ROCCondition = if meetsROC then 1 else 0;
ROCCondition.SetDefaultColor(Color.BLUE);
ROCCondition.SetPaintingStrategy(PaintingStrategy.HISTOGRAM);
ROCCondition.Hide();

plot MACDCondition = if meetsMACD then 1 else 0;
MACDCondition.SetDefaultColor(Color.ORANGE);
MACDCondition.SetPaintingStrategy(PaintingStrategy.HISTOGRAM);
MACDCondition.Hide();

plot VolumeCondition = if meetsVolume then 1 else 0;
VolumeCondition.SetDefaultColor(Color.PINK);
VolumeCondition.SetPaintingStrategy(PaintingStrategy.HISTOGRAM);
VolumeCondition.Hide();

plot PriceCondition = if meetsPrice then 1 else 0;
PriceCondition.SetDefaultColor(Color.CYAN);
PriceCondition.SetPaintingStrategy(PaintingStrategy.HISTOGRAM);
PriceCondition.Hide();

# Alerts
Alert(meetsAllConditions, "Potential Trend Detected", Alert.BAR, Sound.Ding);
Trying to find out the 3rd Friday of current month and next month.
AI gave me some code, but I cannot make it work.
Can some figure out what went wrong here?
def currentMonth = GetMonth(); #(GetYYYYMMDD());
def currentYear = GetYear(); #(GetYYYYMMDD());
def nextMonth = if currentMonth == 12 then 1 else currentMonth + 1;
def nextYear = if currentMonth == 12 then currentYear + 1 else currentYear;
as is , there is no error because there is no output.
when i add a bubble to display firstFriday, an error appears.
sometimes an error causes this to appear,
in the top left corner of the chart, under the symbol field, there is a flashing white circle on the chart, with an exclamation point
click on it,
it says date value can't be less than 19020101
start at the end of study and disable a code line and save, until error goes away
firstDayOfMonth , this is a number 1 to 7. 1 = monday, 7 = sunday
dec/2024 = 7 , 1st is on sunday
this causes an error
GetDayOfWeek() wants a date code number, YYYYMMDD , not a number < 10
def firstFriday = firstDayOfMonth + (5 - GetDayOfWeek(firstDayOfMonth) + 7) % 7;
this produces a number, but i think its wrong.
def firstFriday = firstDayOfMonth + (5 - firstDayOfMonth + 7) % 7;
------------------
here is a code to experiment with
it has bubbles to display some values
vertical lines on 1st and 3rd fridays
Code:
#third_friday_00b

#https://usethinkscript.com/threads/chatgpt-bard-other-ai-scripts-which-cant-be-used-in-thinkorswim.13822/page-17#post-147937
#timing
#12/02
#327
#Trying to find out the 3rd Friday of current month and next month.
#AI gave me some code, but I cannot make it work.
#Can some figure out what went wrong here?

def dat = GetYYYYMMDD();

def currentMonth = GetMonth(); #(GetYYYYMMDD());
def currentYear = GetYear(); #(GetYYYYMMDD());
def nextMonth = if currentMonth == 12 then 1 else currentMonth + 1;
def nextYear = if currentMonth == 12 then currentYear + 1 else currentYear;

#def firstDayOfMonth = GetDayOfWeek(currentYear * 10000 + currentMonth * 100 + 1);
#def firstDayOfMonth = GetDayOfWeek((currentYear * 10000) + (currentMonth * 100) + 1);

def date1 = ((currentYear * 10000) + (currentMonth * 100) + 1);
def firstDayOfMonth = GetDayOfWeek(date1);


#input day_of_week = {default Monday, Tuesday, Wednesday, Thursday, Friday, Saturday, Sunday};
#AddChartBubble(GetDayofWeek(GetYYYYMMDD()) == day_of_week + 1, high, "Here it is");


#bad
#def firstFriday = firstDayOfMonth + (5 - GetDayOfWeek(firstDayOfMonth) + 7) % 7;
#wrong
#def firstFriday = firstDayOfMonth + (5 - firstDayOfMonth + 7) % 7;


# 1st friday , day of month
def firstfriday_dom =
    (if firstDayOfMonth == 1 then 5
else if firstDayOfMonth == 2 then 4
else if firstDayOfMonth == 3 then 3
else if firstDayOfMonth == 4 then 2
else if firstDayOfMonth == 5 then 1
else if firstDayOfMonth == 6 then 7
else if firstDayOfMonth == 7 then 6
else 0);


#def thirdFriday = firstFriday + 14;
def thirdFriday_dom = firstfriday_dom + 14;


def isfirstfriday = dat == ((currentYear * 10000) + (currentMonth * 100) + firstfriday_dom);
addverticalline( isfirstfriday , "FIRST  FRIDAY  " + asprice((currentYear * 10000) + (currentMonth * 100) + firstfriday_dom), color.cyan);

def isthirdfriday = dat == ((currentYear * 10000) + (currentMonth * 100) + thirdFriday_dom);
addverticalline( isthirdfriday , "THIRD  FRIDAY  " + asprice((currentYear * 10000) + (currentMonth * 100) + thirdFriday_dom), color.magenta);


#def firstDayOfNextMonth = GetDayOfWeek(nextYear * 10000 + nextMonth * 100 + 1);
#def firstFridayNextMonth = firstDayOfNextMonth + (5 - GetDayOfWeek(firstDayOfNextMonth) + 7) % 7;
#def thirdFridayNextMonth = firstFridayNextMonth + 14;


def y = 0.02;
addchartbubble(1, high*(1+y),
(currentMonth + "/1\n" +
 "DOW= " + firstDayOfMonth + "\n" +
    (if firstDayOfMonth == 1 then "Monday"
else if firstDayOfMonth == 2 then "Tuesday"
else if firstDayOfMonth == 3 then "Wednesday"
else if firstDayOfMonth == 4 then "Thursday"
else if firstDayOfMonth == 5 then "Friday"
else if firstDayOfMonth == 6 then "Saturday"
else if firstDayOfMonth == 7 then "Sunday"
else "-")),
color.yellow, yes);


addchartbubble(1, high*(1+y),
 "1st friday\n" +
 currentMonth + "/" + firstfriday_dom
, color.yellow, yes);


addchartbubble(1, high*(1+y),
 "3rd friday\n" +
 currentMonth + "/" +  thirdFriday_dom
, color.yellow, yes);


#----------------------

addchartbubble(0, low*(1-y),
currentMonth + "\n" +
date1 + "\n" +
firstDayOfMonth + "\n" +
#firstFriday + "\n" +
firstfriday_dom + "\n"
, color.yellow, no);

#
----------------
there is a built in study called
Next3rdFriday
that calculates the days to the 3rd friday
I want to configure a scanner that detects when the TTM_Waves cross the 0 line, if any of the condition is true I want to see that stock in scanner list.
The conditions are as follows:
When all waves are below 0, and a yellow wave appears, with its length decreasing over the last 2-3 consecutive bars.
When all waves are above 0, and brown wave appears and its length is decreasing over the last 2-3 consecutive bars.
I have tried below for first condition but is not working as expected. (Just to try I have selected value 5 but I am not looking at fix value. Is it possible to compare previous 2 waves length according to above conditions?
Below is ChatGPT answer, but still not correct. It is showing stock that has all waves above 0 line.
Ruby:
# Define TTM Wave Indicator
def TTMWave = TTM_Wave();

# Define the yellow wave (assumed to be the wave with a color of Yellow in the TTM_Wave study)
def yellowWave = TTMWave[1]; # For yellow wave detection, you may need to look for specific color logic if defined
# Identify when all waves are below 0
def allWavesBelowZero = TTMWave < 0;

# Check if the yellow wave's length is decreasing from the previous 2-3 bars
def yellowWaveDecreasing = yellowWave < yellowWave[1] and yellowWave[1] < yellowWave[2];

# The condition when all waves are below 0 and the yellow wave is decreasing
plot scan = allWavesBelowZero and yellowWaveDecreasing;
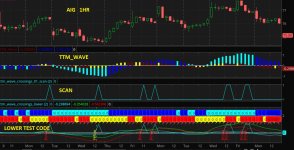
another example of chatgpt not knowing how to create a study.
the study only reads 1 plot from the study. there are 3 signals and zero.
just take the time to learn thinkscript.
since the original study is hidden, i had to make some guesses and start experimenting.
i loaded the original study, ttm_wave.
i read the plot values from the original study, and plotted lines.
def w1 = ttm_wave().Wave1;
def w2hi = ttm_wave().Wave2High;
def w2lo = ttm_wave().Wave2Low;
#def z0 = ttm_wave().ZeroLine;
the lines are pretty flat, so its hard to tell when they change direction.
i made a bubble to display the plot values.
i stared at the histogram colors and my bubble values.
i guessed if the change in w1 is positive, there are yellow histogram bars. if negative then brown. then changed the bubble color to follow that rule. it matched the histogram.
next i found the change in w2 histogram bar height. if positive then cyan. if negative then blue.
----------------------
scan code
Code:
#ttm_wave_crossings_01_scan


#https://usethinkscript.com/threads/chatgpt-bard-other-ai-scripts-which-cant-be-used-in-thinkorswim.13822/page-17#post-148286
#AlwaysLearning
#11/29
#325
#I want to configure a scanner that detects when the TTM_Waves cross the 0 line, if any of the condition is true I want to see that stock in scanner list.

#The conditions are as follows:
# When all waves are below 0,
#  and a yellow wave appears, with its length decreasing over the last 2-3 consecutive bars.
# When all waves are above 0,
#  and brown wave appears and its length is decreasing over the last 2-3 consecutive bars.


declare lower;

def w1 = ttm_wave().Wave1;
def w2hi = ttm_wave().Wave2High;
def w2lo = ttm_wave().Wave2Low;
#def z0 = ttm_wave().ZeroLine;

def wavesabove = w1 > 0 and w2hi > 0 and w2lo > 0;
def wavesbelow = w1 < 0 and w2hi < 0 and w2lo < 0;

input min_sequential_bars = 2;

#-------------------

def w1chg = w1 - w1[1];
# if w1chg > 0 then yellow.  if < 0 then  brown(red)

# When all waves are below 0,
#  and a yellow wave appears, with its length decreasing over the last 2-3 consecutive bars.
def yellowdecrease = wavesbelow and w1chg > 0 and (sum((w1chg<w1chg[1]), min_sequential_bars) ==  min_sequential_bars);

# When all waves are above 0,
#  and brown wave appears and its length is decreasing over the last 2-3 consecutive bars.
def browndecrease = wavesabove and w1chg < 0 and (sum((w1chg<w1chg[1]), min_sequential_bars) ==  min_sequential_bars);

#-------------------
def w2chg = (w2hi - w2lo) - (w2hi[1] - w2lo[1]);
# if w2chg > 0 then cyan.   if < 0 then  blue
#-------------------

plot z = yellowdecrease or  browndecrease;

#
------------------
lower test code
Code:
#ttm_wave_crossings_lower


#https://usethinkscript.com/threads/chatgpt-bard-other-ai-scripts-which-cant-be-used-in-thinkorswim.13822/page-17#post-148286
#AlwaysLearning
#11/29
#325
#I want to configure a scanner that detects when the TTM_Waves cross the 0 line, if any of the condition is true I want to see that stock in scanner list.

#The conditions are as follows:
# When all waves are below 0,
#  and a yellow wave appears, with its length decreasing over the last 2-3 consecutive bars.
# When all waves are above 0,
#  and brown wave appears and its length is decreasing over the last 2-3 consecutive bars.


# ttm_wave
#plot Wave1 = Double.NaN;
#plot Wave2High = Double.NaN;
#plot Wave2Low = Double.NaN;
#plot ZeroLine = Double.NaN;


declare lower;

def w1 = ttm_wave().Wave1;
def w2hi = ttm_wave().Wave2High;
def w2lo = ttm_wave().Wave2Low;
#def z0 = ttm_wave().ZeroLine;

def wavesabove = w1 > 0 and w2hi > 0 and w2lo > 0;
def wavesbelow = w1 < 0 and w2hi < 0 and w2lo < 0;

input min_sequential_bars = 2;

#-------------------

def w1chg = w1 - w1[1];
# if w1chg > 0 then yellow.  if < 0 then  brown(red)

# When all waves are below 0,
#  and a yellow wave appears, with its length decreasing over the last 2-3 consecutive bars.
def yellowdecrease = wavesbelow and w1chg > 0 and (sum((w1chg<w1chg[1]), min_sequential_bars) ==  min_sequential_bars);

# When all waves are above 0,
#  and brown wave appears and its length is decreasing over the last 2-3 consecutive bars.
def browndecrease = wavesabove and w1chg < 0 and (sum((w1chg<w1chg[1]), min_sequential_bars) ==  min_sequential_bars);

#-------------------
def w2chg = (w2hi - w2lo) - (w2hi[1] - w2lo[1]);
# if w2chg > 0 then cyan.   if < 0 then  blue
#-------------------

plot z = yellowdecrease or  browndecrease;

#-------------------

# outputs

addverticalline(yellowdecrease, "Yellow", color.yellow);
addverticalline(browndecrease, "Brown", color.red);

plot z1 = w1;
plot z2 = w2hi;
plot z3 = w2lo;
plot z4 = 0;

z1.SetDefaultColor(Color.cyan);
z2.SetDefaultColor(Color.green);
z3.SetDefaultColor(Color.red);
z4.SetDefaultColor(Color.white);
z4.setlineweight(2);


addchartbubble(1 or wavesbelow, 1,
# w1 + "\n" +
 w1chg
# w2hi + "\n" +
# w2lo + "\n" +
# w2chg
, (if w1chg > 0 then color.yellow else color.red), yes);
#, (if w2chg > 0 then color.cyan else color.blue), yes);
#, color.yellow, yes);


addchartbubble(1 or wavesbelow, 1,
# w1 + "\n" +
# w1chg
# w2hi + "\n" +
# w2lo + "\n" +
w2chg
#, (if w1chg > 0 then color.yellow else color.red), yes);
, (if w2chg > 0 then color.cyan else color.blue), yes);
#, color.yellow, yes);

#
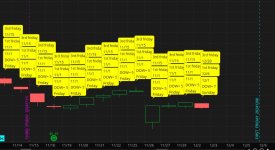
sorry, your words are confusing.
returns even lines? what is an even line?
i have no idea what i am supposed to look at in your images.
1st pic , what study did you use in the column?
2nd pic , where sis those horizontal lines come from? you are showing things and not explaining where they cam from.
3rd pic, same no idea where the lines came from
from #325
you didn't specify what the rules mean, so i didn't know what was up or down.
why do you want brown lines below zero when you said the opposite , above
'When all waves are above 0, and brown wave appears and its length is decreasing over the last 2-3 consecutive bars.'
instead of saying brown lines. say the name of the plot , w1 , w2hi , w2lo
brown is the color of a histogram bar, not lines
you wanted 2 conditions to trigger an output, so if the 'up' rule or 'down' rule is true, the output is true
Hello All,
I am sorry if this has been covered already. I attempted to read all the discussions and finally called it quits at page 5. I was hoping to create a new column in the Equities and Equity Options tab (Monitor tab→Activity and Positions tab→Position Statement tab→Unallocated tab→Equity and Equity Options tab) that lists the number of days that has transpired since the trade was opened. Not till expiration but just days opened. I attempted to create the Thinkscript via Chat and surprise surprise it was a flop.
Is there anyone that could look at the Thinkscript Chat spit out, and perhaps tell me what I am missing? ...
def entryDate = if IsNaN(EntryDate()) then Double.NaN else EntryDate();def daysOpen = if IsNaN(entryDate) then Double.NaN else GetYYYYMMDD() - entryDate;# If position is not open, display NaNAddLabel(yes, if IsNaN(daysOpen) then "N/A" else daysOpen + " Days", Color.CYAN);plot data = daysOpen;
the following errors came up... entryDate at 1:26
No such function: entryDate at 1:60
No such function: entryDate at 1:60
Expected double at 1:20
Hello, I am looking for a simple code that plots EMA8 and EMA 23 cross over with SL and target lines extended untill the levels are breached. But running into below issue. Can anyone help to fix this pls?
1) Not able to stop subsequent signals from appearing
2) Not able to show the SL, target extentions untill the levels are breached.
Code:
# Define the EMAs
input length1 = 8; # Length for the first EMA
input length2 = 23; # Length for the second EMA
input candleCount = 5; # User-defined input for the number of previous candles

# Calculate the EMAs
def ema8 = ExpAverage(close, length1);
def ema23 = ExpAverage(close, length2);

# Plot the EMAs
plot EMA8Line = ema8;
EMA8Line.SetDefaultColor(Color.GREEN);
plot EMA23Line = ema23;
EMA23Line.SetDefaultColor(Color.RED);

# Define crossover conditions
def buySignal = ema8 crosses above ema23;
def sellSignal = ema8 crosses below ema23;

# Define NY trading hours using SecondsFromTime and SecondsTillTime
def isInNYTime = SecondsFromTime(930) >= 0 and SecondsTillTime(1600) >= 0;

# Plot buy and sell signals only during NY trading hours
plot BuyArrow = if buySignal and isInNYTime then low - 0.02 else Double.NaN;
BuyArrow.SetPaintingStrategy(PaintingStrategy.ARROW_UP);
BuyArrow.SetDefaultColor(Color.GREEN);
BuyArrow.SetLineWeight(3);

plot SellArrow = if sellSignal and isInNYTime then high + 0.02 else Double.NaN;
SellArrow.SetPaintingStrategy(PaintingStrategy.ARROW_DOWN);
SellArrow.SetDefaultColor(Color.RED);
SellArrow.SetLineWeight(3);

# Calculate stop loss and target levels
def stopLossBuy = if buySignal then Lowest(low[1], candleCount) else Double.NaN;
def targetBuy = if buySignal then close + (1.5 * (close - stopLossBuy)) else Double.NaN;

def stopLossSell = if sellSignal then Highest(high[1], candleCount) else Double.NaN;
def targetSell = if sellSignal then close - (1.5 * (stopLossSell - close)) else Double.NaN;

# Check if stop loss or target has been breached
def stopLossBreachedBuy = close < stopLossBuy;
def targetBreachedBuy = close >= targetBuy;

def stopLossBreachedSell = close > stopLossSell;
def targetBreachedSell = close <= targetSell;

# Plot stop loss and target levels only during NY trading hours and if not breached
plot StopLossBuyPlot = if isInNYTime and !stopLossBreachedBuy and !targetBreachedBuy then stopLossBuy else Double.NaN;
StopLossBuyPlot.SetDefaultColor(Color.RED);
StopLossBuyPlot.SetPaintingStrategy(PaintingStrategy.HORIZONTAL);

plot TargetBuyPlot = if isInNYTime and !stopLossBreachedBuy and !targetBreachedBuy then targetBuy else Double.NaN;
TargetBuyPlot.SetDefaultColor(Color.GREEN);
TargetBuyPlot.SetPaintingStrategy(PaintingStrategy.HORIZONTAL);

plot StopLossSellPlot = if isInNYTime and !stopLossBreachedSell and !targetBreachedSell then stopLossSell else Double.NaN;
StopLossSellPlot.SetDefaultColor(Color.RED);
StopLossSellPlot.SetPaintingStrategy(PaintingStrategy.HORIZONTAL);

plot TargetSellPlot = if isInNYTime and !stopLossBreachedSell and !targetBreachedSell then targetSell else Double.NaN;
TargetSellPlot.SetDefaultColor(Color.GREEN);
TargetSellPlot.SetPaintingStrategy(PaintingStrategy.HORIZONTAL);
New Highs count Watchlist Custom Column. Trying to use as scanner filter but having trouble setting condition to certain amount anything over 100.
I asked ChatGPT to make a script that counts new highs within the day and that's what it gave me. Sorry not an actual programmer more like a household mechanic. I think it converted to pennies to lessen the money count of stock price? Not sure like I said I'm not a programmer.
Then I asked usethinkscript to make a scanner that only allows certain amount of new highs within the day. Example: Anything over 100 new high of day. ChatGPT wasn't to helpful with that.
# Custom Watchlist Column: New High Incremental Count
def newDay = GetYYYYMMDD() != GetYYYYMMDD()[1];
def lowestLow = if newDay then low else Min(lowestLow[1], low);
def highestHigh = if newDay then high else Max(highestHigh[1], high);
def highDifference = highestHigh - lowestLow;
def increment = 0.01; # Set the increment to 1 cent
Hello All,
I am sorry if this has been covered already. I attempted to read all the discussions and finally called it quits at page 5. I was hoping to create a new column in the Equities and Equity Options tab (Monitor tab→Activity and Positions tab→Position Statement tab→Unallocated tab→Equity and Equity Options tab) that lists the number of days that has transpired since the trade was opened. Not till expiration but just days opened. I attempted to create the Thinkscript via Chat and surprise surprise it was a flop.
Is there anyone that could look at the Thinkscript Chat spit out, and perhaps tell me what I am missing? ...
def entryDate = if IsNaN(EntryDate()) then Double.NaN else EntryDate();def daysOpen = if IsNaN(entryDate) then Double.NaN else GetYYYYMMDD() - entryDate;# If position is not open, display NaNAddLabel(yes, if IsNaN(daysOpen) then "N/A" else daysOpen + " Days", Color.CYAN);plot data = daysOpen;
the following errors came up... entryDate at 1:26
No such function: entryDate at 1:60
No such function: entryDate at 1:60
Expected double at 1:20
here is a lower study to experiment with. i didn't test it in a strategy or trades
Code:
#chat_332_days
#https://usethinkscript.com/threads/chatgpt-bard-other-ai-scripts-which-cant-be-used-in-thinkorswim.13822/page-17#post-148371

declare lower;

def na = double.nan;
def bn = barnumber();

def d = getday();
def newday = d != d[1];

def qty = if isnan(GetQuantity()) then 0 else GetQuantity();

def daysintrade = if bn == 1 then -99999
# else if qty != qty[1] then 0
 else if qty[1] == 0 and qty > 0 then 0
 else if qty[1] > 0 and qty == 0 then -99999
 else daysintrade[1] + 1;

plot z = if daysintrade <0 then 0 else daysintrade;

#def entryDate = if IsNaN(EntryDate()) then Double.NaN else EntryDate();
#def daysOpen = if IsNaN(entryDate) then Double.NaN else GetYYYYMMDD() - entryDate;# If position is not open, display NaNAddLabel(yes, if IsNaN(daysOpen) then "N/A" else daysOpen + " Days", Color.CYAN);plot data = daysOpen;

addchartbubble(1, -0.5,
qty + "\n" +
daysintrade
, color.yellow, no);
#
William O'Neil: One of the most important factors in his system is relative strength—the measure of how a stock performs compared to the overall market or its sector. A high RS rating (above 80-90) indicates that the stock is outperforming other stocks and has momentum.
Mark Minervini also places heavy importance on relative strength, especially in conjunction with price volume action.
2. Proper Technical Setup
Mark Minervini: He focuses on volatility contraction patterns (VCP), where the stock's price action tightens up over time, forming a series of smaller swings within a broader consolidation. This tightening, often coupled with an increase in volume as it breaks out, is a key technical signal.
David Ryan also looks for tight bases that have a clear breakout point, similar to the patterns O'Neil and Minervini describe.
3. Strong Earnings and Revenue Growth
William O'Neil's CAN SLIM system emphasizes stocks that are showing strong earnings growth, ideally over 25% or more per quarter. He also looks for consistent revenue growth.
Mike Webster also looks for growth stocks with strong earnings and revenue acceleration, often analyzing past earnings momentum and forward projections.
4. High Volume at Breakouts
All of them look for volume to confirm price moves. A breakout should ideally occur on increased volume, showing that institutional investors are stepping in and supporting the move. Without volume confirmation, a breakout might be less reliable.
David Ryan and Mark Minervini both emphasize that for a stock to lead, the breakout should be on above-average volume to indicate that there’s enough interest from both institutional and retail investors.
5. Market Conditions and Sector Leadership
William O'Neil and David Ryan both focus on the importance of the overall market condition. Even if a stock is fundamentally strong, it’s unlikely to perform well in a weak market. They look for bull markets or at least favorable sector rotation. If the broader market is in a correction, they tend to be more cautious.
Mark Minervini also emphasizes market conditions and typically prefers to trade stocks that are leading within a strong market, with a positive general market trend (a healthy trend in indexes like the S&P 500).
6. Quality of the Stock's Fundamentals
O'Neil uses the CAN SLIM acronym to evaluate a stock’s fundamental health. He looks for earnings growth (C), annual sales growth (A), new products or services (N), and other key financial metrics like institutional sponsorship (I) and market leadership (L).
Mark Minervini also stresses the importance of fundamentals such as earnings growth, but he tends to focus on the stock’s price action and technical patterns as more important when identifying leaders.
7. Institutions Ownership and Sponsorship
William O'Neil is particularly focused on institutional sponsorship. A stock with institutional ownership is often viewed as more likely to become a leader, as these investors are often the ones with the capital to move the stock higher.
David Ryan and Mike Webster also look for signs of institutional buying. They prefer stocks that have consistent accumulation by institutions.
8. Strong Sector/Industry
Mike Webster and Mark Minervini focus on finding stocks within sectors that are showing leadership. If an individual stock is part of a leading sector or industry group, it has a higher chance of outperforming.
O'Neil and Ryan similarly emphasize the importance of industry group strength, as stocks in strong sectors are more likely to break out and continue to outperform the broader market.
9. Catalysts for Future Growth
David Ryan and O'Neil tend to look for stocks with a story—meaning, a stock that has some potential catalyst driving it. Whether it's new products, market expansion, or new technologies, a growth catalyst can help sustain the stock’s momentum.
Mark Minervini would likely align with this idea, particularly if the stock shows signs of future potential from a technical perspective and in terms of earnings growth.
Summary of Key Criteria:
Relative Strength (outperformance vs. the market).
Volatility Contraction Pattern (VCP) or tight bases for breakouts.
Strong earnings and revenue growth.
Breakouts on high volume.
Positive market conditions and leadership from sectors.
Hi, I was trying but failed to identify the true high and low before each price movement reversal. The best I can do is to have multiple highs and lows as attached below. What I actually need is just these circled in yellow. That being said, I just need to see 4 values of 5830, 5724, 527.25 and 5724.25 on the chart, the remaining numbers should not be plotted on the chart. Here is my script. Can someone with more experience and knowledge help please? Thanks in advance.
# Identify True High and Low
# Created on Dec 12, 2024 by RZ
# Version 20241212001
# Define Lookback Period
input lookbackPeriod = 5;
# Identify Potential Highs and Lows
def potentialHigh = high == Highest(high, lookbackPeriod);
def potentialLow = low == Lowest(low, lookbackPeriod);
# State Variables for Confirming Highs and Lows
rec lastConfirmedHigh = if potentialHigh and (IsNaN(lastConfirmedHigh[1]) or high > lastConfirmedHigh[1]) then high else lastConfirmedHigh[1];
rec lastConfirmedLow = if potentialLow and (IsNaN(lastConfirmedLow[1]) or low < lastConfirmedLow[1]) then low else lastConfirmedLow[1];
# Alternation Logic
def confirmedHigh = potentialHigh and low > lastConfirmedLow[1];
def confirmedLow = potentialLow and high < lastConfirmedHigh[1];
Im also trying to figure out how to do if then statements been trying to use chatgpt to write it for me but it keeps giving me issues so far i have gotten 3 functions to work correctly in my script and i get no errors but when i look at my results im somehow always missing the sell signal. Could someone explain what i might be doign wrong is my sellposition signal too complicated?
Ruby:
# Inputs for Fast Stochastics
input kPeriod1 = 9;
input dPeriod1 = 3;
input kPeriod2 = 14;
input dPeriod2 = 3;
input kPeriod3 = 40;
input dPeriod3 = 4;

# Inputs for Full Stochastic
input kPeriodFull = 60;
input dPeriodFull = 10;
input slowingPeriodFull = 1;

# MACD Inputs
input fastLength = 12;
input slowLength = 26;
input macdLength = 6;

# Calculate Weighted HLOC (Average of High, Low, Open, Close)
def hlcAverage = (high + low + close) / 3;
def hlocAverage = (high + low + open + close) / 4;

# Fast Stochastic Calculations (using HLOC Average)
def stoch1 = (hlocAverage - Lowest(low, kPeriod1)) / (Highest(high, kPeriod1) - Lowest(low, kPeriod1)) * 100;
def stoch2 = (hlocAverage - Lowest(low, kPeriod2)) / (Highest(high, kPeriod2) - Lowest(low, kPeriod2)) * 100;
def stoch3 = (hlocAverage - Lowest(low, kPeriod3)) / (Highest(high, kPeriod3) - Lowest(low, kPeriod3)) * 100;

# Full Stochastic Calculation (using HLOC Average)
def rawFullStochK = (hlcAverage - Lowest(low, kPeriodFull)) / (Highest(high, kPeriodFull) - Lowest(low, kPeriodFull)) * 100;
def fullStoch = Average(rawFullStochK, slowingPeriodFull);

# MACD Calculation
def macdValue = ExpAverage(close, fastLength) - ExpAverage(close, slowLength);
def macdSignal = ExpAverage(macdValue, macdLength);

# True 1 Condition (All Stochastics are below 20)
def true1 = stoch1 < 20 and stoch2 < 20 and stoch3 < 20 and fullStoch < 20;

# Buy Signal Condition:
# 1. True 1 is active
# 2. Full Stochastic crosses above 25
# 3. MACD Value is above MACD Signal
def buySignalCondition = true1[1] and fullStoch >= 25 and macdValue > macdSignal;

# True 3 Condition: Full Stochastic crosses above 80
def true3 = fullStoch >= 80;

# Track if True3 is Active
rec true3Active = if true3 then 1 else if fullStoch <= 70 then 0 else true3Active[1];

# Sell Signal Condition:
# 1. True3 is active
# 2. Full Stochastic falls below or equals 70
# 3. MACD Value is below MACD Signal
def sellSignalCondition = true3Active and fullStoch <= 70 and fullStoch[1] > 70 and macdValue < macdSignal;

# State Tracking for Position
rec inPosition = CompoundValue(1, if buySignalCondition then 1 else if sellSignalCondition then 0 else inPosition[1], 0);

# Generate Buy Signal
def buySignal = buySignalCondition and !inPosition[1];

# Generate Sell Signal
def sellSignal = sellSignalCondition and inPosition[1];

# Debugging Signals
plot DebugBuy = buySignalCondition;
DebugBuy.SetDefaultColor(Color.CYAN);
DebugBuy.SetPaintingStrategy(PaintingStrategy.POINTS);

plot DebugSell = sellSignalCondition;
DebugSell.SetDefaultColor(Color.MAGENTA);
DebugSell.SetPaintingStrategy(PaintingStrategy.POINTS);

# Add Buy Order (Buy Signal)
AddOrder(OrderType.BUY_TO_OPEN, buySignal, price = open[1], tickcolor = Color.GREEN, arrowcolor = Color.GREEN, name = "Buy");

# Add Sell Order (Sell Signal)
AddOrder(OrderType.SELL_TO_CLOSE, sellSignal, price = open[1], tickcolor = Color.RED, arrowcolor = Color.RED, name = "Sell");


# Plot Buy Signal (Upward Arrow for Buy)
plot BuyPlot = buySignal;
BuyPlot.SetDefaultColor(Color.GREEN);
BuyPlot.SetPaintingStrategy(PaintingStrategy.BOOLEAN_ARROW_UP);

# Plot Sell Signal (Downward Arrow for Sell)
plot SellPlot = sellSignal;
SellPlot.SetDefaultColor(Color.RED);
SellPlot.SetPaintingStrategy(PaintingStrategy.BOOLEAN_ARROW_DOWN);

# Plot Yellow Arrow for True 1 (All Stochastics Below 20)
plot True1Plot = true1;
True1Plot.SetDefaultColor(Color.YELLOW);
True1Plot.SetPaintingStrategy(PaintingStrategy.BOOLEAN_ARROW_DOWN);

# Plot Blue Arrow for True 3 (Full Stochastic Above 80)
plot True3Plot = true3;
True3Plot.SetDefaultColor(Color.BLUE);
True3Plot.SetPaintingStrategy(PaintingStrategy.BOOLEAN_ARROW_UP);

# Plot MACD Value and Signal for Debugging
plot MACDLine = macdValue;
MACDLine.SetDefaultColor(Color.WHITE);

plot SignalLine = macdSignal;
SignalLine.SetDefaultColor(Color.ORANGE);
Hi, I was trying but failed to identify the true high and low before each price movement reversal. The best I can do is to have multiple highs and lows as attached below. What I actually need is just these circled in yellow. That being said, I just need to see 4 values of 5830, 5724, 527.25 and 5724.25 on the chart, the remaining numbers should not be plotted on the chart. Here is my script. Can someone with more experience and knowledge help please? Thanks in advance.
# Identify True High and Low
# Created on Dec 12, 2024 by RZ
# Version 20241212001
# Define Lookback Period
input lookbackPeriod = 5;
# Identify Potential Highs and Lows
def potentialHigh = high == Highest(high, lookbackPeriod);
def potentialLow = low == Lowest(low, lookbackPeriod);
# State Variables for Confirming Highs and Lows
rec lastConfirmedHigh = if potentialHigh and (IsNaN(lastConfirmedHigh[1]) or high > lastConfirmedHigh[1]) then high else lastConfirmedHigh[1];
rec lastConfirmedLow = if potentialLow and (IsNaN(lastConfirmedLow[1]) or low < lastConfirmedLow[1]) then low else lastConfirmedLow[1];
# Alternation Logic
def confirmedHigh = potentialHigh and low > lastConfirmedLow[1];
def confirmedLow = potentialLow and high < lastConfirmedHigh[1];
your code is only looking at previous bars to find a peak.
so if you find a high, the next bar may be a higher high, then you have multiple peaks.
need to also look at future bars.
useThinkScript is the #1 community of stock market investors using indicators and other tools to power their trading strategies. Traders of all skill levels use our forums to learn about scripting and indicators, help each other, and discover new ways to gain an edge in the markets.
How do I get started?
We get it. Our forum can be intimidating, if not overwhelming. With thousands of topics, tens of thousands of posts, our community has created an incredibly deep knowledge base for stock traders. No one can ever exhaust every resource provided on our site.
If you are new, or just looking for guidance, here are some helpful links to get you started.
VIP members get exclusive access to these proven and tested premium indicators: Buy the Dip, Advanced Market Moves 2.0, Take Profit, and Volatility Trading Range. In addition, VIP members get access to over 50 VIP-only custom indicators, add-ons, and strategies, private VIP-only forums, private Discord channel to discuss trades and strategies in real-time, customer support, trade alerts, and much more. Learn all about VIP membership here.
How can I access the premium indicators?
To access the premium indicators, which are plug and play ready, sign up for VIP membership here.