Unusual Volume For ThinkOrSwim

BenTen

Administrative
Staff member
Staff
VIP
Lifetime
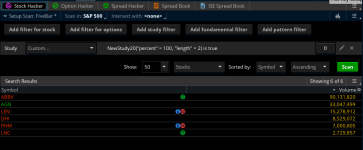
Here is a scanner that will help you screen for stocks with unusual volume in ThinkorSwim. When a stock suddenly increased or decreased in trading volume, that means it's being traded at an unexpectedly high level and a lot of traders often take advantage of this.

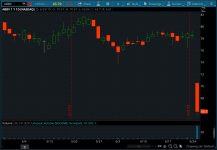
Create a new indicator in ThinkorSwim and import this code. You can add it to your chart but it won't do anything to it. Switch over to the Scan tab and look up the name of your indicator. From there you can scan for stocks that are increasing or decreasing in trading volume. You can also adjust the percentage (%) and length.

vI0osbR.png

CGFmLwm.png


thinkScript Code

Code:
# UNUSUALVOLUME
# DREWGRIFFITH15 (C) 2014

input price = volume;
input choice = {default increased, decreased};
input percent = 10;
input length = 50;
def avg = average(price, length)[1];
def chg = 100 * (price/avg -1);
plot scan;

switch (choice) {
case increased:
    scan = chg >= percent;
case decreased:
    scan = chg <= -percent;
}

Shareable Link

https://tos.mx/msxN1Z

Credit
  • hwrdprkns
 

Attachments

  • vI0osbR.png
    vI0osbR.png
    67.5 KB · Views: 261
  • CGFmLwm.png
    CGFmLwm.png
    75.7 KB · Views: 274

Join useThinkScript to post your question to a community of 21,000+ developers and traders.

To augment the above scan, take a look at putting Stock Sizzle and Sizzle Index as 2 columns in the watch list. That way you can compare if the stock volume was also followed by high options activity. Just a thought, cause it's what I use for every scan.
 
Here is an extreme volume scanner based on a standard deviation envelope

Code:
# Extreme Volume Scan
# Set to Daily Aggregation

# This script picks up abnormal volume over a period of time. Much more likely to be a large trader taking a position

def v = if isNaN(volume) then v[1] else volume;
def norm = Average(volume, 50);
def SD = StDev(v, 50);
def Upper = norm + SD;
def Lower = norm - SD;
def Extreme = (v - Lower) / (Upper - Lower) * 100;
plot cond = if Extreme > 100 then 1 else 0;
 
Great...but is this an actual RELATIVE scan? For example...does it compare 1pm on Thursday to the last 20 1pm bars going back Wed Tues Monday etc...

All volume indicators don't say much unless they can actually compare last 20 "hour to hour" (not last 20 hours). Most morning opening hours are inflated as well as closing hours.
 
@toncuz The code I posted is an EXTREME volume scan by looking at volume bursts beyond a standard deviation move. Not relative volume as you described though.

@rahul_4u40 Hey, no problem. Here's a scan for stocks with volume spiking at least 300% above the 50 day volume moving average

Code:
def VA = VolumeAvg(50).VolAvg;
plot scan = volume > 3 * VA;

Just for grins, I just ran a scan on the S&P 500 (daily) aggregation and found 6 stocks that met this criteria
Tickers: ADSK, CELG, DE, DLTR, KEYS, UA

Load these tickers on your chart (daily) aggregation and watch those volumes!
Now that's what I call a real spike. Have fun
 
Somebody can helpme with and indicator to change color of a volume bars, depending of the pattern.

1.- Color ORANGE if the bar is grater than the first bar of the day.
2.- Color WHITE to the pattern if we have 3 consecutive bars any color down.
3.- Color BLUE to the pattern if we have 3 consecutive red bars growing.
4.- Color CYAN to the pattern if we have a range of 5 or more combined bars

Thanks for your help, if i need to pay for this please tellme how much i cost.
 
@toncuz I thought that this was covered before but just in case, here goes:

Can you cite a CMT that agrees with your point of view? JC Parets doesn't even use volume on his charts. That doesn't make him right, but with a large corporate clientele and 55,000 twitter followers I'd say people listen to him.

I don't know of any trading platform that offers volume as you describe it, please correct me. Most do have VWAP. You might want to look at VWAP. VWAP is used by day traders and swing traders and it taught in order to pass the CMT exam. A wise mathematician told me and others many times that each day, for day traders, it is a coin flip. Relative volume will tell you little to nothing because comparing 1pm today from 1pm last week Wednesday each have distinct news events and institutional rotation among a host of other items. Just because volume is higher or lower doesn't tell anyone if a stock is being accumulated or not. I could be short sellers covering.

You might want to look at VWAP. VWAP is used by day traders and swing traders and it taught in order to pass the CMT exam. In the end, you are free to have your own ideas. I just can't see this one having credence. Have a good holiday.
 
Last edited:
Let's say I have multiple charts for different tickers. Can someone direct me to a notification study where one of the tickers have a sudden candle rip or tank? like let's say by $1.00 (this could be user defined)?

hmmm how would one put a notification with this indicator. I don't need the bottom part, just want it to indicate the huge drop or spike.
 
Last edited:
I am trying to find a reliable volume indicator that I can incorporate into my nightly scans looking for stocks that are moving higher. I have used the unusual volume indicator in TOS. I just wondering if anyone has found something better?
 
Hello all - does anyone know of a scan that shows results for unusual volume / increased volume in the final trading hour for consecutive X number of days?

Code:
# UNUSUAL VOLUME:

def vol = volume;
def perc = 25;
def len = 30;
def avg = average(vol, len)[1];
def chg = 100*(vol/avg -1);

def UnusualVol = chg >= perc;

#PRICE CHANGE:

def price = close;
def percent = 5.0;
def length = 2;
def x = 100*(price / price[length]-1);

def PriceChng = x >= percent;

#Either #PRICE CHANGE Or #UNUSUAL VOLUME
 
is there any scanner available that gives stock name that's price sudden spike in less amount of time for example 5 second. Thank you
 
I’m Day Trader and I’m looking for a script to find stocks (Scan) that the volume bar on the 1 Min chart is 3 times higher from the 50 VolumeAvg.
I couldn’t find anything like that in TOS.

I have created several scan queries such as % Gain > 7, Unusual Volume on the 5-min aggr, and Close Crosses Above EMA 9 on the 5 min. I also created corresponding dynamic watchlists from the scan queries. The results appear just fine when I load and run them in the Stock Hacker scanner, but the watchlists update very slowly, with long time lags between. I understand this lag is "inevitable." But does anyone know of a work-around?
 
I trying to make a simple scan or watch list that would output stocks based on their weekly volume. Or monthly etc. I could also use this same technique to easily see the percent change on the week/month/year for a list of stocks. I could be missing something simple, but I feel like this might require some custom code. Let me know what you guys think! Thanks!!
 
I am looking to build a scanner that scans for 200% average volume in the first 5 min candle compared to the average 5 minute candle at open.

How do I go about this? Also, how to create thinkscript to find unusual volume by minute. For example if one stock trading higher and volume is mostly 50-100% more than previous minute then alert it.
 
I am new user to this group, may I know how can I see only unusual buy volume ? This is what exactly I am looking for, please let me know if you find something. I think this won't be possible in TOS, we need to probably build some external application to meet this requirements.

After some research I found this is possible in ToS, if you become a VIP member you can chat with Admin or developers in discord and get this done within 1 or 2 days.
 
  • Scan unusual buy volume for a range of 10-20 days at opening time 9.30am (Some stocks are purchased at the opening time in a very unusual fashion)
  • Scan stocks that has higher % of opening buying volume in a average of 20-30 days. (Some stocks are purchased 5x times on a day than average, this indicates if the stock is going to rock)
Example: MVIS stock on May 4th 2020 and May 5th had a very unusual opening buy volume and it was a very clear indicator.
 
Last edited:
Unusual Volume near 52 weeks high scanner: https://tos.mx/qksBhga

9Dlvd5q.png


1. Near 52 week high indicates strength
2. Unusual volume indicates current interest at peak
3. Sorting on Zscore or DMI oscillator --> intraday strength
4. Sustained momentum --> Daily and weekly RSI >60
5. Green on E1, E5, E15, E30, E4h --> strength
6. Chart Observations -> REGN is a good candidate at this time
7. Only possibility, it can change any time

yw1Y3fI.png


zqe8osh.png


My ThinkorSwim workspace: https://tos.mx/aIZeT6k

The basic concept of Z-Score is that it’s an oscillator denominated in standard deviations from the VWAP mean.
 
Last edited by a moderator:
Is there an easy way to add a label to the upper chart? something like:

[Today's Accumulated Volume is 5% Greater Than Average of Last 30 Days]

Yes, that label is longer than it needs to be, but wanted to be specific. That way the label could update the % throughout the day. The 'last 30 days' part would of course be there based on the input (user selected).

Example:
  • Stock ABC has an Average Daily Volume over the last 30 Days = 1,000,000.
  • At 1130am (or whatever time as we go throughout the trading day), the accumulated volume is at 1,100,000 (10% greater than the average).
  • So if I had a scan set to 'current accumulated volume greater than 5% of 30 day average', Stock ABC would pop up.
Essentially, trying to have stocks pop-up 'real-time' in the scan AND also have a painted label so I could see it visually while I am going thru tickers throughout the day.

@BenTen - please tell me you've already got this! :)
 
Last edited:
The biggest challenge is to know early enough "high unusual volume" as stock opens in morning . As I understand I see "volume total for the day" but not the time when stock opens for that time frame or bar . How do I know that particular stock is going to have high volume early so I can trade the stock for profit. Please guide me I am new for all this.
Thanks.
 

Similar threads

Not the exact question you're looking for?

Start a new thread and receive assistance from our community.

87k+ Posts
392 Online
Create Post

Similar threads

Similar threads

The Market Trading Game Changer

Join 2,500+ subscribers inside the useThinkScript VIP Membership Club
  • Exclusive indicators
  • Proven strategies & setups
  • Private Discord community
  • ‘Buy The Dip’ signal alerts
  • Exclusive members-only content
  • Add-ons and resources
  • 1 full year of unlimited support

Frequently Asked Questions

What is useThinkScript?

useThinkScript is the #1 community of stock market investors using indicators and other tools to power their trading strategies. Traders of all skill levels use our forums to learn about scripting and indicators, help each other, and discover new ways to gain an edge in the markets.

How do I get started?

We get it. Our forum can be intimidating, if not overwhelming. With thousands of topics, tens of thousands of posts, our community has created an incredibly deep knowledge base for stock traders. No one can ever exhaust every resource provided on our site.

If you are new, or just looking for guidance, here are some helpful links to get you started.

What are the benefits of VIP Membership?
VIP members get exclusive access to these proven and tested premium indicators: Buy the Dip, Advanced Market Moves 2.0, Take Profit, and Volatility Trading Range. In addition, VIP members get access to over 50 VIP-only custom indicators, add-ons, and strategies, private VIP-only forums, private Discord channel to discuss trades and strategies in real-time, customer support, trade alerts, and much more. Learn all about VIP membership here.
How can I access the premium indicators?
To access the premium indicators, which are plug and play ready, sign up for VIP membership here.
Back
Top