Repaints Trend Reversal for ThinkorSwim

Repaints
Status
Not open for further replies.
@hurricane5 It's fairly simple to do it. Add the code as an indicator (but do not use it on your chart since it's intended to be used in the Scan tab). Once you have it added, switch over to the Scanner section.


Click on Add Study Filter > Study > type in the name of the indicator > and select upArrow or downArrow.

Like this:

DGntbAS.png
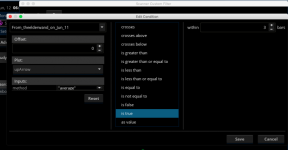
Hi there, Do we just change the Plot to "DownArrow" if we want to scan for the reversal within 3bars? Do we need to change the codes?
 

Attachments

  • DGntbAS.png
    DGntbAS.png
    66.6 KB · Views: 92

Volatility Trading Range

VTR is a momentum indicator that shows if a stock is overbought or oversold based on its Weekly and Monthly average volatility trading range.

Download the indicator

Would you mind sharing the indicators your using in this screen shot

Top - MOBO short term(8) and long term(50) and Pivot Break
Middle - RSI Laguerre (default settings)
Bottom - Momentum Squeeze (default settings)
 
Last edited:
What does MOBO mean?

MOBO = Momentum Breakout. Long term is 50 not 5 sorry for the typo.

Code:
## EMA with MOBO attached
# MOBO = Momentum breakout
declare upper;

input price = close;

input length = 13;#8
input displace = 0;
# MOBO parameters
input ColoredMobo = yes;
input ColoredFill = yes;

input MOBO_midline = no;
input MOBO_displace = 0;
input MOBO_length = 10;
input Num_Dev_Dn = -0.8;
input Num_Dev_Up = +0.8;

def AvgExp = ExpAverage(price[-displace], length); # default is an 8 bar EMA (JQ)
#AvgExp.DefineColor("Up", CreateColor( 0, 220, 0));
#AvgExp.DefineColor("Down",  Color.MAGENTA);
#AvgExp.AssignValueColor(if AvgExp > AvgExp[1] and AvgExp[1] > AvgExp [2] and AvgExp[2] > AvgExp[3] and AvgExp[3] > AvgExp[4] then AvgExp.Color("Up") else if AvgExp < AvgExp[1] and AvgExp[1] < AvgExp [2] and AvgExp[2] < AvgExp[3] and AvgExp[3] < AvgExp[4] then AvgExp.Color("Down") else color.YELLOW);
#AvgExp.SetLineWeight(3);
#AvgExp.HideBubble();

def Midline = Average (data = AvgExp, MOBO_length); # the default is a 10 bar SMA of the previously calculated 8 bar EMA of close
def sDev = StDev(data = AvgExp[-MOBO_displace], length = MOBO_length);
def LowerBand = Midline + Num_Dev_Dn * sDev;
def UpperBand = Midline + Num_Dev_Up * sDev; # effectively creates an exponential Bollinger with .8 StdDev bands

def MoboStatus =
if UpperBand >= UpperBand[1] then 2 # Mobo Up
else
if LowerBand < LowerBand[1] then -2 # Mobo Down
else 0; # between the bands

rec BreakStatus = CompoundValue(1,
if BreakStatus[1] == MoboStatus or MoboStatus == 0 then BreakStatus[1]
else
if MoboStatus == 2 then 2
else -2, 0);

plot MidlineP =
if MOBO_midline then Midline
else Double.NaN;
MidlineP.SetDefaultColor(GetColor(1));
MidlineP.HideBubble();

plot UpperBandP = UpperBand;
UpperBandP.AssignValueColor (
if !ColoredMobo then Color.WHITE
else
if BreakStatus[0] == 2 then Color.green
else Color.red);
UpperBandP. SetLineWeight(1);
UpperBandP.HideBubble();

plot LowerBandP = LowerBand;
LowerBandP.AssignValueColor (
if !ColoredMobo then Color.WHITE
else
if BreakStatus[0] == 2 then Color.green
else Color.red);
LowerBandP.SetLineWeight(1);
LowerBandP.HideBubble();


# colored clouds
plot GreenUpper = if ColoredFill and BreakStatus[0] == 2 then
UpperBandP else Double.NaN;
GreenUpper.SetDefaultColor(CreateColor(0, 230, 0));
plot GreenLower = if ColoredFill and BreakStatus[0] == 2 then
LowerBandP else Double.NaN;
GreenLower.SetDefaultColor(CreateColor(0, 230, 0));
AddCloud (GreenUpper, GreenLower, Color.green, Color.RED);


plot RedUpper = if ColoredFill and BreakStatus[0] == -2 then
UpperBandP else Double.NaN;
RedUpper.SetDefaultColor(CreateColor(230, 0, 0));
plot RedLower = if ColoredFill and BreakStatus[0] == -2 then
LowerBandP else Double.NaN;
RedLower.SetDefaultColor(CreateColor(230, 0, 0));
AddCloud (RedUpper, RedLower, Color.red, Color.RED);
#end
 
One is not better than the other. Is more about your style and what you find the most useful. I trade only CL (oil) using tick and range charts so MOBO works best for my style of trading.
 
Ben mentioned that with Supertrend you don't get much time to act on it.
I do like the way Supertrend paints the bars red/green depending on trend.
But for intraday trading I'm not so sure of their usefulness, but don't have enough experience with these indicators.

S85.png
 
Last edited:
Top - MOBO short term(8) and long term(50) and Pivot Break
Middle - RSI Laguerre (default settings)
Bottom - Momentum Squeeze (default settings)
@mc01439 I understand that you are trading \CL, but why did you change from Hull to Exponential in your MOBO? Slim Miller uses Hull, which is default . For learning sake...

Could you share the code and .mx for your RSI Laguerre? Thanks!
 
Last edited:
@mc01439 I understand that you are trading \CL, but why did you change from Hull to Exponential in your MOBO? Slim Miller uses Hull, which is default . For learning sake...

Could you share the code and .mx for your RSI Laguerre? Thanks!

I prefer Exponential because it seems to fit my needs better than Hull with (CL) and the tick charts I use.

https://tos.mx/DEE1WR - this is by Mobius. I do not use the gamma or FE line.

Instead I use on a different screen an indicator called Choppiness Index. This indicator is outlined in TASA May 2012. https://tos.mx/W9hbuC

Choppiness and Gamma are used the same why, replaced with Choppiness a week or so ago and use it in tick, 10 min, 30 min and 1hour. Screen was too busy with Gamma.
 
Last edited:
@markos if you don't mind me asking, i understand the concept of the gamma and fractal energy but i cannot understand how the laguerre rsi would help especially in day trading. could you enlighten me plz. i am having hard time understanding the laguerre rsi. thanks
Cherif, I know this was asked a few threads ago, but I wanted to answer it. Laguerre Time is a time transformation model, the actual math looks like Greek to me. That said, Laguerre Time speeds up or slows down the indicator that it is used on depending on the "speed" of the underlying. I hope that helps.
 
@mc01439 What is that indicator by Mobius (saw an interesting entry point when I tried it) and the Choppiness Index one?

Is there a website/page for each?
 
@mc01439 What is that indicator by Mobius (saw an interesting entry point when I tried it) and the Choppiness Index one?

Is there a website/page for each?

Morbius RSI Laguerre - the entry is a break up of the .20 line and a break down of the .80 line.

def entry = if RSI crosses above oversold or rsiu[1] == 0 and RSI crosses above overbought
then close
else if RSI crosses below overbought or rsiu[1] and RSI crosses below oversold
then close
else entry[1];

The target is a 1.5 ATR target

def target = if RSI crosses above oversold or rsiu[1] == 0 and RSI crosses above overbought
then Round((close + (1.5 * atr)) / TickSize(), 0) * TickSize()
else if RSI crosses below overbought or rsiu[1] and RSI crosses below oversold
then Round((close - (1.5 * atr)) / TickSize(), 0) * TickSize()
else target[1];

I added short and long term CCI but commented them out when I posted.

Not much out on the Choppiness. The best information is in the TASA May 2012 issue
 
@mc01439 What is that indicator by Mobius (saw an interesting entry point when I tried it) and the Choppiness Index one?

Is there a website/page for each?
@thinky, you may have to do what I just did this morning. Go from the beginning and read all of the entries on all 8 pages.
I found things there that I forgot that I had answered.

1. In the tutorial section, there is an explanation of how the RSI Laguerre has been used. Instead of using the RSI Laguerre with fractal energy, I broke them out and used the RSI Laguerre and the Chop indicator separately.

2. @mc01439 is correct in what he has been saying above. Further, Fractal Energy and Chop indicator use different math but come up with very close to the same result depending on their settings.

3. Type the word Universe in the search box above and spend a number of hours in there and you will find many further explanations of RSI Laguerre. More information on the chop indicator should be able to be found on tradingview dot com or possibly on YouTube under TheoTrade.

4. Please ignore the ATR target that Mobius put in. He never meant to share it, and he never explained how he used it. You would be best served to comment out (#) in front of each line of code that deals with the ATR target in that study.
 
Last edited:
FYI: Mobius has been coding on TOS since the day they opened.
Here is a Snippett that gives Mobius' insight into RSI Laguerre Time Transform with FE (Fractal Energy).
More can be found, just type Universe in the Search box and spend several hour, days or weeks there.

Usage Notes
Notes from zztop:

DISCLAIMER: Mobius mentioned that it was not his habit to give trading advice or even advice on how to use indicators. However, there's been such a proliferation of bad, inaccurate, false info regarding so many of them recently he felt compelled to give some accurate information.

Mobius©: I use a very simple method – RSI Laguerre and Fractal Energy on a list of very liquid stocks. I look for polarity change and trade when both RSI and FE are in “confluence”. If volatility is high enough I sell spreads if not I buy them. Other than hedging (which I do a lot of) that's it.
I like it simple.

The typical base setting I like to use for the FE is a length of 8. If I'm trading options I like to look at it about the length of time I'm buying or selling the option for. I want to know if it's reverting and where the energy is so I'll use a longer length for reversion and a shorter length to see if energy is building or waning.

If RSI Laguerre is descending and FE over .6, that tells me something is changing and I'm already looking at an equity I've determined is about to make a polarity change. So the worse case that happens is that the security grinds sideways for a few days.

A reading of the FE over .6 is an indication that energy has been built up. If the FE is high (over .6) and RSI LaGuerre is breaking lower FE will follow suit. If RSI reverses and goes above .8 I'm outa there, with the assumption I have a short position.

FE is a gauge of both mean reverting and linearity. Descending readings indicate a trend is on. A reading below .3 indicates exhaustion in trend or near exhaustion. A reading above .6 indicates moving sideways with rapid reversion and energy building for a move again.

Above .6 - Think price compression or squeeze
Below .3 - Think running out of gas

Here's an example:

FE at 60 periods is oscillating around .5 tightly while FE at 8 periods is over .6. Zscore is over 2 and is starting to roll over. That is a good short to the mean.

Short trade setup I look for with RSI Laguerre adjusted with FE:
1) Polarity Change - Equity has gone from making higher highs and higher lows to making a lower high and lower low and is now putting in another lower high
2) RSI Laguerre is above .8 and descending from 1
3) Fractal Energy is below .38 and nose down or above .6 and rolling over. In the first case, below .38, FE is indicating trend exahustion and RSI is likely showing as a peak and not running across pegged at 1. In the second case price has risen to a lower resistance and has been rolling slowly over, building energy.
END of SNIPPET
 
Status
Not open for further replies.

New Indicator: Buy the Dip

Check out our Buy the Dip indicator and see how it can help you find profitable swing trading ideas. Scanner, watchlist columns, and add-ons are included.

Download the indicator

Similar threads

Not the exact question you're looking for?

Start a new thread and receive assistance from our community.

87k+ Posts
499 Online
Create Post

Similar threads

Similar threads

The Market Trading Game Changer

Join 2,500+ subscribers inside the useThinkScript VIP Membership Club
  • Exclusive indicators
  • Proven strategies & setups
  • Private Discord community
  • ‘Buy The Dip’ signal alerts
  • Exclusive members-only content
  • Add-ons and resources
  • 1 full year of unlimited support

Frequently Asked Questions

What is useThinkScript?

useThinkScript is the #1 community of stock market investors using indicators and other tools to power their trading strategies. Traders of all skill levels use our forums to learn about scripting and indicators, help each other, and discover new ways to gain an edge in the markets.

How do I get started?

We get it. Our forum can be intimidating, if not overwhelming. With thousands of topics, tens of thousands of posts, our community has created an incredibly deep knowledge base for stock traders. No one can ever exhaust every resource provided on our site.

If you are new, or just looking for guidance, here are some helpful links to get you started.

What are the benefits of VIP Membership?
VIP members get exclusive access to these proven and tested premium indicators: Buy the Dip, Advanced Market Moves 2.0, Take Profit, and Volatility Trading Range. In addition, VIP members get access to over 50 VIP-only custom indicators, add-ons, and strategies, private VIP-only forums, private Discord channel to discuss trades and strategies in real-time, customer support, trade alerts, and much more. Learn all about VIP membership here.
How can I access the premium indicators?
To access the premium indicators, which are plug and play ready, sign up for VIP membership here.
Back
Top