Repaints Trend Reversal for ThinkorSwim

Repaints
Status
Not open for further replies.
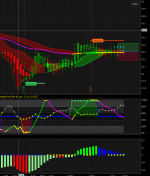
Oil (CL) today is a great example - has been in consolidation all day in my view so I have not taken a trade. Take a look at FE - has shown consolidation for most of the day and supported by other indicators as well.

sj1PSLi.png

Would you mind sharing the indicators your using in this screen shot
 

Attachments

  • sj1PSLi.png
    sj1PSLi.png
    85.9 KB · Views: 216
Last edited by a moderator:

New Indicator: Buy the Dip

Check out our Buy the Dip indicator and see how it can help you find profitable swing trading ideas. Scanner, watchlist columns, and add-ons are included.

Download the indicator

com.devexperts.tos.thinkscript.runtime.TooComplexException: The complexity of the expression suggests that it may not be reliable with real-time data.
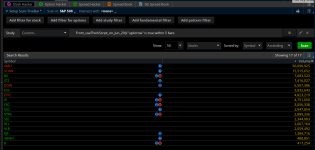
This is the error message I got when trying to set up the Trend Reversal Scanner.
 
@tenacity11 Are you using the scanner from the original thread? If so, are you scanning for both bullish and bearish signals? The scanner only support one direction at a time.
 
Yes the scanner is from the original thread. In setting up a new scan and adding the indicator. I don't see where I can separate to scan for bullish or bearish only.
 
I selected the bullish up Arrow but still getting the same error so.....Could you post the code I need to put into the scan for bullish.
Sorry to be a pain in the patootie :)
 
I selected the bullish up Arrow but still getting the same error so.....Could you post the code I need to put into the scan for bullish.
Sorry to be a pain in the patootie :)

Worked for me.

f2620C2.png
 

Attachments

  • f2620C2.png
    f2620C2.png
    103.4 KB · Views: 179
Ben I appreciate your patience but I duplicated this and still getting the same error message so I give up.
Would have been nice to scan for them.
 
@tenacity11 May want to contact ThinkorSwim support team (you can create a support ticket right from the platform). No reason why you shouldn't be able to scan for reversal signals.
 
i think this indicator is a very good indicator working well on price charts (range charts) & on bigger time frames have very less false signals

i wish i can have a scan or watchlist whereas i can search this signal if appears on 1 hour chart , since daily charts scanner has been alrdy made i have use that scanner but i m more interested in 1 hour chart basis scan whereas it can scan either a watchlist or scan the market and give the ticker in which 1 hour chart is appearing reversal signal up or down both side is okay
 
Ben on the Trend Reversal Indicator is there a way to make the bubbles light colors. I tried to edit the copy changing the colors to light green and light red but it did not change anything. thanks
 
@tenacity11 , to change the color of the bubbles, you have to edit the source code like the following:

Code:
AddChartBubble((barnumber and U1), if isUp then low else high, if showarrows and signal > 0 and signal[1] <= 0 then "Reversal:" + low else "" , if Colorbars == 3 then Color.PLUM else Color.light_green, no);
AddChartBubble((barnumber and D1), if isUp then low else high, if showarrows and signal < 0 and signal[1] >= 0 then "Reversal:" + high else "" , if Colorbars == 3 then Color.PLUM else Color.light_red, yes);
Thank you GeneHo..that worked
 
Status
Not open for further replies.

Volatility Trading Range

VTR is a momentum indicator that shows if a stock is overbought or oversold based on its Weekly and Monthly average volatility trading range.

Download the indicator

Similar threads

Not the exact question you're looking for?

Start a new thread and receive assistance from our community.

87k+ Posts
341 Online
Create Post

Similar threads

Similar threads

The Market Trading Game Changer

Join 2,500+ subscribers inside the useThinkScript VIP Membership Club
  • Exclusive indicators
  • Proven strategies & setups
  • Private Discord community
  • ‘Buy The Dip’ signal alerts
  • Exclusive members-only content
  • Add-ons and resources
  • 1 full year of unlimited support

Frequently Asked Questions

What is useThinkScript?

useThinkScript is the #1 community of stock market investors using indicators and other tools to power their trading strategies. Traders of all skill levels use our forums to learn about scripting and indicators, help each other, and discover new ways to gain an edge in the markets.

How do I get started?

We get it. Our forum can be intimidating, if not overwhelming. With thousands of topics, tens of thousands of posts, our community has created an incredibly deep knowledge base for stock traders. No one can ever exhaust every resource provided on our site.

If you are new, or just looking for guidance, here are some helpful links to get you started.

What are the benefits of VIP Membership?
VIP members get exclusive access to these proven and tested premium indicators: Buy the Dip, Advanced Market Moves 2.0, Take Profit, and Volatility Trading Range. In addition, VIP members get access to over 50 VIP-only custom indicators, add-ons, and strategies, private VIP-only forums, private Discord channel to discuss trades and strategies in real-time, customer support, trade alerts, and much more. Learn all about VIP membership here.
How can I access the premium indicators?
To access the premium indicators, which are plug and play ready, sign up for VIP membership here.
Back
Top