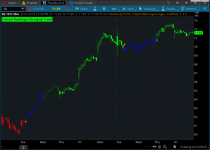
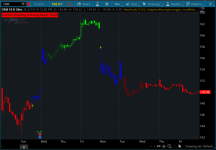
This indicator is based on the work of The Lawyer Trader's Trend_Fuzz study. I just added buy and sell arrows to help you pick your entry points for long and short positions.
Labels are included in the top left-hand corner to let you know the current market condition. When the candles are painted red it means the stock is currently in a downtrend, green candles represent uptrend, and blue candles mean neutral.


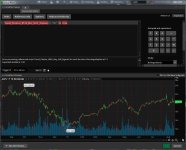
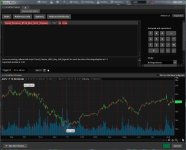
I took out the lower study from the original code. If you want to add it, place this at the end of the script above.
Labels are included in the top left-hand corner to let you know the current market condition. When the candles are painted red it means the stock is currently in a downtrend, green candles represent uptrend, and blue candles mean neutral.
thinkScript Code
Rich (BB code):
input ThermoLookBackBars = 50;
input PlotType = {default AdaptiveMovingAverages, Standard};

def HighLowScore = 1000 * ((high - high[1]) / (high[1]) +
(low - low[1]) / low[1]);

#ATR TrailingStop Code
input trailType = {default modified, unmodified};
input ATRPeriod = 5;
input ATRFactor = 3.5;
input firstTrade = {default long, short};

def HiLo = Min(high - low, 1.5 * Average(high - low, ATRPeriod));
def HRef = if low <= high[1]
    then high - close[1]
    else (high - close[1]) - 0.5 * (low - high[1]);
def LRef = if high >= low[1]
    then close[1] - low
    else (close[1] - low) - 0.5 * (low[1] - high);
def ATRMod = ExpAverage(Max(HiLo, Max(HRef, LRef)), 2 * ATRPeriod - 1);

def loss;
switch (trailType) {
case modified:
    loss = ATRFactor * ATRMod;
case unmodified:
    loss = ATRFactor * Average(TrueRange(high,  close,  low),  ATRPeriod);
}

rec state = {default init, long, short};
rec trail;
switch (state[1]) {
case init:
    if (!IsNaN(loss)) {
        switch (firstTrade) {
        case long:
            state = state.long;
            trail =  close - loss;
        case short:
            state = state.short;
            trail = close + loss;
    }
    } else {
        state = state.init;
        trail = Double.NaN;
    }
case long:
    if (close > trail[1]) {
        state = state.long;
        trail = Max(trail[1], close - loss);
    }
    else {
        state = state.short;
        trail = close + loss;
    }
case short:
    if (close < trail[1]) {
        state = state.short;
        trail = Min(trail[1], close + loss);
    }
    else {
        state = state.long;
        trail =  close - loss;
    }
}

def BuySignal = Crosses(state == state.long, 0, CrossingDirection.ABOVE);
def SellSignal = Crosses(state == state.short, 0, CrossingDirection.ABOVE);

plot TrailingStop = trail;
TrailingStop.Hide();
#End ATR Trailing Stop Code

def A = Highest(high[1], ThermoLookBackBars);
def B = Lowest(low[1], ThermoLookBackBars);

def FiftyTwoWeekHigh = A;

def FiftyTwoWeekLow = B;

def FiftyTwoWeekScore = 10 * (((high
- FiftyTwoWeekHigh) / FiftyTwoWeekHigh) +
((low - FiftyTwoWeekLow) / FiftyTwoWeekLow));

def ThermoScore = ExpAverage(HighLowScore + FiftyTwoWeekScore, ThermoLookBackBars);

input FastLengthShort = 5;
input SlowLengthShort = 15;
input EffRatioShort = 10;
input FastLengthLong = 10;
input SlowLengthLong = 25;
input EffRatioLong = 5;

def AMA = MovAvgAdaptive(ThermoScore, FastLengthShort, SlowLengthShort, EffRatioShort);
def AMA2 = MovAvgAdaptive(ThermoScore, FastLengthLong, SlowLengthLong, EffRatioLong);

plot Line1;
Line1.Hide();
plot Line2;
Line2.Hide();

switch (PlotType) {
case AdaptiveMovingAverages:
    Line1 = AMA;
    Line2 = AMA2;
case Standard:
    Line1 = ThermoScore;
    Line2 = ThermoScore;
}

def InvisibleLine = close * 0;
plot Line3 = InvisibleLine;
Line3.Hide();

def Buy = Line1 > 0 and Line2 < 0 and state == state.long;
def StrongBuy = Line1 > 0 and Line2 >= 0 and state == state.long;
def Sell = Line1 < 0 and Line2 > 0 and state == state.short;
def StrongSell = Line1 < 0 and Line2 <= 0 and state == state.short;

plot GU = BuySignal;
GU.SetPaintingStrategy(PaintingStrategy.BOOLEAN_ARROW_UP);
GU.SetDefaultColor(GetColor(8));
GU.SetLineWeight(2);

plot GX = SellSignal;
GX.SetPaintingStrategy(PaintingStrategy.BOOLEAN_ARROW_DOWN);
GX.SetDefaultColor(GetColor(8));
GX.SetLineWeight(2);

AssignPriceColor(if Buy then Color.DARK_GREEN else if StrongBuy then Color.GREEN else if Sell then Color.DARK_RED else if StrongSell then Color.RED else Color.BLUE);

AddLabel(yes, Concat("Current Reading is ", (if Buy then "Up Trend" else if StrongBuy then "Strong Up Trend" else if Sell then "Down Trend" else if StrongSell then "Strong Down Trend" else "Neutral")),  if Buy then Color.DARK_GREEN else if StrongBuy then Color.GREEN else if Sell then Color.DARK_RED else if StrongSell then Color.RED else Color.GRAY);
Shareable Link
https://tos.mx/kZjt1kI took out the lower study from the original code. If you want to add it, place this at the end of the script above.
Rich (BB code):
declare upper;

input over_bought = 80;
input over_sold = 20;
input KPeriod = 10;
input DPeriod = 10;
input priceH = high;
input priceL = low;
input priceC = close;
input slowing_period = 3;
input smoothingType = {default SMA, EMA};

def lowest_k = Lowest(priceL, KPeriod);
def c1 = priceC - lowest_k;
def c2 = Highest(priceH, KPeriod) - lowest_k;
def FastK = if c2 != 0 then c1 / c2 * 100 else 0;

def FullK;
def FullD;

switch (smoothingType) {
case SMA:
    FullK = Average(FastK, slowing_period);
    FullD = Average(FullK, DPeriod);
case EMA:
    FullK = ExpAverage(FastK, slowing_period);
    FullD = ExpAverage(FullK, DPeriod);
}

def pricefilterup = if close > close[50] then 1 else 0;
def pricefilterdown = if close < close [50] then 1 else 0;

def OverBoughtAdd = if FullK < over_bought and FullK[1] >= over_bought then 1 else 0;
def OverSoldAdd = if FullK > over_sold and FullK[1] <= over_sold then 1 else 0;

def na = Double.NaN;

#Plot arrows
plot up = if StrongBuy and OverSoldAdd  and pricefilterup then low - (3 * TickSize()) else na;
plot down = if StrongSell and OverBoughtAdd and pricefilterdown then high + (3 * TickSize()) else na;
up.SetPaintingStrategy(PaintingStrategy.ARROW_UP);
down.SetPaintingStrategy(PaintingStrategy.ARROW_DOWN);
Attachments
Last edited:


