Trend Painter Indicator With Buy & Sell Signals for ThinkorSwim

BenTen

Administrative
Staff member
Staff
VIP
Lifetime
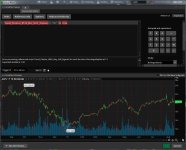
This indicator is based on the work of The Lawyer Trader's Trend_Fuzz study. I just added buy and sell arrows to help you pick your entry points for long and short positions.

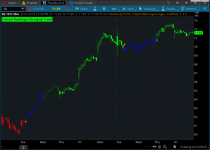
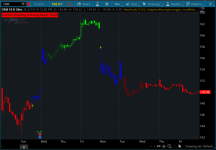
Labels are included in the top left-hand corner to let you know the current market condition. When the candles are painted red it means the stock is currently in a downtrend, green candles represent uptrend, and blue candles mean neutral.

Mu10xA0.png


EZfSLx0.png


thinkScript Code

Rich (BB code):
input ThermoLookBackBars = 50;
input PlotType = {default AdaptiveMovingAverages, Standard};

def HighLowScore = 1000 * ((high - high[1]) / (high[1]) +
(low - low[1]) / low[1]);

#ATR TrailingStop Code
input trailType = {default modified, unmodified};
input ATRPeriod = 5;
input ATRFactor = 3.5;
input firstTrade = {default long, short};

def HiLo = Min(high - low, 1.5 * Average(high - low, ATRPeriod));
def HRef = if low <= high[1]
    then high - close[1]
    else (high - close[1]) - 0.5 * (low - high[1]);
def LRef = if high >= low[1]
    then close[1] - low
    else (close[1] - low) - 0.5 * (low[1] - high);
def ATRMod = ExpAverage(Max(HiLo, Max(HRef, LRef)), 2 * ATRPeriod - 1);

def loss;
switch (trailType) {
case modified:
    loss = ATRFactor * ATRMod;
case unmodified:
    loss = ATRFactor * Average(TrueRange(high,  close,  low),  ATRPeriod);
}

rec state = {default init, long, short};
rec trail;
switch (state[1]) {
case init:
    if (!IsNaN(loss)) {
        switch (firstTrade) {
        case long:
            state = state.long;
            trail =  close - loss;
        case short:
            state = state.short;
            trail = close + loss;
    }
    } else {
        state = state.init;
        trail = Double.NaN;
    }
case long:
    if (close > trail[1]) {
        state = state.long;
        trail = Max(trail[1], close - loss);
    }
    else {
        state = state.short;
        trail = close + loss;
    }
case short:
    if (close < trail[1]) {
        state = state.short;
        trail = Min(trail[1], close + loss);
    }
    else {
        state = state.long;
        trail =  close - loss;
    }
}

def BuySignal = Crosses(state == state.long, 0, CrossingDirection.ABOVE);
def SellSignal = Crosses(state == state.short, 0, CrossingDirection.ABOVE);

plot TrailingStop = trail;
TrailingStop.Hide();
#End ATR Trailing Stop Code

def A = Highest(high[1], ThermoLookBackBars);
def B = Lowest(low[1], ThermoLookBackBars);

def FiftyTwoWeekHigh = A;

def FiftyTwoWeekLow = B;

def FiftyTwoWeekScore = 10 * (((high
- FiftyTwoWeekHigh) / FiftyTwoWeekHigh) +
((low - FiftyTwoWeekLow) / FiftyTwoWeekLow));

def ThermoScore = ExpAverage(HighLowScore + FiftyTwoWeekScore, ThermoLookBackBars);

input FastLengthShort = 5;
input SlowLengthShort = 15;
input EffRatioShort = 10;
input FastLengthLong = 10;
input SlowLengthLong = 25;
input EffRatioLong = 5;

def AMA = MovAvgAdaptive(ThermoScore, FastLengthShort, SlowLengthShort, EffRatioShort);
def AMA2 = MovAvgAdaptive(ThermoScore, FastLengthLong, SlowLengthLong, EffRatioLong);

plot Line1;
Line1.Hide();
plot Line2;
Line2.Hide();

switch (PlotType) {
case AdaptiveMovingAverages:
    Line1 = AMA;
    Line2 = AMA2;
case Standard:
    Line1 = ThermoScore;
    Line2 = ThermoScore;
}

def InvisibleLine = close * 0;
plot Line3 = InvisibleLine;
Line3.Hide();

def Buy = Line1 > 0 and Line2 < 0 and state == state.long;
def StrongBuy = Line1 > 0 and Line2 >= 0 and state == state.long;
def Sell = Line1 < 0 and Line2 > 0 and state == state.short;
def StrongSell = Line1 < 0 and Line2 <= 0 and state == state.short;

plot GU = BuySignal;
GU.SetPaintingStrategy(PaintingStrategy.BOOLEAN_ARROW_UP);
GU.SetDefaultColor(GetColor(8));
GU.SetLineWeight(2);

plot GX = SellSignal;
GX.SetPaintingStrategy(PaintingStrategy.BOOLEAN_ARROW_DOWN);
GX.SetDefaultColor(GetColor(8));
GX.SetLineWeight(2);

AssignPriceColor(if Buy then Color.DARK_GREEN else if StrongBuy then Color.GREEN else if Sell then Color.DARK_RED else if StrongSell then Color.RED else Color.BLUE);

AddLabel(yes, Concat("Current Reading is ", (if Buy then "Up Trend" else if StrongBuy then "Strong Up Trend" else if Sell then "Down Trend" else if StrongSell then "Strong Down Trend" else "Neutral")),  if Buy then Color.DARK_GREEN else if StrongBuy then Color.GREEN else if Sell then Color.DARK_RED else if StrongSell then Color.RED else Color.GRAY);

Shareable Link

https://tos.mx/kZjt1k

I took out the lower study from the original code. If you want to add it, place this at the end of the script above.

Rich (BB code):
declare upper;

input over_bought = 80;
input over_sold = 20;
input KPeriod = 10;
input DPeriod = 10;
input priceH = high;
input priceL = low;
input priceC = close;
input slowing_period = 3;
input smoothingType = {default SMA, EMA};

def lowest_k = Lowest(priceL, KPeriod);
def c1 = priceC - lowest_k;
def c2 = Highest(priceH, KPeriod) - lowest_k;
def FastK = if c2 != 0 then c1 / c2 * 100 else 0;

def FullK;
def FullD;

switch (smoothingType) {
case SMA:
    FullK = Average(FastK, slowing_period);
    FullD = Average(FullK, DPeriod);
case EMA:
    FullK = ExpAverage(FastK, slowing_period);
    FullD = ExpAverage(FullK, DPeriod);
}

def pricefilterup = if close > close[50] then 1 else 0;
def pricefilterdown = if close < close [50] then 1 else 0;

def OverBoughtAdd = if FullK < over_bought and FullK[1] >= over_bought then 1 else 0;
def OverSoldAdd = if FullK > over_sold and FullK[1] <= over_sold then 1 else 0;

def na = Double.NaN;

#Plot arrows
plot up = if StrongBuy and OverSoldAdd  and pricefilterup then low - (3 * TickSize()) else na;
plot down = if StrongSell and OverBoughtAdd and pricefilterdown then high + (3 * TickSize()) else na;
up.SetPaintingStrategy(PaintingStrategy.ARROW_UP);
down.SetPaintingStrategy(PaintingStrategy.ARROW_DOWN);
 

Attachments

  • Mu10xA0.png
    Mu10xA0.png
    344.4 KB · Views: 241
  • EZfSLx0.png
    EZfSLx0.png
    322.5 KB · Views: 233
Last edited:
I think I gave you the wrong code, here is the right one if you're using the first script.

Code:
# Alerts
Alert(GU, " ", Alert.Bar, Sound.Chimes);
Alert(GX, " ", Alert.Bar, Sound.Bell);

All you have to do is add it to the bottom of your existing indicator. An alert will be sent to you through your ToS platform.
 
@coolice521 What do you mean by that? If you want to get alert for any stock it must be running on the chart. You can make a grid chart (a layout that you can add view multiple stocks at the same time) and have them running. When there is a new signal on any of the stocks on those charts ToS will send you an alert.
 
i add a alert why it is wrong ? please tell me thank you so much


11sBNZT.jpg
 

Attachments

  • 11sBNZT.jpg
    11sBNZT.jpg
    124.4 KB · Views: 154
how to get alert for any stock that is not running on the chart?
i want to get alert for stock that is on the watchlist
thank you
 
@coolice521 Not possible unless you create a scanner and save it as a watchlist. ToS scanner that is saved as a watchlist is a bit delayed so there is that.
 
@coolice521 Like I mentioned earlier, the code I sent you is supposed to be added to the bottom of the Trend Painter script.
 
Hi Guys. Im new here so hello to all.
I was wondering is it possible to have the the blue removed from this code. Just have Green/ Bull and Red /bear signals. These candles go from blue to green and visa versa. Looking to make it a cleaner/faster read if possible ?
 
Last edited by a moderator:
@greentonic I have just looked through the code. While it is indeed possible to do as requested, please note that @BenTen posted the code with FIVE different colors depending on the measured momentum as follows. Think he enhanced the code by adding buy/sell arrows, based on the original design of the code

Code:
DARK_GREEN      Buy
GREEN           Strong Buy
DARK_RED        Sell
RED             Strong Sell
BLUE            Otherwise


Think of the BLUE as amber color at a traffic light signal, it is warning you that something is about to change.
By changing the color scheme to a two COLOR green/red in my opinion would not give you the underlying sentiment of the momentum
However if you like to do so, all you need to do is to modify the AssignPriceColor statement in the code
 
Last edited:
Hi @tomsk. Thanks 4 the replay. I have tried to modify the AssignPriceColor but seem to run into errors. I understand that the blue is a weakness signal how ever i find the bull/bear cross over plenty to place a trade $CCCL .3min 12/13/19 is an example of what im talking about.Nice long signal 7am then short signal 9.51am 2 trades/ 2 wins
 
Post your AssignPriceColor statement that you're having trouble with and let's take a look
 
if i remove the IF ELSE BLUE its a no go..
AssignPriceColor(if Buy then Color.DARK_GREEN else if StrongBuy then Color.GREEN else if Sell then Color.DARK_RED else if StrongSell then Color.RED );

error code syntax error. an 'else" block expected at 130/120
 
Ah, you got a syntax problem. Try the following, you need a trailing ELSE for a "catch-all"

AssignPriceColor(if Buy then Color.DARK_GREEN else if StrongBuy then Color.GREEN else if Sell then Color.DARK_RED else if StrongSell then Color.RED else Color.CURRENT);
 
Just helping you with syntax, you need to define your own logic conditions.
The code editor should no longer complain at this point
Most folks use the version that @BenTen posted, it works just fine.
 
@greentonic Try using the buy and sell signals located in the plot settings. GU & GX. You can set up buy and sell signals using a arrow and make it whatever color you want. I have had some good success on the 15,30,1 hour charts. Patience is required you will likely only get one signal a day on 30 min chart.
 

Join useThinkScript to post your question to a community of 21,000+ developers and traders.

Similar threads

Not the exact question you're looking for?

Start a new thread and receive assistance from our community.

87k+ Posts
413 Online
Create Post

Similar threads

Similar threads

The Market Trading Game Changer

Join 2,500+ subscribers inside the useThinkScript VIP Membership Club
  • Exclusive indicators
  • Proven strategies & setups
  • Private Discord community
  • ‘Buy The Dip’ signal alerts
  • Exclusive members-only content
  • Add-ons and resources
  • 1 full year of unlimited support

Frequently Asked Questions

What is useThinkScript?

useThinkScript is the #1 community of stock market investors using indicators and other tools to power their trading strategies. Traders of all skill levels use our forums to learn about scripting and indicators, help each other, and discover new ways to gain an edge in the markets.

How do I get started?

We get it. Our forum can be intimidating, if not overwhelming. With thousands of topics, tens of thousands of posts, our community has created an incredibly deep knowledge base for stock traders. No one can ever exhaust every resource provided on our site.

If you are new, or just looking for guidance, here are some helpful links to get you started.

What are the benefits of VIP Membership?
VIP members get exclusive access to these proven and tested premium indicators: Buy the Dip, Advanced Market Moves 2.0, Take Profit, and Volatility Trading Range. In addition, VIP members get access to over 50 VIP-only custom indicators, add-ons, and strategies, private VIP-only forums, private Discord channel to discuss trades and strategies in real-time, customer support, trade alerts, and much more. Learn all about VIP membership here.
How can I access the premium indicators?
To access the premium indicators, which are plug and play ready, sign up for VIP membership here.
Back
Top