
Update: I got this one and another one with different information. there seems to be several versions of this indicator. I am not getting any lower indicators.I am very confused. I would like to have this indicator with the indicators you are showing in this post. I have uploaded 4 sets of codes and I am getting bits and pieces of the indicators on the charts. Do you have code that will give me most of the chart indicators?
You are using an out of date browser. It may not display this or other websites correctly.
You should upgrade or use an alternative browser.
You should upgrade or use an alternative browser.
The Confirmation Trend Chart Setup | The End All Be All | For ThinkOrSwim
- Thread starter HODL-Lay-HE-hoo!
- Start date
- Status
- Not open for further replies.
Join useThinkScript to post your question to a community of 21,000+ developers and traders.

Can someone help point me to a Watch List Colum script for arrows and dots please? I see one that's close to what I am looking for https://usethinkscript.com/threads/triple-exhaustion-indicator.9001/ but it would be nice to have watchlist Colum that can show tickers with arrows and dots condition.
Ah I hear you… the post “chart styles” is the set of indicators https://usethinkscript.com/threads/...-all-be-all-for-thinkorswim.15257/post-124229Update: I got this one and another one with different information. there seems to be several versions of this indicator. I am not getting any lower indicators.
I cannot provide a WL column for the green and red arrows as the code is too complex - if you wish to know why see this post under "SPARK" https://usethinkscript.com/threads/...-all-be-all-for-thinkorswim.15257/post-124230View attachment 18920
Can someone help point me to a Watch List Colum script for arrows and dots please? I see one that's close to what I am looking for https://usethinkscript.com/threads/triple-exhaustion-indicator.9001/ but it would be nice to have watchlist Colum that can show tickers with arrows and dots condition.
I could make a version of the spark arrows that only accounts for the EMAs (which is similar to what I did with the NON mtf C3_Max_Spark with 4 spark labels (which simply use values for the EMAs that are the equivalent to the higher TF)
I will post the code and share link for Triple Exhaustion "dots" - that being said I stopped using it as a WL column for lower TF and now only use it for higher TF.
here you go: https://usethinkscript.com/threads/...-all-be-all-for-thinkorswim.15257/post-124254
Last edited:
Sheeeesh love this lower...
How can you make those cyan lines appear?Sheeeesh love this lower...
Those are under drawing tools… I manually draw them on the chart.How can you make those cyan lines appear?
How can you make those cyan lines appear?
Sheeeesh love this lower...
Do you mind sharing your chart?
Last edited by a moderator:
Justus Agenstem
Member
I've imported a couple of these watchlists, but then I'm unable to find them and get them to show as a watchlist...what is it that I'm missing here...?Watchlist Columns
This post will provide links and explanations various watchlist columns related to studies within the Confirmation Trend Chart Style (though some are not named directly their code is within one of the aforementioned studies).
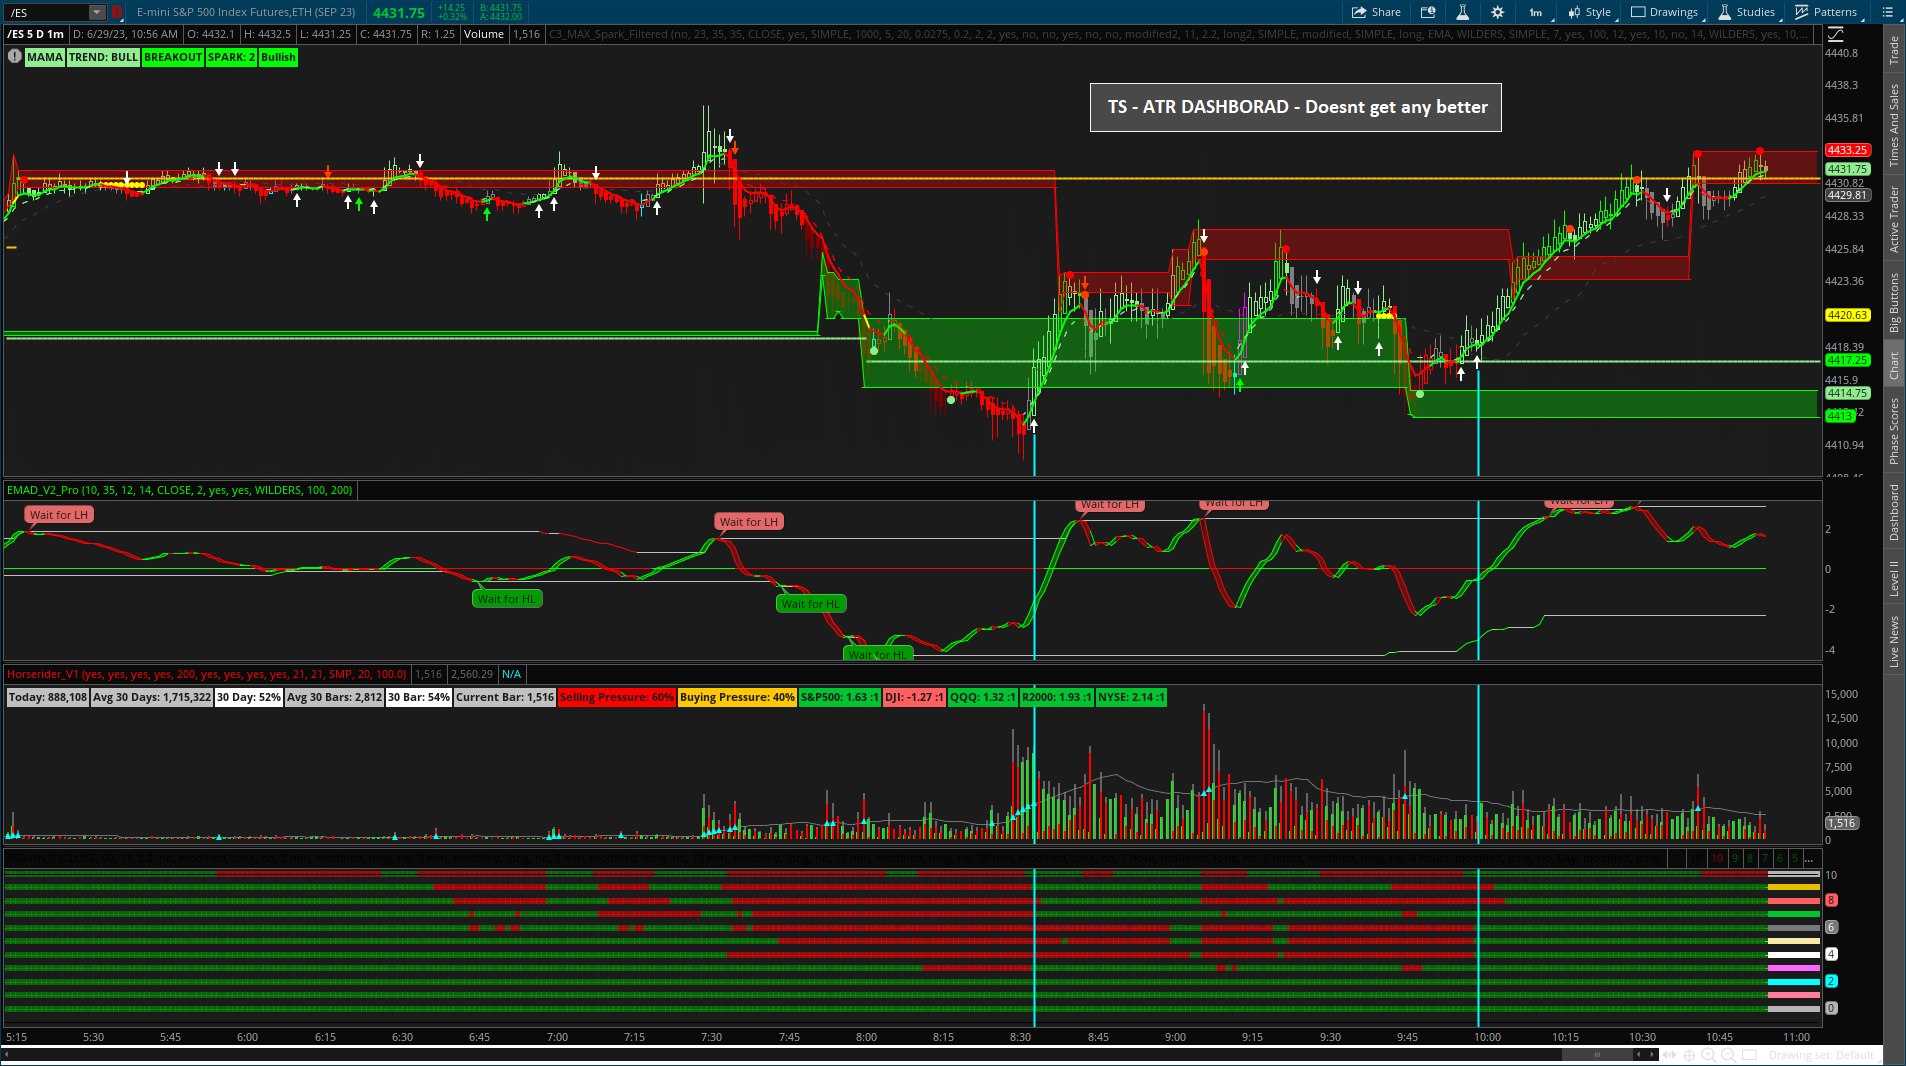
Big4 Watchlist Column
Share link - https://tos.mx/cn1MD6S
Code:#Big_4 watchlist column ####################################### ## Create Labels ####################################### input showtitle = no; input showlabels = yes; def AutoAgg = yes; def AutoAgg2 = yes; def ag_skip = no; def ag_skip2 = no; def ag_skip_lbl = no; def agperiod1 = GetAggregationPeriod(); input timeframe = aggregationperiod.DAY; input length = 10; input length2 = 20; def Vol = volume(period = timeframe); def at_High = high(period = timeframe); def at_Open = open(period = timeframe); def at_Close = close(period = timeframe); def at_Low = low(period = timeframe); def Vol1 = volume(period = timeframe); def at_High1 = high(period = timeframe); def at_Open1 = open(period = timeframe); def at_Close1 = close(period = timeframe); def at_Low1 = low(period = timeframe); # Buy_Volume forumla is volume * (close_price minus low_price) / (High_price minus low_price) def Buy_Volume = RoundUp(Vol * (at_Close - at_Low) / (at_High - at_Low)); def Buy_percent = RoundUp((Buy_Volume / Vol) * 100); #Buy_percent.SetPaintingStrategy(PaintingStrategy.LINE); #Buy_percent.SetLineWeight(1); #Buy_percent.SetDefaultColor(Color.GREEN); #Sell_Volume forumla is volume * (High_price minus Close_price) / (High_price minus Low_price) def Sell_Volume = RoundDown(Vol1 * (at_High1 - at_Close1) / (at_High1 - at_Low1)); def Sell_percent = RoundUp((Sell_Volume / Vol1) * 100); #input price = close; input length_BB = 10; input length_BB2 = 20; plot avg = ExpAverage(close(period = agperiod1), length_BB); #plot avg = ExpAverage((price), length); def height = avg - avg[length]; avg.SetStyle(Curve.SHORT_DASH); avg.SetLineWeight(1); AddLabel(showtitle, " Big_6: ", Color.Light_gray); # AK Trend def aktrend_input1 = 3; def aktrend_input2 = 8; def aktrend_price = close; def aktrend_fastmaa = MovAvgExponential(aktrend_price, aktrend_input1); def aktrend_fastmab = MovAvgExponential(aktrend_price, aktrend_input2); def aktrend_bspread = (aktrend_fastmaa - aktrend_fastmab) * 1.001; def cond1_UP = if aktrend_bspread > 0 then 1 else 0; def cond1_DN = if aktrend_bspread <= 0 then -1 else 0; # ZSCORE def zscore_price = close; def zscore_length = 20; def zscore_ZavgLength = 20; def zscore_oneSD = StDev(zscore_price, zscore_length); def zscore_avgClose = SimpleMovingAvg(zscore_price, zscore_length); def zscore_ofoneSD = zscore_oneSD * zscore_price[1]; def zscore_Zscorevalue = ((zscore_price - zscore_avgClose) / zscore_oneSD); def zscore_avgZv = Average(zscore_Zscorevalue, 20); def zscore_Zscore = ((zscore_price - zscore_avgClose) / zscore_oneSD); def zscore_avgZscore = Average(zscore_Zscorevalue, zscore_ZavgLength); def cond2_UP = if zscore_Zscore > 0 then 1 else 0; def cond2_DN = if zscore_Zscore <= 0 then -1 else 0; # Ehlers def ehlers_length = 34; def ehlers_price = (high + low) / 2; def ehlers_coeff = ehlers_length * ehlers_price * ehlers_price - 2 * ehlers_price * Sum(ehlers_price, ehlers_length)[1] + Sum(ehlers_price * ehlers_price, ehlers_length)[1]; def ehlers_Ehlers = Sum(ehlers_coeff * ehlers_price, ehlers_length) / Sum(ehlers_coeff, ehlers_length); def cond3_UP = if close > ehlers_Ehlers then 1 else 0; def cond3_DN = if close <= ehlers_Ehlers then -1 else 0; # Anchored Momentum def amom_src = close; def amom_MomentumPeriod = 10; def amom_SignalPeriod = 8; def amom_SmoothMomentum = no; def amom_SmoothingPeriod = 7; def amom_p = 2 * amom_MomentumPeriod + 1; def amom_t_amom = if amom_SmoothMomentum == yes then ExpAverage(amom_src, amom_SmoothingPeriod) else amom_src; def amom_amom = 100 * ( (amom_t_amom / ( Average(amom_src, amom_p)) - 1)); def amom_amoms = Average(amom_amom, amom_SignalPeriod); def cond4_UP = if amom_amom > 0 then 1 else 0; def cond4_DN = if amom_amom <= 0 then -1 else 0; # TMO def tmo_length = 30; #def 14 def tmo_calcLength = 6; #def 5 def tmo_smoothLength = 6; #def 3 def tmo_data = fold i = 0 to tmo_length with s do s + (if close > GetValue(open, i) then 1 else if close < GetValue(open, i) then - 1 else 0); def tmo_EMA5 = ExpAverage(tmo_data, tmo_calcLength); def tmo_Main = ExpAverage(tmo_EMA5, tmo_smoothLength); def tmo_Signal = ExpAverage(tmo_Main, tmo_smoothLength); def tmo_color = if tmo_Main > tmo_Signal then 1 else -1; def cond5_UP = if tmo_Main <= 0 then 1 else 0; def cond5_DN = if tmo_Main >= 0 then -1 else 0; # Strategy input Strategy_Confirmation_Factor = 4; input Strategy_FilterWithTMO = no; input Strategy_FilterWithTMO_arrows = yes; input Strategy_ColoredCandlesOn = yes; input Strategy_VerticalLinesOn = no; input Strategy_HoldTrend = no; def cond_UP = cond1_UP + cond2_UP + cond3_UP + cond4_UP; def cond_DN = cond1_DN + cond2_DN + cond3_DN + cond4_DN; def direction = if cond_UP >= Strategy_Confirmation_Factor and (!Strategy_FilterWithTMO or cond5_UP) then 1 else if cond_DN <= -Strategy_Confirmation_Factor and (!Strategy_FilterWithTMO or cond5_DN) then -1 else if !Strategy_HoldTrend and direction[1] == 1 and cond_UP < Strategy_Confirmation_Factor and cond_DN > -Strategy_Confirmation_Factor then 0 else if !Strategy_HoldTrend and direction[1] == -1 and cond_DN > -Strategy_Confirmation_Factor and cond_UP < Strategy_Confirmation_Factor then 0 else direction[1]; def direction2 = if cond_UP >= Strategy_Confirmation_Factor and (!Strategy_FilterWithTMO_arrows or cond5_UP) then 1 else if cond_DN <= -Strategy_Confirmation_Factor and (!Strategy_FilterWithTMO_arrows or cond5_DN) then -1 else if !Strategy_HoldTrend and direction2[1] == 1 and cond_UP < Strategy_Confirmation_Factor and cond_DN > -Strategy_Confirmation_Factor then 0 else if !Strategy_HoldTrend and direction2[1] == -1 and cond_DN > -Strategy_Confirmation_Factor and cond_UP < Strategy_Confirmation_Factor then 0 else direction2[1]; def signal_up = direction2 == 1 and direction2[1] < 1; def signal_dn = direction2 == -1 and direction2[1] > -1; addlabel(yes, if signal_up then "👍" else if signal_dn then "👎" else " ", color.black); Assignbackgroundcolor(if direction == 1 then Color.dark_GREEN else if direction == -1 then Color.RED else Color.gray);
TS_V9 Watchlist Column
Watchlist Column Share Link - http://tos.mx/SD7Fqm7 (4/25/23)
Description
The watchlist column for TS_V9 is from the original study code not the filtered code as watchlist columns do not support more than one aggregation.
- Signals present within 3 bars indicate “Buy” or “Sell”
- Signals not present within 3 bars indicate the most recent signal “Last Buy” or “Last Sell”
Code:#TS_V9 Watchlist Column - HODL - 4/25/23 #TS Strategy_V9 Created by Christopher84 08/10/2021 #Modified 05/23/2022 to include Chart Bubbles and Labels. #Modified 05/25/2022 to include Targets and Stoplosses. #Modified 05/26/2022 to include Line Labels by Dcstocks #Modified 05/27/2022 to include target 7. input trailType = {default modified, unmodified}; input ATRPeriod = 11; input ATRFactor = 2.2; input firstTrade = {default long, short}; input averageType = AverageType.SIMPLE; input price = close; input coloredCandlesOn = yes; input LabelsOn = yes; Assert(ATRFactor > 0, "'atr factor' must be positive: " + ATRFactor); def HiLo = Min(high - low, 1.5 * Average(high - low, ATRPeriod)); def HRef = if low <= high[1] then high - close[1] else (high - close[1]) - 0.5 * (low - high[1]); def LRef = if high >= low[1] then close[1] - low else (close[1] - low) - 0.5 * (low[1] - high); def trueRange; switch (trailType) { case modified: trueRange = Max(HiLo, Max(HRef, LRef)); case unmodified: trueRange = TrueRange(high, close, low); } def loss = ATRFactor * MovingAverage(averageType, trueRange, ATRPeriod); def state = {default init, long, short}; def trail; switch (state[1]) { case init: if (!IsNaN(loss)) { switch (firstTrade) { case long: state = state.long; trail = close - loss; case short: state = state.short; trail = close + loss; } } else { state = state.init; trail = Double.NaN; } case long: if (close > trail[1]) { state = state.long; trail = Max(trail[1], close - loss); } else { state = state.short; trail = close + loss; } case short: if (close < trail[1]) { state = state.short; trail = Min(trail[1], close + loss); } else { state = state.long; trail = close - loss; } } #def isnan = double.nan; def bn = barnumber(); def TrailingStop = trail; def LongEnter = (price crosses above TrailingStop) within 3 bars; def LongEnterbn = if longenter then bn else longenterbn[1]; def LongExit = (price crosses below TrailingStop)within 3 bars; def LongExitbn = if LongExit then bn else LongExitbn[1]; def Hold_signal = if LongEnterbn > LongExitbn then 1 else 0; #plot value = if LongEnter then 1 else if LongExit then 0 else double.nan; AssignbackgroundColor( if longenter then color.Dark_Green else if !longenter and (Hold_signal == 1) then Color.green else if longexit then Color.Dark_Red else if !longexit and (Hold_signal == 0) then Color.Red else color.dark_Gray); AddLabel(yes, if (longenter) then "TS_1H" else if !longenter and (Hold_signal == 1) then "Last: BUY" else if (longexit) then "TS_1H" else if !longexit and (Hold_signal == 0) then "Last: SELL" else " ", if longenter then color.white else if !longenter and (Hold_signal == 1) then Color.black else if longexit then Color.white else if !longexit and (Hold_signal == 0) then Color.black else color.dark_Gray); #AddLabel(yes, if (price crosses above TrailingStop) then "Long" #else if (price crosses below TrailingStop) then "Short" ##else "NO BREAK", if conditionBD then Color.RED ##else if conditionBO then Color.GREEN #else " "); #AssignvalueColor(if coloredCandlesOn and ((price > TrailingStop)) then Color.GREEN else if coloredCandlesOn and ((price < TrailingStop)) then Color.RED else Color.GRAY); #def upsignal = (price crosses above TrailingStop); #def downsignal = (price crosses below TrailingStop); ###------------------------------------------------------------------------------------------ # Profit and Loss Labels # # Fill in the 0>0 in the Create Signals section below to match your buy and sell signal conditions # # When using large amounts of hisorical data, P/L may take time to calculate ###------------------------------------------------------------------------------------------
EMAD Watchlist Column
EMAD Watchlist Column Share Link - http://
Description
The EMAD watchlist column indicates the location of the EMAs within the range and changes colors accordingly.
- Above or below zero line
- EMA cross up or down off line
Code:code
Horserider Volume Watchlist Column
Volume_%_30Bar Watchlist Column Share Link - http://tos.mx/u3K4CTM
Description
The volume percent 30 bar watchlist column shows the percent value of 30 bars of volume
Code:#Volume Buy Sell Pressure with Hot Percent for ThinkorSwim # Show total volume in gray. Buying volume in green. Sell Volume in red. # Volume average is gray line. # Specified percent over average volume is cyan triangles. # Horserider 12/30/2019 derived from some already existing studies. declare lower; #Inputs input Show30DayAvg = yes; input ShowTodayVolume = yes; input ShowPercentOf30DayAvg = yes; input UnusualVolumePercent = 200; input Show30BarAvg = yes; input ShowCurrentBar = yes; input ShowPercentOf30BarAvg = yes; input ShowSellVolumePercent = yes; def O = open; def H = high; def C = close; def L = low; def V = volume; def buying = V*(C-L)/(H-L); def selling = V*(H-C)/(H-L); # Selling Volume Plot SellVol = selling; SellVol.setPaintingStrategy(PaintingStrategy.Histogram); SellVol.SetDefaultColor(Color.Red); SellVol.HideTitle(); SellVol.HideBubble(); SellVol.SetLineWeight(1); # Total Volume # Note that Selling + Buying Volume = Volume. plot TV = volume; TV.SetPaintingStrategy(PaintingStrategy.HISTOGRAM); TV.SetDefaultColor(Color.GRAY); #TV.HideTitle(); #TV.HideBubble(); TV.SetLineWeight(1); Plot BuyVol = buying; BuyVol.setPaintingStrategy(PaintingStrategy.Histogram); BuyVol.SetDefaultColor(Color.Green); BuyVol.HideTitle(); BuyVol.HideBubble(); BuyVol.SetLineWeight(5); #Volume Data def volLast30DayAvg = (volume(period = "DAY")[1] + volume(period = "DAY")[2] + volume(period = "DAY")[3] + volume(period = "DAY")[4] + volume(period = "DAY")[5] + volume(period = "DAY")[6] + volume(period = "DAY")[7] + volume(period = "DAY")[8] + volume(period = "DAY")[9] + volume(period = "DAY")[10] + volume(period = "DAY")[11] + volume(period = "DAY")[12] + volume(period = "DAY")[13] + volume(period = "DAY")[14] + volume(period = "DAY")[15] + volume(period = "DAY")[16] + volume(period = "DAY")[17] + volume(period = "DAY")[18] + volume(period = "DAY")[19] + volume(period = "DAY")[20] + volume(period = "DAY")[21] + volume(period = "DAY")[22] + volume(period = "DAY")[23] + volume(period = "DAY")[24] + volume(period = "DAY")[25] + volume(period = "DAY")[26] + volume(period = "DAY")[27] + volume(period = "DAY")[28] + volume(period = "DAY")[29] + volume(period = "DAY")[30]) / 30; def today = volume(period = "DAY"); def percentOf30Day = Round((today / volLast30DayAvg) * 100, 0); def avg30Bars = (volume[1] + volume[2] + volume[3] + volume[4] + volume[5] + volume[6] + volume[7] + volume[8] + volume[9] + volume[10] + volume[11] + volume[12] + volume[13] + volume[14] + volume[15] + volume[16] + volume[17] + volume[18] + volume[19] + volume[20] + volume[21] + volume[22] + volume[23] + volume[24] + volume[25] + volume[26] + volume[27] + volume[28] + volume[29] + volume[30]) / 30; def curVolume = volume; def percentOf30Bar = Round((curVolume / avg30Bars) * 100, 0); def SellVolPercent = Round((Selling / Volume) * 100, 0); # Labels #AddLabel(Show30BarAvg, "30 Bar: " + Round(avg30Bars, 0), Color.white); #AddLabel(ShowCurrentBar, "Cur Bar: " + curVolume, (if percentOf30Bar >= UnusualVolumePercent then Color.GREEN else if PercentOf30Bar >= 100 then Color.ORANGE else Color.LIGHT_GRAY)); #AddLabel(ShowPercentOf30BarAvg, PercentOf30Bar + "%", (if PercentOf30Bar >= UnusualVolumePercent then Color.GREEN else if PercentOf30Bar >= 100 then Color.Light_Green else Color.WHITE) ); assignBackgroundColor(if PercentOf30Bar >= UnusualVolumePercent then color.GREEN else if PercentOf30Bar >= 100 then color.RED else color.white); AddLabel(ShowPercentOf30BarAvg, PercentOf30Bar + "%",Color.Black); #AddLabel(buying >= selling, ""+BuyVolPercent, color.black); #AddLabel(ShowSellVolumePercent, "Cur Bar Sell %: " + SellVolPercent, (if SellVolPercent > 51 then Color.RED else if SellVolPercent < 49 then Color.GREEN else Color.ORANGE)); #input length = 21; #input length2 = 21; #plot VolAvg = Average(volume, length); #plot VolAvg1= Average(volume, length2); #VolAvg.SetDefaultColor(GetColor(1)); #VolAvg1.SetDefaultColor(GetColor(3)); #def crossover = if (VolAvg2 crosses below VolAvg4) then 1 else 0; #def crossunder = if (VolAvg2 crosses above VolAvg4) and (volume<volavg) then 1 else 0; #AddVerticalLine(if crossover ==1 then 1 else 0,"",color.cyan); #AddVerticalLine(if crossunder ==1 then 1 else 0); # hiVolume indicator # source: http://tinboot.blogspot.com # author: allen everhart #input type = { default SMP, EXP } ; #input length_HV = 20 ; #input HotPct = 100.0 ; #def MA = #if type == type.SMP then #SimpleMovingAvg(volume, length_HV) #else #MovAvgExponential(volume, length_HV); #plot HV = ##ma #else #Double.NaN; #hv.SetDefaultColor( Color.CYAN); #hv.SetLineWeight(1) ; #hv.SetPaintingStrategy( PaintingStrategy.TRIANGLES);
Vix Alert 4 Watchlist Column
Vix_Alert4 Watchlist Column Share Link - http://tos.mx/qmsqFqB (4/25/23)
Description
The Vix Alert 4 indicates a potential reversal.
- Colors cell if condition exists within 3 bars
Code:# Source? # VixAlert4 WL Column - HODL # Williams Vix Fix Formula input pd = 22; input bbl = 20; input mult = 2.0; input lb = 50; input ph = 0.85; input pl = 1.01; # Downtrend Criteria input ltLB = 40; input mtLB = 14; input str = 3; def wvf = ((highest(close, pd) - low) / (highest(close, pd))) * 100; def sDev = mult * stdev(wvf, bbl); def midLine = SimpleMovingAvg(wvf, bbl); def lowerBand = midLine - sDev; def upperBand = midLine + sDev; def rangeHigh = (highest(wvf, lb)) * ph; # Filtered Bar Criteria def upRange = low > low[1] and close > high[1]; def upRange_Aggr = close > close[1] and close > open[1]; # Filtered Criteria def filtered = ((wvf[1] >= upperBand[1] or wvf[1] >= rangeHigh[1]) and(wvf<upperBand and wvf<rangeHigh)); def filtered_Aggr = (wvf[1] >= upperBand[1] or wvf[1] >= rangeHigh[1]); # Alerts Criteria def alert1 = wvf >= upperBand or wvf >= rangeHigh; def alert2 = (wvf[1] >= upperBand[1] or wvf[1] >= rangeHigh[1]) and (wvf < upperBand and wvf < rangeHigh); def alert3 = upRange and close > close[str] and (close < close[ltLB] or close < close[mtLB]) and filtered; def alert4 = upRange_Aggr and close > close[str] and (close < close[ltLB] or close < close[mtLB]) and filtered_Aggr; AssignbackgroundColor(if alert4 within 2 bars then color.orange else color.Dark_Gray); AddLabel(yes, if (Alert4) within 2 bars then "Alert 4 Day" + " " else " ", color.black);
Blast Off Watchlist Column
Blast_Off Watchlist Column Share Link - http://tos.mx/gVd03PO (4/25/23)
Description
Code:# Blast Off Indicator # Should use on the Daily chart # Assembled by BenTen at useThinkScript.com # Converted from https://www.tradingview.com/script/V9Mi6eOO-CM-Blast-Off-V1-Alerts-Ready/ input trig = 20; input paintbar = yes; def val = AbsValue(close - open); def range = high - low; def blastOffVal = (val / range) * 100; def trigger = trig; def alert1 = blastOffVal < trig; def col = blastOffVal < trig; plot value = if col then 1 else 0; addlabel(yes, "Blast Off ", if value == 1 then color.black else color.Dark_Gray); AssignBackgroundColor(if col then Color.orange else Color.Dark_GRAY);
Triple Exhaustion Watchlist Column
Triple_Exhaustion Watchlist Column Share Link - http://tos.mx/L4uOP8M
Description
The Triple Exhaustion watchlist column indicates the end of exhaustion.
- Color changes green or red when condition exists within 3 bars
- If you so choose change the number "3" to any number (I added within x bars bc there were few indications for the current bar)
Code:## Triple Exhaustion Watchlist Column ## ## ## CREDITS ## Requested by @Chence27 from criteria listed here https://usethinkscript.com/threads/triple-exhaustion-indicator.9001/ ## ## ## Removing the header Credit credits and description is not permitted, any modification needs to be shared. ## ## V 1.0 : @cos251 - Initial release per request from www.usethinkscript.com forum thread: ## : https://usethinkscript.com/threads/triple-exhaustion-indicator.9001/ ## ## ## # --- Inputs input over_bought = 80; input over_sold = 20; input KPeriod = 10; input DPeriod = 10; input priceH = high; input priceL = low; input priceC = close; input averageType = AverageType.SIMPLE; input length = 1000; input paintBars = yes; input showLabels = yes; # --- Indicators - StochasticSlow / MACD / MACD StDev / DMI+/- def SlowK = reference StochasticFull(over_bought, over_sold, KPeriod, DPeriod, priceH, priceL, priceC, 3, averageType).FullK; def MACD = reference MACD()."Value"; def priceMean = Average(MACD, length); def MACD_stdev = (MACD - priceMean) / StDev(MACD, length); def dPlus = reference DMI()."DI+"; def dMinus = reference DMI()."DI-"; # --- End Indicators # --- Conditions def sellerRegular = SlowK < 20 and MACD_stdev < -1 and dPlus < 15; def sellerExtreme = SlowK < 20 and MACD_stdev < -2 and dPlus < 15; def buyerRegular = SlowK > 80 and MACD_stdev > 1 and dMinus < 15; def buyerExtreme = SlowK > 80 and MACD_stdev > 2 and dMinus < 15; # --- End Conditions # -- Price Color AssignPriceColor( if paintBars and sellerExtreme then Color.CYAN else if buyerExtreme and paintBars then Color.GREEN else if paintBars and sellerRegular then Color.YELLOW else if buyerRegular and paintBars then Color.DARK_GREEN else if paintBars then Color.GRAY else Color.Current); # --- Arrows/Triggers plot RegularBuy = if sellerRegular[1] and !sellerRegular then 1 else 0; plot ExtremeBuy = if sellerExtreme[1] and !sellerExtreme then 1 else 0; RegularBuy.SetPaintingStrategy(PaintingSTrategy.ARROW_UP); ExtremeBuy.SetPaintingSTrategy(paintingSTrategy.Arrow_UP); RegularBuy.SetDefaultColor(Color.green); ExtremeBuy.SetDefaultColor(Color.Dark_GREEN); plot RegularSell = if buyerRegular[1] and !buyerRegular then 1 else 0; plot ExtremeSell = if buyerExtreme[1] and !buyerExtreme then 1 else 0; RegularSell.SetPaintingStrategy(PaintingSTrategy.ARROW_down); ExtremeSell.SetPaintingSTrategy(paintingSTrategy.Arrow_DOWN); RegularSell.SetDefaultColor(Color.red); ExtremeSell.SetDefaultColor(Color.Dark_red); # --- Labels# #AddLabel(showLabels,"SellerRegular",Color.YELLOW); #AddLabel(showLabels,"SellerExtreme",Color.CYAN); #AddLabel(showLabels,"BuyerRegular",Color.DARK_GREEN); #AddLabel(showLabels,"BuyerExtreme",Color.GREEN); #Addlabel (yes, "3X EXH:", Color.Gray); #Addlabel (yes, if sellerExtreme then " " else # if buyerExtreme then " " else # if sellerRegular then " " else # if buyerRegular then " " else # if sellerExtreme then " " else " ", # if buyerExtreme then Color.MAGENTA else # if sellerRegular then Color.GREEN else # if buyerRegular then Color.RED else # if sellerExtreme then Color.Cyan else # Color.yellow); #Addlabel (yes, " 3X ARW: ", Color.Gray); addLabel (yes, if extremeSell within 3 bars then "3X" else if extremebuy within 3 bars then "3X" else if regularsell within 3 bars then "3XT" else if regularbuy within 3 bars then "3XT" else " "); AssignbackgroundColor( if extremeSell within 3 bars then Color.Dark_red else if extremebuy within 3 bars then Color.Dark_green else if regularsell within 3 bars then Color.dark_red else if regularbuy within 3 bars then Color.dark_green else Color.dark_gray);
MAMA Watchlist Column
MAMA Watchlist Column Share Link - http://tos.mx/AvGKZ10 (4/25/23)
Description
The MAMA watchlist column indicates bullish or bearish price action which (I believe - will verify) is based on the agreement level between 16 different indicators
- Green = bullish
- Red = bearish
Code:#Ehler's MAMA Watchlist Column #Created by Christopher84 10/10/2022 script WMA_Smooth { input price = hl2; plot smooth = (4 * price + 3 * price[1] + 2 * price[2] + price[3]) / 10; } input showcloud = no; script Phase_Accumulation { # This is Ehler's Phase Accumulation code. It has a full cycle delay. # However, it computes the correction factor to a very high degree. # input price = hl2; rec Smooth; rec Detrender; rec Period; rec Q1; rec I1; rec I1p; rec Q1p; rec Phase1; rec Phase; rec DeltaPhase; rec DeltaPhase1; rec InstPeriod1; rec InstPeriod; def CorrectionFactor; if BarNumber() <= 5 then { Period = 0; Smooth = 0; Detrender = 0; CorrectionFactor = 0; Q1 = 0; I1 = 0; Q1p = 0; I1p = 0; Phase = 0; Phase1 = 0; DeltaPhase1 = 0; DeltaPhase = 0; InstPeriod = 0; InstPeriod1 = 0; } else { CorrectionFactor = 0.075 * Period[1] + 0.54; # Smooth and detrend my smoothed signal: Smooth = WMA_Smooth(price); Detrender = ( 0.0962 * Smooth + 0.5769 * Smooth[2] - 0.5769 * Smooth[4] - 0.0962 * Smooth[6] ) * CorrectionFactor; # Compute Quadrature and Phase of Detrended signal: Q1p = ( 0.0962 * Detrender + 0.5769 * Detrender[2] - 0.5769 * Detrender[4] - 0.0962 * Detrender[6] ) * CorrectionFactor; I1p = Detrender[3]; # Smooth out Quadrature and Phase: I1 = 0.15 * I1p + 0.85 * I1p[1]; Q1 = 0.15 * Q1p + 0.85 * Q1p[1]; # Determine Phase if I1 != 0 then { # Normally, ATAN gives results from -pi/2 to pi/2. # We need to map this to circular coordinates 0 to 2pi if Q1 >= 0 and I1 > 0 then { # Quarant 1 Phase1 = ATan(AbsValue(Q1 / I1)); } else if Q1 >= 0 and I1 < 0 then { # Quadrant 2 Phase1 = Double.Pi - ATan(AbsValue(Q1 / I1)); } else if Q1 < 0 and I1 < 0 then { # Quadrant 3 Phase1 = Double.Pi + ATan(AbsValue(Q1 / I1)); } else { # Quadrant 4 Phase1 = 2 * Double.Pi - ATan(AbsValue(Q1 / I1)); } } else if Q1 > 0 then { # I1 == 0, Q1 is positive Phase1 = Double.Pi / 2; } else if Q1 < 0 then { # I1 == 0, Q1 is negative Phase1 = 3 * Double.Pi / 2; } else { # I1 and Q1 == 0 Phase1 = 0; } # Convert phase to degrees Phase = Phase1 * 180 / Double.Pi; if Phase[1] < 90 and Phase > 270 then { # This occurs when there is a big jump from 360-0 DeltaPhase1 = 360 + Phase[1] - Phase; } else { DeltaPhase1 = Phase[1] - Phase; } # Limit our delta phases between 7 and 60 if DeltaPhase1 < 7 then { DeltaPhase = 7; } else if DeltaPhase1 > 60 then { DeltaPhase = 60; } else { DeltaPhase = DeltaPhase1; } # Determine Instantaneous period: InstPeriod1 = -1 * (fold i = 0 to 40 with v=0 do if v < 0 then v else if v > 360 then -i else v + GetValue(DeltaPhase, i, 41) ); if InstPeriod1 <= 0 then { InstPeriod = InstPeriod[1]; } else { InstPeriod = InstPeriod1; } Period = 0.25 * InstPeriod + 0.75 * Period[1]; } plot DC = Period; } script Ehler_MAMA { input price = hl2; input FastLimit = 0.5; input SlowLimit = 0.05; rec Period; rec Period_raw; rec Period_cap; rec Period_lim; rec Smooth; rec Detrender; rec I1; rec Q1; rec jI; rec jQ; rec I2; rec Q2; rec I2_raw; rec Q2_raw; rec Phase; rec DeltaPhase; rec DeltaPhase_raw; rec alpha; rec alpha_raw; rec Re; rec Im; rec Re_raw; rec Im_raw; rec SmoothPeriod; rec vmama; rec vfama; def CorrectionFactor = Phase_Accumulation(price).CorrectionFactor; if BarNumber() <= 5 then { Smooth = 0; Detrender = 0; Period = 0; Period_raw = 0; Period_cap = 0; Period_lim = 0; I1 = 0; Q1 = 0; I2 = 0; Q2 = 0; jI = 0; jQ = 0; I2_raw = 0; Q2_raw = 0; Re = 0; Im = 0; Re_raw = 0; Im_raw = 0; SmoothPeriod = 0; Phase = 0; DeltaPhase = 0; DeltaPhase_raw = 0; alpha = 0; alpha_raw = 0; vmama = 0; vfama = 0; } else { # Smooth and detrend my smoothed signal: Smooth = WMA_Smooth(price); Detrender = ( 0.0962 * Smooth + 0.5769 * Smooth[2] - 0.5769 * Smooth[4] - 0.0962 * Smooth[6] ) * CorrectionFactor; Q1 = ( 0.0962 * Detrender + 0.5769 * Detrender[2] - 0.5769 * Detrender[4] - 0.0962 * Detrender[6] ) * CorrectionFactor; I1 = Detrender[3]; jI = ( 0.0962 * I1 + 0.5769 * I1[2] - 0.5769 * I1[4] - 0.0962 * I1[6] ) * CorrectionFactor; jQ = ( 0.0962 * Q1 + 0.5769 * Q1[2] - 0.5769 * Q1[4] - 0.0962 * Q1[6] ) * CorrectionFactor; # This is the complex conjugate I2_raw = I1 - jQ; Q2_raw = Q1 + jI; I2 = 0.2 * I2_raw + 0.8 * I2_raw[1]; Q2 = 0.2 * Q2_raw + 0.8 * Q2_raw[1]; Re_raw = I2 * I2[1] + Q2 * Q2[1]; Im_raw = I2 * Q2[1] - Q2 * I2[1]; Re = 0.2 * Re_raw + 0.8 * Re_raw[1]; Im = 0.2 * Im_raw + 0.8 * Im_raw[1]; # Compute the phase if Re != 0 and Im != 0 then { Period_raw = 2 * Double.Pi / ATan(Im / Re); } else { Period_raw = 0; } if Period_raw > 1.5 * Period_raw[1] then { Period_cap = 1.5 * Period_raw[1]; } else if Period_raw < 0.67 * Period_raw[1] { Period_cap = 0.67 * Period_raw[1]; } else { Period_cap = Period_raw; } if Period_cap < 6 then { Period_lim = 6; } else if Period_cap > 50 then { Period_lim = 50; } else { Period_lim = Period_cap; } Period = 0.2 * Period_lim + 0.8 * Period_lim[1]; SmoothPeriod = 0.33 * Period + 0.67 * SmoothPeriod[1]; if I1 != 0 then { Phase = ATan(Q1 / I1); } else if Q1 > 0 then { # Quadrant 1: Phase = Double.Pi / 2; } else if Q1 < 0 then { # Quadrant 4: Phase = -Double.Pi / 2; } else { # Both numerator and denominator are 0. Phase = 0; } DeltaPhase_raw = Phase[1] - Phase; if DeltaPhase_raw < 1 then { DeltaPhase = 1; } else { DeltaPhase = DeltaPhase_raw; } alpha_raw = FastLimit / DeltaPhase; if alpha_raw < SlowLimit then { alpha = SlowLimit; } else { alpha = alpha_raw; } vmama = alpha * price + (1 - alpha) * vmama[1]; vfama = 0.5 * alpha * vmama + (1 - 0.5 * alpha) * vfama[1]; } plot MAMA = vmama; plot FAMA = vfama; } declare upper; input price = hl2; input FastLimit = 0.5; input SlowLimit = 0.05; DefineGlobalColor("Pre_Cyan", CreateColor(50, 200, 255)) ; DefineGlobalColor("LabelGreen", CreateColor(0, 165, 0)) ; DefineGlobalColor("LabelRed", CreateColor(225, 0, 0)) ; plot MAMA = Ehler_MAMA(price, FastLimit, SlowLimit).MAMA; def UP = price > MAMA; def DOWN = price < MAMA; addlabel(yes, if UP then "👍 1H" else if Down then "👎 1H" else " ", color.white); AssignBackgroundColor(if DOWN then color.dark_RED else if UP then color.dark_green else color.black); #"👍" else if Down then "👎"
ok got it. Do you mind explaining how you use this?Sheeeesh love this lower...
No matter what option I select I can't for the life of me get the white arrows to show. I do not know if it is Spark, TS_V9 or Big7 that is what I need to change. I would love to know what option needs to be turned on for them missing so many moves because the cyan arrows are nowhere near the momentum. Any help would be a big help.
HOD, What are you drawing vertical lines too? It doesn't look like an entry point in the dashboard. What am I missing. Do you mind explaining how you are using it? Wait, Is this a VIP indicator?Sheeeesh love this lower...
hmm can you screenshot your settings?No matter what option I select I can't for the life of me get the white arrows to show. I do not know if it is Spark, TS_V9 or Big7 that is what I need to change. I would love to know what option needs to be turned on for them missing so many moves because the cyan arrows are nowhere near the momentum. Any help would be a big help.
The white arrows are "Signal Up and Down" make sure under the plots section the boxes are check to show them and the following:
TMO filter arrows setting - yes
TMO filter setting (for candles) - no
Thank you for the follow up I found the setting in Big7 and I am smacking myself for not thinking about the show plots. I got them working and don't know why I did not think to check this earlier. I just want to say that I really like what you do for the users like me who would never be able to script things like this. I will say that your indicators are pretty damn impressive. Great work and appreciate it.
Haha well you got it now. No problem, though unfortunately I only modify other peoples studies such as the legend @Christopher84 … but I appreciate the kind words and am glad you like it.Thank you for the follow up I found the setting in Big7 and I am smacking myself for not thinking about the show plots. I got them working and don't know why I did not think to check this earlier. I just want to say that I really like what you do for the users like me who would never be able to script things like this. I will say that your indicators are pretty damn impressive. Great work and appreciate it.
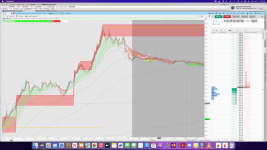
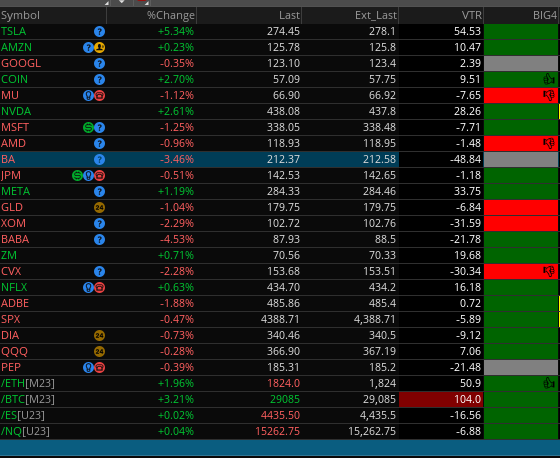
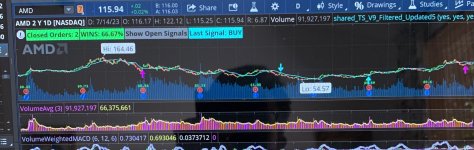
I downloaded your script and have some questions. What history does closed orders refer to? What about Wins, and last signal? I am attaching a few charts. I appreciate all your posted scripts and comments and have downloaded many.Confirmation Trend Chart Style | General Information
This post will explain and or illustrate general information and important observations viewing the Confirmation Trend | The End All Be All chart style as a whole:
View attachment 18483
View attachment 18484
View attachment 18485
Attachments
hey buddy ive been pulling my hair out looking for the line that sets the stop labels as yellow, i want to separate the buy and sell stops and make them green and red, if you can help me that would be wonderfulHaha well you got it now. No problem, though unfortunately I only modify other peoples studies such as the legend @Christopher84 … but I appreciate the kind words and am glad you like it.
hey buddy ive been pulling my hair out looking for the line that sets the stop labels as yellow, i want to separate the buy and sell stops and make them green and red, if you can help me that would be wonderful
Last edited by a moderator:
I’ll have to look at the code when I get to my comp but it will begin with “Addbubble” if your looking for the bubble (that’s what is circled)… Been busy at work unfortunately but will look at it and update you tomorrow.hey buddy ive been pulling my hair out looking for the line that sets the stop labels as yellow, i want to separate the buy and sell stops and make them green and red, if you can help me that would be wonderful
View attachment 19171
Last edited:
- Status
- Not open for further replies.
Similar threads
-
Volume Confirmation for a Trend System For ThinkOrSwim
- Started by GLENNOHULL
- Replies: 4
-
Confirmation Candle with Key Level and Weighted Paintbars Chart Setup For ThinkOrSwim
- Started by rip78
- Replies: 8
-
Confirmation Candles Indicator For ThinkorSwim
- Started by Christopher84
- Replies: 3K
-
 DEMA Crossover with Heikin-Ashi Candle Confirmation for ThinkorSwim
- Started by theelderwand
- Replies: 67
-

Not the exact question you're looking for?
Start a new thread and receive assistance from our community.
87k+
Posts
1900
Online
Similar threads
-
Volume Confirmation for a Trend System For ThinkOrSwim
- Started by GLENNOHULL
- Replies: 4
-
Confirmation Candle with Key Level and Weighted Paintbars Chart Setup For ThinkOrSwim
- Started by rip78
- Replies: 8
-
Confirmation Candles Indicator For ThinkorSwim
- Started by Christopher84
- Replies: 3K
-
DEMA Crossover with Heikin-Ashi Candle Confirmation for ThinkorSwim
- Started by theelderwand
- Replies: 67
-
The Market Trading Game Changer
Join 2,500+ subscribers inside the useThinkScript VIP Membership Club
- Exclusive indicators
- Proven strategies & setups
- Private Discord community
- ‘Buy The Dip’ signal alerts
- Exclusive members-only content
- Add-ons and resources
- 1 full year of unlimited support
Frequently Asked Questions
What is useThinkScript?
useThinkScript is the #1 community of stock market investors using indicators and other tools to power their trading strategies. Traders of all skill levels use our forums to learn about scripting and indicators, help each other, and discover new ways to gain an edge in the markets.
How do I get started?
We get it. Our forum can be intimidating, if not overwhelming. With thousands of topics, tens of thousands of posts, our community has created an incredibly deep knowledge base for stock traders. No one can ever exhaust every resource provided on our site.
If you are new, or just looking for guidance, here are some helpful links to get you started.
- The most viewed thread:
https://usethinkscript.com/threads/repainting-trend-reversal-for-thinkorswim.183/ - Our most popular indicator:
https://usethinkscript.com/threads/buy-the-dip-indicator-for-thinkorswim.3553/ - Answers to frequently asked questions:
https://usethinkscript.com/threads/answers-to-commonly-asked-questions.6006/
What are the benefits of VIP Membership?
VIP members get exclusive access to these proven and tested premium indicators: Buy the Dip, Advanced Market Moves 2.0, Take Profit, and Volatility Trading Range. In addition, VIP members get access to over 50 VIP-only custom indicators, add-ons, and strategies, private VIP-only forums, private Discord channel to discuss trades and strategies in real-time, customer support, trade alerts, and much more. Learn all about VIP membership here.
How can I access the premium indicators?
To access the premium indicators, which are plug and play ready, sign up for VIP membership here.