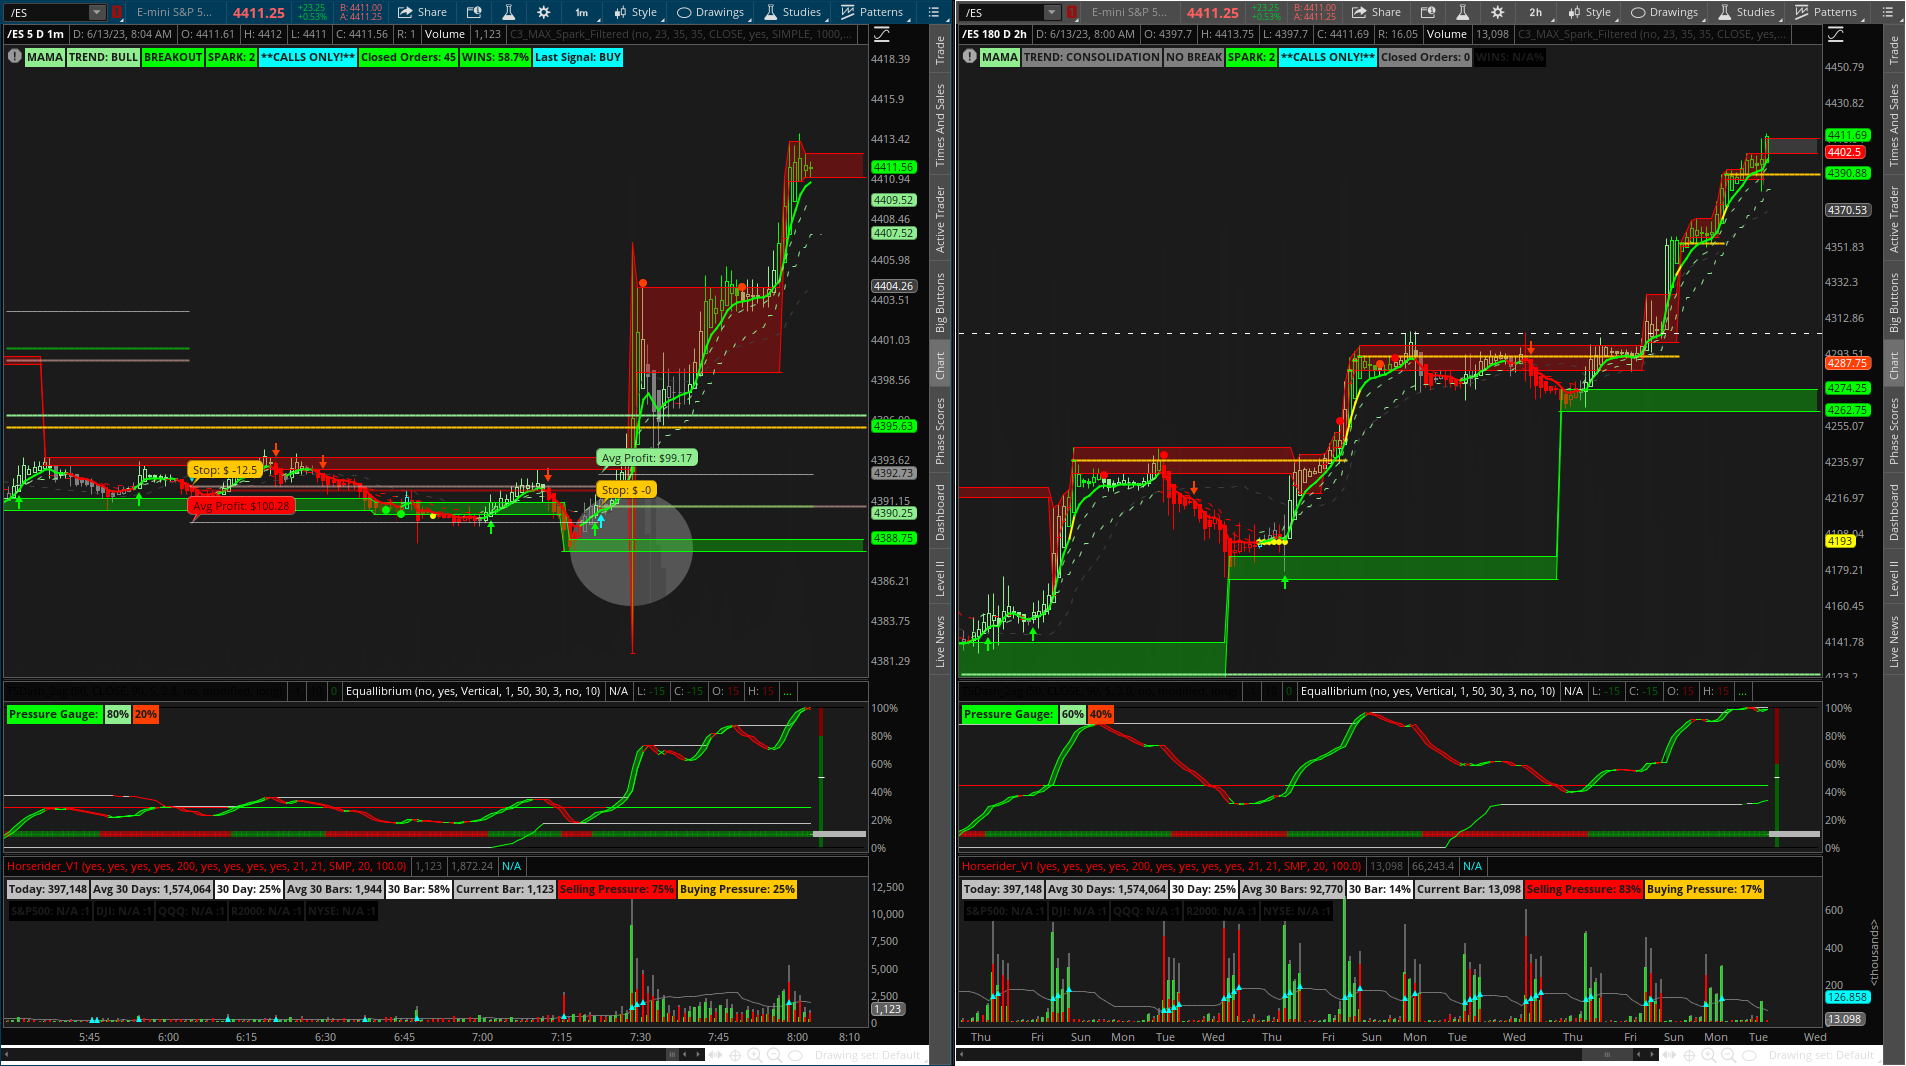
Hey sorry just saw your comment. Yes I will remove them in short order. I do not use them not sure why I left them in the code.@HODL-Lay-HE-hoo!
Hi, is there a quick way to display C3_Max_Spark_Filtered like yours on pg1? I pasted the script but there are about 7-9 moving avg lines on the chart. Is there a quick way to turn those off in the settings besides going to each AvgExp... item individually and turning off its "show" setting at the bottom of the config settings? Thanks in advance, really like your mods and appreciate all your coding time and effort!!!
You are using an out of date browser. It may not display this or other websites correctly.
You should upgrade or use an alternative browser.
You should upgrade or use an alternative browser.
The Confirmation Trend Chart Setup | The End All Be All | For ThinkOrSwim
- Thread starter HODL-Lay-HE-hoo!
- Start date
- Status
- Not open for further replies.
Join useThinkScript to post your question to a community of 21,000+ developers and traders.
Correct. Look for the EMAD EMAs to make a LH HL not the upper chart candles.Hey Hod, May be a dumb question but when you say wait for LH or HL in the EMAD, Do you mean in the EMAD or on the chart, look for at the LH/HL?
PowrEng_65
New member
Hello,
What exactly is candle wrapping?
What exactly is candle wrapping?
can you post the script? I try to import and it doesn't work! Many thanksCurrent chart style(s)
Confirmation Trend | The End All Be All | Chart Style - https://tos.mx/yioyc2k (Link posted 5/11/23) (note: there are two separate TS_V9 versions in the style above - TS Spark Filter cannot repaint and is single aggregation - TS filtered re paint is possible but limited to a few bars (as explained in the TS study post)
New link with stiffness clouds - http://tos.mx/Sy7Cnm9
View attachment 18465
Here you go: https://usethinkscript.com/threads/...-all-be-all-for-thinkorswim.15257/post-124230Hello,
What exactly is candle wrapping?
Wrapping is the “beginning of the overbought / oversold zone” the need to know is this: do not trade against the trend while wrapping as the trend is strong.
Two questions.
1. What do the blue candles signify?
2. Do you have the code to add this as a strategy that can be backtested in ThinkorSwim?
Thank you!
https://usethinkscript.com/threads/...-all-be-all-for-thinkorswim.15257/post-124232
It is Vix Alert4 from “Williams Vix Fix” which measures the volatility of individual stocks and indicates extremes. The altert4 is one of the extremes. In my experience it is only used to indicate a reversal to the upside. I do not have a strategy code for this but I am currently working on using it as a filter for a strategy but not finished. Still working nights unfortunately.
But Vix alert4 is a great indication in context of price action and levels.
Last edited by a moderator:
joehanus18
New member
Just made my first couple of trades using your TS_V9_Spark_Filter setup on the daily timeframe and they were successful, thank you! I was wondering if you've tried or think it would be worth it to make a watchlist for "candle-wrapping."
Just made my first couple of trades using your TS_V9_Spark_Filter setup on the daily timeframe and they were successful, thank you! I was wondering if you've tried or think it would be worth it to make a watchlist for "candle-wrapping."
Nice! if you load the newest link on page one it has the "subject to repaint" label for signals plotting based on a higher TF though the label is not functioning exactly as intended yet. Also has the avg lines etc.
I would love to have a wrapping wl column... unfortunately it is proving extremely difficult if not impossible I have been trying to figure it out on and off for a while with no real progress. But when I do I will certainly post it.
If I can get out of working nights at some point I will attempt to add an indication possibly for a watchlist that indicates when the zones overlap or when a zone crosses below and above the opposite zone...? hmmm... (gray circle)
Also the green and red line added over EMAD is https://usethinkscript.com/threads/dashboard-atr-trailing-stop-for-thinkorswim.9375/post-85061 which is essentially the TS strategy as a line which I set to 11 and 2.2 to show the entry’s and exits without all the arrows… testing it’s usefulness - I also posted on the thread link above an MTF version to test atr period and atr factor settings.

Also the green and red line added over EMAD is https://usethinkscript.com/threads/dashboard-atr-trailing-stop-for-thinkorswim.9375/post-85061 which is essentially the TS strategy as a line which I set to 11 and 2.2 to show the entry’s and exits without all the arrows… testing it’s usefulness - I also posted on the thread link above an MTF version to test atr period and atr factor settings.

Last edited:
Hi @HODL-Lay-HE-hoo!
I love this chart and look forward to using it daily. I have a few questions regarding the price bubble on the side not showing the current price but instead showing the top (of green) or bottom (of red) of the current candle body. Is this intentional?
Also, the Horserider_v1 doesn't appear to work on tick charts, correct?
Finally, can you explain the top bubbles: MAMA, Closed Orders, WINS? (How can I automate the trading?)
Thank you for making this wonderful chart setup.
There is no such arrow at the moment. I can add it for you when I get time. I have a watchlist column for crossing the zero line etc. I will share when I get to my computer.I have been searching and can’t find it, is there an alert or an arrow that can go on the chart when the emad crosses the 0 line, down arrow if down and up arrow if up?
Last edited:
Hmmm I’ll have to look into the price bubble. I don’t think Horserider works on tick.Hi @HODL-Lay-HE-hoo!
I love this chart and look forward to using it daily. I have a few questions regarding the price bubble on the side not showing the current price but instead showing the top (of green) or bottom (of red) of the current candle body. Is this intentional?
Also, the Horserider_v1 doesn't appear to work on tick charts, correct?
Finally, can you explain the top bubbles: MAMA, Closed Orders, WINS? (How can I automate the trading?)
Thank you for making this wonderful chart setup.
Label information in screenshots https://usethinkscript.com/threads/...-all-be-all-for-thinkorswim.15257/post-124250
Awesome. Just be aware of repaint… only the cyan arrows (TS filtered) can repaint read the conditions on page 1. The highest aggregation is 2 aggregations higher than the chart you are looking at thus that this the max amount of time a signal is subject to repaint… however not all are filtered based on the highest aggregation.Just came across this. Going to load it up tonight and start to checking it out. Thank you for sharing. Many great things in here.
Add this code:Thank you for the end all be all, it really is a great tool. One question, how do I get only an alert for when the green or red circles appear?
Input useAlerts3x = yes;
Alert(ExtremeBuy and useAlerts3x, "Buy Signal", Alert.BAR, Sound.Ding);
Alert(RegularBuy and useAlerts3x, "Buy Signal", Alert.BAR, Sound.Ding);
Alert(ExtremeSell and useAlerts3x, "Sell Signal", Alert.BAR, Sound.Ding);
Alert(RegularSell and useAlerts3x, "Sell Signal", Alert.BAR, Sound.Ding);
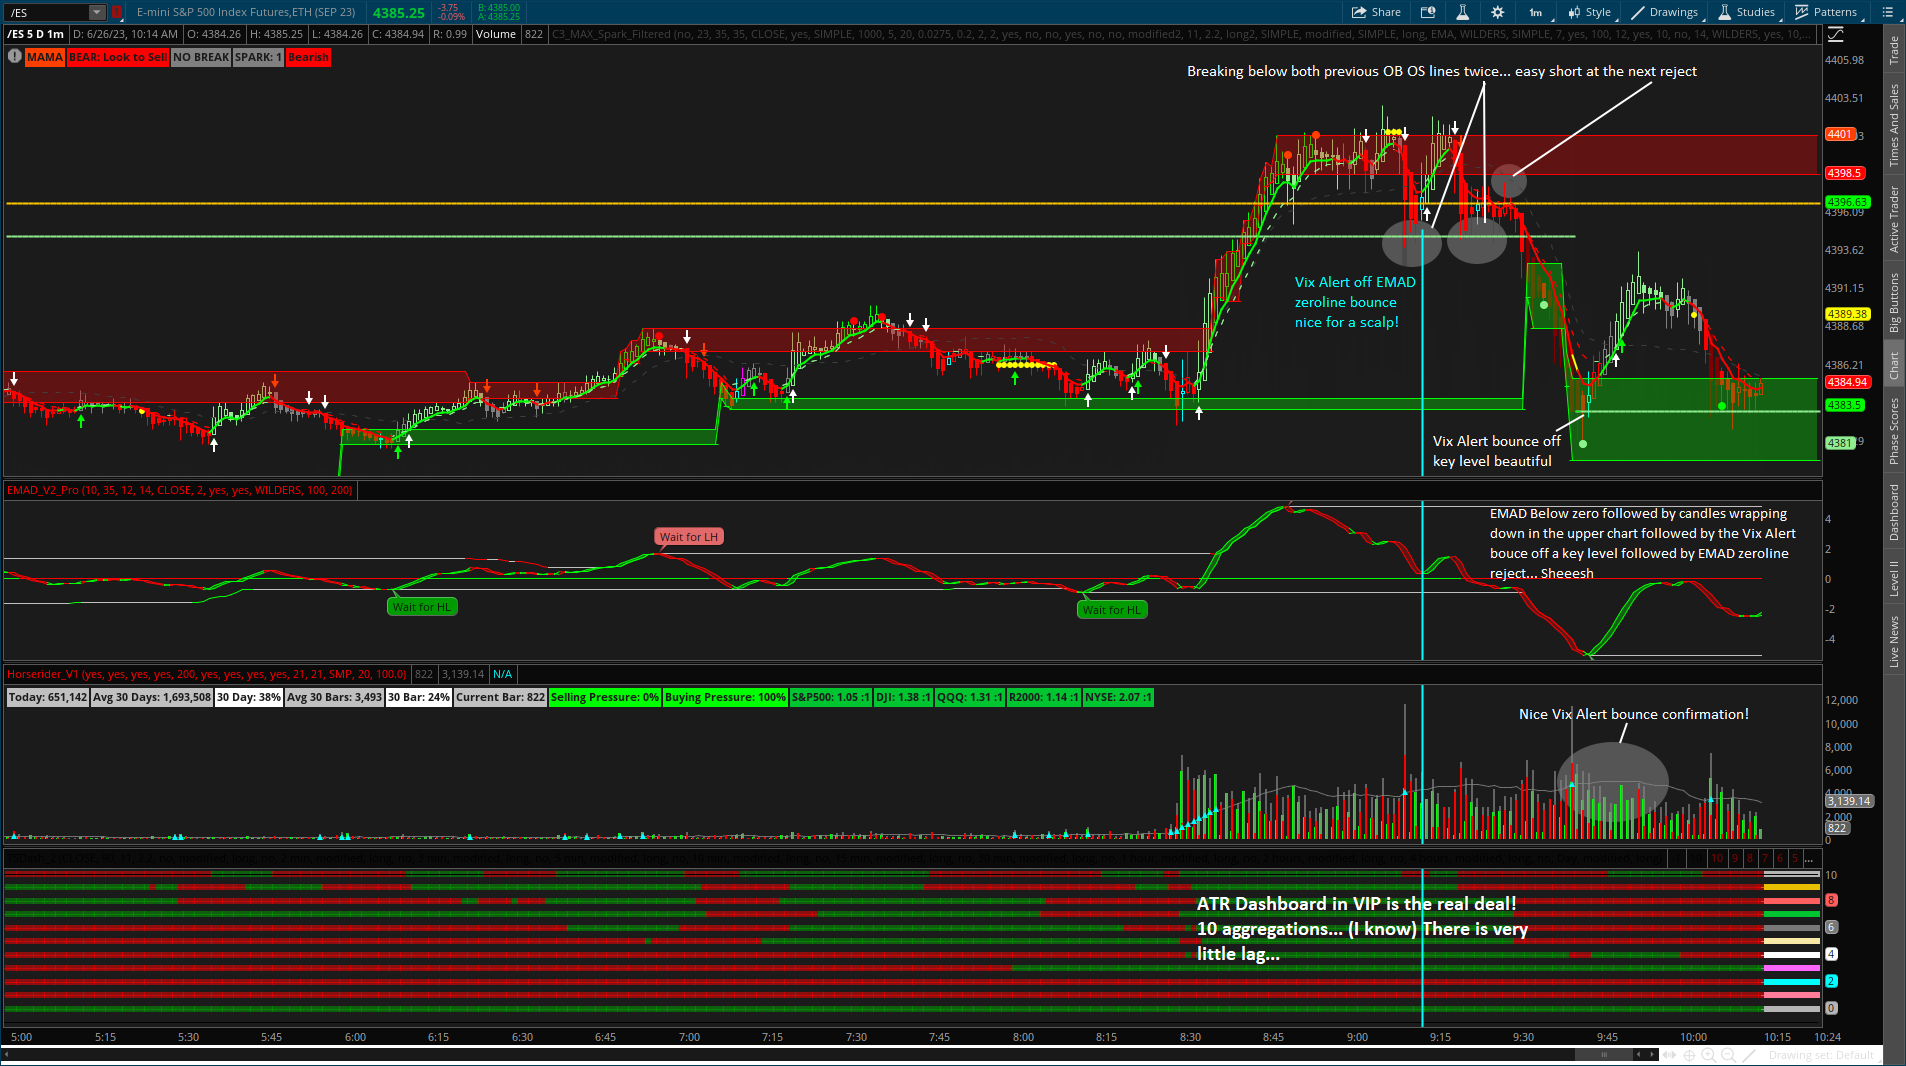
Hello good people... Been trading futures lately on the 1 min chart using ATR Dashboard with 10 aggregations (gotta be VIP cannot share)... I have tried many MTF studies that lag like crazy and this one I do not even notice lag. Also while it certainly can repaint I have not noticed it... at least not near enough to give me a false alarm if that makes sense as there are other TFs to confirm. you will notice TS_V9 is not on this chart ase the ATR lower is similar but does not clutter the chart (if i were to use it in a similar manner, not to mention all the awesome features for the lables and levels etc. would cause lag like crazy with so many aggregations)... That being said GO VIP PEOPLE also I am Still a TS_V9 fan boy.
Also as noted in the image below EMAD entry method, Vix Alert, Key Levels, Previous OB OS levels, Wrapping, and HR Volume... all killing it. Also (i left out notations on the chart for this) Big7 gray candles to alert a potential reversal and the white arrows filtered by TMO...beautiful.

Also as noted in the image below EMAD entry method, Vix Alert, Key Levels, Previous OB OS levels, Wrapping, and HR Volume... all killing it. Also (i left out notations on the chart for this) Big7 gray candles to alert a potential reversal and the white arrows filtered by TMO...beautiful.

I am very confused. I would like to have this indicator with the indicators you are showing in this post. I have uploaded 4 sets of codes and I am getting bits and pieces of the indicators on the charts. Do you have code that will give me most of the chart indicators?DISCLAIMER: Part of this strategy uses an MTF indicators (multi-timeframe). You will see the MTF signals repaint until the higher timeframe candle closes.
Introduction to thread
Good people, welcome. The goal of this thread is to provide basic and detailed information concerning chart style(s) and studies modified by yours truly as seen previously in the Confirmation Candles thread authored by the legend @Christopher84. I will post any future modifications, study variations, screenshots, and answer any and all relevant questions from this thread. Thus, our journey down the rabbit hole continues!
Disclaimer: There is no end all be all indicator that will replace the need for risk management. If you do not manage your risk your account will be destroyed sooner or later… Good day.
Jump to post…
Current Chart Style (#2) - https://usethinkscript.com/threads/the-confirmation-trend-chart-setup-for-thinkorswim.15257/post-124229
Chart Style General Information (#3) - https://usethinkscript.com/threads/the-confirmation-trend-chart-setup-for-thinkorswim.15257/post-124250
Frequently Asked Questions (#10) - https://usethinkscript.com/threads/the-confirmation-trend-chart-setup-for-thinkorswim.15257/post-124251
Attachments
- Status
- Not open for further replies.
Similar threads
-
Volume Confirmation for a Trend System For ThinkOrSwim
- Started by GLENNOHULL
- Replies: 4
-
Confirmation Candle with Key Level and Weighted Paintbars Chart Setup For ThinkOrSwim
- Started by rip78
- Replies: 8
-
Confirmation Candles Indicator For ThinkorSwim
- Started by Christopher84
- Replies: 3K
-
DEMA Crossover with Heikin-Ashi Candle Confirmation for ThinkorSwim
- Started by theelderwand
- Replies: 67
-
Not the exact question you're looking for?
Start a new thread and receive assistance from our community.
87k+
Posts
1550
Online
Similar threads
-
Volume Confirmation for a Trend System For ThinkOrSwim
- Started by GLENNOHULL
- Replies: 4
-
Confirmation Candle with Key Level and Weighted Paintbars Chart Setup For ThinkOrSwim
- Started by rip78
- Replies: 8
-
Confirmation Candles Indicator For ThinkorSwim
- Started by Christopher84
- Replies: 3K
-
DEMA Crossover with Heikin-Ashi Candle Confirmation for ThinkorSwim
- Started by theelderwand
- Replies: 67
-
The Market Trading Game Changer
Join 2,500+ subscribers inside the useThinkScript VIP Membership Club
- Exclusive indicators
- Proven strategies & setups
- Private Discord community
- ‘Buy The Dip’ signal alerts
- Exclusive members-only content
- Add-ons and resources
- 1 full year of unlimited support
Frequently Asked Questions
What is useThinkScript?
useThinkScript is the #1 community of stock market investors using indicators and other tools to power their trading strategies. Traders of all skill levels use our forums to learn about scripting and indicators, help each other, and discover new ways to gain an edge in the markets.
How do I get started?
We get it. Our forum can be intimidating, if not overwhelming. With thousands of topics, tens of thousands of posts, our community has created an incredibly deep knowledge base for stock traders. No one can ever exhaust every resource provided on our site.
If you are new, or just looking for guidance, here are some helpful links to get you started.
- The most viewed thread:
https://usethinkscript.com/threads/repainting-trend-reversal-for-thinkorswim.183/ - Our most popular indicator:
https://usethinkscript.com/threads/buy-the-dip-indicator-for-thinkorswim.3553/ - Answers to frequently asked questions:
https://usethinkscript.com/threads/answers-to-commonly-asked-questions.6006/
What are the benefits of VIP Membership?
VIP members get exclusive access to these proven and tested premium indicators: Buy the Dip, Advanced Market Moves 2.0, Take Profit, and Volatility Trading Range. In addition, VIP members get access to over 50 VIP-only custom indicators, add-ons, and strategies, private VIP-only forums, private Discord channel to discuss trades and strategies in real-time, customer support, trade alerts, and much more. Learn all about VIP membership here.
How can I access the premium indicators?
To access the premium indicators, which are plug and play ready, sign up for VIP membership here.


