The Confirmation Trend Chart Setup | The End All Be All | For ThinkOrSwim

is there a scanner for this indicator?
DISCLAIMER: Part of this strategy uses an MTF indicators (multi-timeframe). You will see the MTF signals repaint until the higher timeframe candle closes.

Introduction to thread

Good people, welcome. The goal of this thread is to provide basic and detailed information concerning chart style(s) and studies modified by yours truly as seen previously in the Confirmation Candles thread authored by the legend @Christopher84. I will post any future modifications, study variations, screenshots, and answer any and all relevant questions from this thread. Thus, our journey down the rabbit hole continues!

Disclaimer: There is no end all be all indicator that will replace the need for risk management. If you do not manage your risk your account will be destroyed sooner or later… Good day.


Jump to post…

Current Chart Style (#2) - https://usethinkscript.com/threads/the-confirmation-trend-chart-setup-for-thinkorswim.15257/post-124229

Chart Style General Information (#3) - https://usethinkscript.com/threads/the-confirmation-trend-chart-setup-for-thinkorswim.15257/post-124250

Frequently Asked Questions (#10) - https://usethinkscript.com/threads/the-confirmation-trend-chart-setup-for-thinkorswim.15257/post-124251
is there a scanner for this indicator
 

Join useThinkScript to post your question to a community of 21,000+ developers and traders.

Frequently Asked Questions

This post will answer frequently asked questions concerning the Confirmation Trend Chart Style & Indicators.

FAQ 1
Do any of the studies in the confirmation trend chart style repaint?
  • Yes. The TS_V9_Filtered study can repaint however is limited to the highest ag setting.
FAQ 2
What version / chart style are you currently using?
  • The most recent chart style for the Confirmation Trend Chart Style will replace the link in post 2
FAQ 3
What is the recommended timeframe for using the Confirmation Trend Chart Style?
  • The Confirmation Trend Chart Style will work well on any timeframe chart
  • Use whichever chart is easiest for you to understand the price action, trend, & indications.
FAQ 4
Is it recommended to use the Confirmation Trend Chart Style with After-hours on or off?
  • Whichever you prefer
  • Leaving after-hours on can help you determine the strength of a trend or price action at open
  • If the overall trend is easier to determine with after-hours off - leave it off
FAQ 5
Will Confirmation Trend Chart Style work for swing trading on the daily chart?
  • Yup


FAQ 1.1
Do you day trade / swing trade stocks or options?
  • Day trade options relatively close to expiration
Where do I find the most recent script for Confirmation Trend? many thanks in advance for your help.
 
I apologize if this is answered elsewhere... is there a way to turn off the stop/average price bubbles? I have tried various buttons to no avail. Thank you.
Screenshot (6).png
 
I downloaded your script and have some questions. What history does closed orders refer to? What about Wins, and last signal? I am attaching a few charts. I appreciate all your posted scripts and comments and have downloaded many.
The breakdown of those labels is on page one TS post... how many closed orders is the number of: buys and sells for however long your chart goes back - wins is the % of those buys and sells that were winning trades - the reason for the last trade label is due to the version you are using (TS_V9_Filtered) has 3 aggregations to filter the signals (basically if the lower tf agrees with a higher but more explination on page one) anyway long story short because there are less arrows I added the label as at times it is off screen
 
They are on page one under the "Entry Methods" section but I'll take a few new ones

More EMAD entry examples here: https://usethinkscript.com/threads/...-all-be-all-for-thinkorswim.15257/post-125163

Zone entry method (3 step) here https://usethinkscript.com/threads/...-all-be-all-for-thinkorswim.15257/post-125164

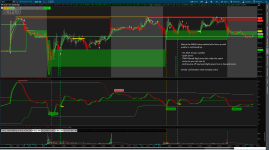
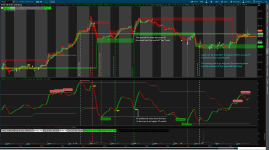
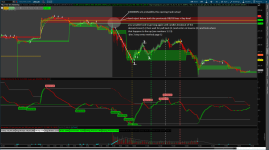
Here are some new screenshots for the EMAD entry method:
*** note: orange and green horizontal lines are for long entry
- white and red horizontal lines are for short entry ***
 

Attachments

  • EMAD E1.png
    EMAD E1.png
    414 KB · Views: 256
  • EMAD E2.png
    EMAD E2.png
    436.7 KB · Views: 261
  • EMAD E3.png
    EMAD E3.png
    420.1 KB · Views: 248
Last edited:
is there a scanner for this indicator?

is there a scanner for this indicator
which one? Each indicator used is shown individually on page one if you need to reference the name of the study. I personally do not use scans but there are scans for some of them if you let me know which one you are looking for. (ill work on posting some to page 1 soon)
 
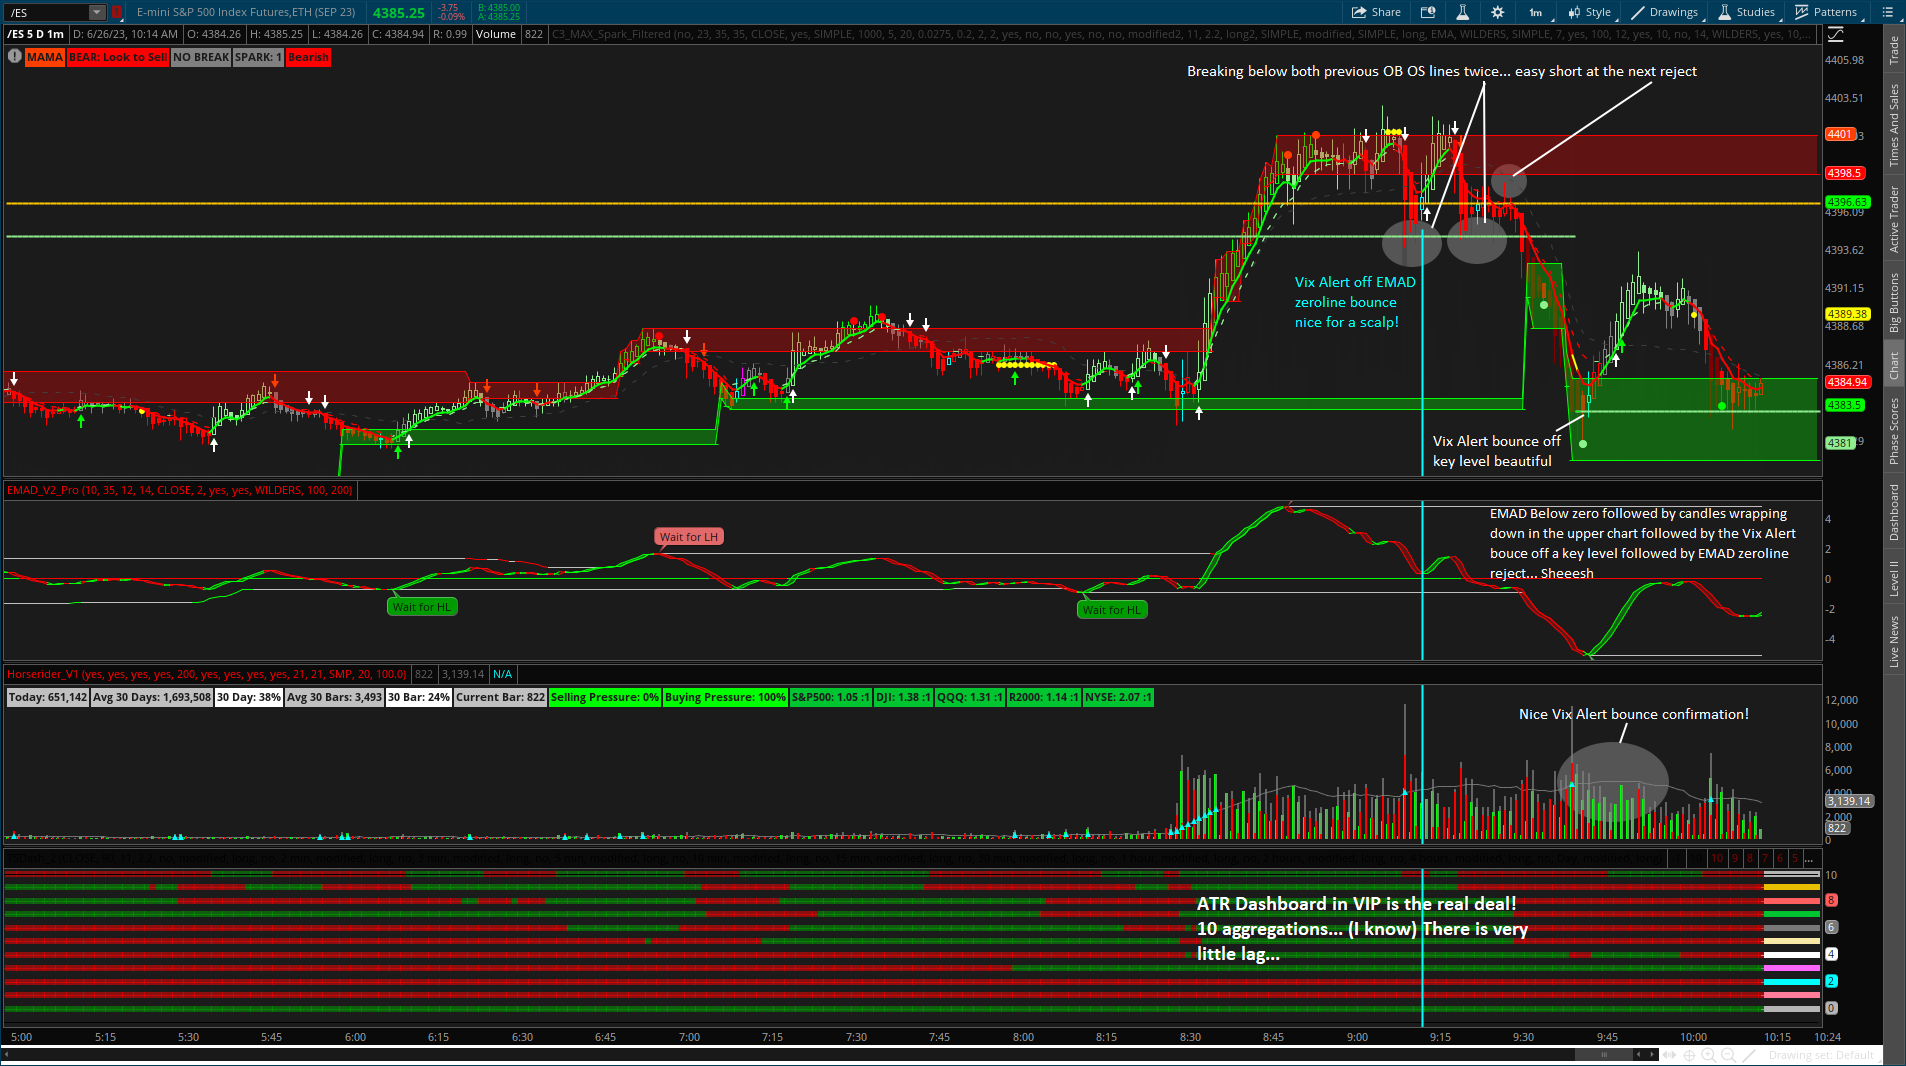
Hello good people... Been trading futures lately on the 1 min chart using ATR Dashboard with 10 aggregations (gotta be VIP cannot share)... I have tried many MTF studies that lag like crazy and this one I do not even notice lag. Also while it certainly can repaint I have not noticed it... at least not near enough to give me a false alarm if that makes sense as there are other TFs to confirm. you will notice TS_V9 is not on this chart ase the ATR lower is similar but does not clutter the chart (if i were to use it in a similar manner, not to mention all the awesome features for the lables and levels etc. would cause lag like crazy with so many aggregations)... That being said GO VIP PEOPLE also I am Still a TS_V9 fan boy.

Also as noted in the image below EMAD entry method, Vix Alert, Key Levels, Previous OB OS levels, Wrapping, and HR Volume... all killing it. Also (i left out notations on the chart for this) Big7 gray candles to alert a potential reversal and the white arrows filtered by TMO...beautiful.

4PUIoKr.png
May i get the chart link please , looks very promising
 
Last edited by a moderator:
hey buddy ive been pulling my hair out looking for the line that sets the stop labels as yellow, i want to separate the buy and sell stops and make them green and red, if you can help me that would be wonderful


View attachment 19171
Alright this might be impossible but i swear you can find 300%+ gainers weekly if this can be done, i would need a scan that shows when the Stops appear on the 1hr chart
 

Not the exact question you're looking for?

Start a new thread and receive assistance from our community.

87k+ Posts
355 Online
Create Post

The Market Trading Game Changer

Join 2,500+ subscribers inside the useThinkScript VIP Membership Club
  • Exclusive indicators
  • Proven strategies & setups
  • Private Discord community
  • ‘Buy The Dip’ signal alerts
  • Exclusive members-only content
  • Add-ons and resources
  • 1 full year of unlimited support

Frequently Asked Questions

What is useThinkScript?

useThinkScript is the #1 community of stock market investors using indicators and other tools to power their trading strategies. Traders of all skill levels use our forums to learn about scripting and indicators, help each other, and discover new ways to gain an edge in the markets.

How do I get started?

We get it. Our forum can be intimidating, if not overwhelming. With thousands of topics, tens of thousands of posts, our community has created an incredibly deep knowledge base for stock traders. No one can ever exhaust every resource provided on our site.

If you are new, or just looking for guidance, here are some helpful links to get you started.

What are the benefits of VIP Membership?
VIP members get exclusive access to these proven and tested premium indicators: Buy the Dip, Advanced Market Moves 2.0, Take Profit, and Volatility Trading Range. In addition, VIP members get access to over 50 VIP-only custom indicators, add-ons, and strategies, private VIP-only forums, private Discord channel to discuss trades and strategies in real-time, customer support, trade alerts, and much more. Learn all about VIP membership here.
How can I access the premium indicators?
To access the premium indicators, which are plug and play ready, sign up for VIP membership here.
Back
Top