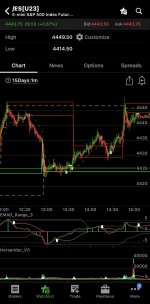
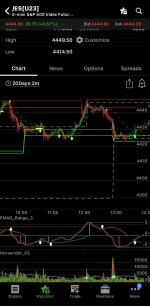
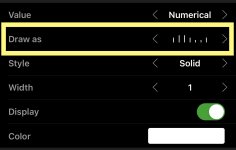
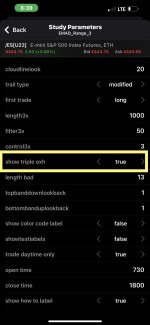
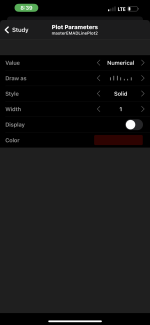
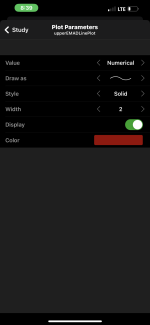
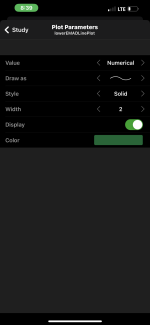
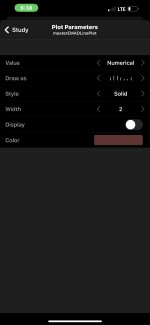
waiting on the EMAD lower high
You are using an out of date browser. It may not display this or other websites correctly.
You should upgrade or use an alternative browser.
You should upgrade or use an alternative browser.
The Confirmation Trend Chart Setup | The End All Be All | For ThinkOrSwim
- Thread starter HODL-Lay-HE-hoo!
- Start date
- Status
- Not open for further replies.
Join useThinkScript to post your question to a community of 21,000+ developers and traders.
Nice work! here are some thoughts... (it could also be helpful to keep indicating subsequent LH and HLs until the top or bottom line is touched and thinking out loud here but it may be useful to evaluate the the distance the top or bottom line is to the zero line... also could be useless. maybe something to evaluate when the ema's are trending down while the lower range is stepping up or previously stepped up... thanks alot @vhawkx you got me going down this rabbit hole again... haha)@HODL-Lay-HE-hoo! you and @Christopher84 have given so much to this community. Trying to give back so this is what I came up with that can indicate the first and second higher lows and lower highs off the top and bottom bands.
I used the V2 that you had posted on the 1st page as the basis of the code. Changed both top and bottom band lengths back to 100 and removed the bubbles and replaced them with vertical lines. Also used the fold function to allow the customization of the lookback filter for the bounce up and down indicators.
https://tos.mx/quM6rl1
Feel free to change it up to your format or liking. Hope this helps everyone! @METAL, it looks like you were looking for this so check it out if you're still using EMAD in your trading.

not going to lie the HL LH arrows on the one min are doing well today haha nice. but that being said i know repeatability is going to be an issue with this.
Last edited:
still a work in progress but this is what I have so far if @vhawkx or whoever wants to mess with it....
I have most of the test variables created with labels...

I have most of the test variables created with labels...

Code:
#EMAD Range by @ Christopher84
#EMAD V2 - added line color conditions HODL
#EMAD V3 - added HL/LH indicators and changed bounce line filters to fold function by vhawkx 2023-08-10

#DECLARATIONS
declare lower;
#USER INPUTS
## Upper and Lower EMAD Lines
input fastLength = 10;
input slowLength = 35;
input smoothLength = 12;
input smoothLength2 = 14;
input priceType = close;
input emadLineWeight = 2;
input showEMACloud = yes;
input averageType = AverageType.WILDERS;
input showBounceUpDownLines = yes;
input filterBounceLines = 2;
input bandLength = 100;
input bandLength2 = 100;
input x = 10;
input topbanddownlookback = 5;
input bottombanduplookback = 5;
#GLOBAL COLOR DEFINITIONS
DefineGlobalColor("Green", CreateColor(0, 155, 0));
DefineGlobalColor("Red", CreateColor(225, 105, 105));
DefineGlobalColor("Gray", CreateColor(192, 192, 192));
DefineGlobalColor("Yellow", CreateColor(231, 190, 0));
DefineGlobalColor("EMAD Bounce Up Line", Color.GREEN);
DefineGlobalColor("EMAD Bounce Down Line", Color.RED);
#DEFINITIONS / CALCULATIONS
## UPPER EMAD LINE
def fastExpAvg = ExpAverage(priceType, fastLength);
def slowExpAvg = ExpAverage(priceType, slowLength);
def EMAD = (priceType - fastExpAvg);
def EMAD2 = (priceType - slowExpAvg);
def EMADAvg = (EMAD + EMAD2) / 2;
def upperEMADLine = ExpAverage(EMADAvg, smoothLength);
## LOWER EMAD LINE
def emadOpen = (upperEMADLine + upperEMADLine[1]) / 2;
def emadHigh = Max(upperEMADLine, upperEMADLine[1]);
def emadLow = Min(upperEMADLine, upperEMADLine[1]);
def emadClose = upperEMADLine;
def bottom = Min(emadClose[1], emadLow);
def tr = TrueRange(emadHigh, emadClose, emadLow);
def ptr = tr / (bottom + tr / 2);
def APTR = MovingAverage(averageType, ptr, smoothLength2);
def upperBand = emadClose[1] + (APTR * emadOpen);
def lowerBand = emadClose[1] - (APTR * emadOpen);
def lowerEMADLine = (upperBand + lowerBand) / 2;
## TOP AND BOTTOM BANDS
def zeroLineData = if IsNaN(close) then Double.NaN else 0;
def EMADSUp = upperEMADLine > zeroLineData;
def EMADSDown = upperEMADLine < zeroLineData;
def EMADdown = (lowerEMADLine > upperEMADLine);
def EMADup = (upperEMADLine >= lowerEMADLine);
def topBand = Highest(lowerEMADLine, bandLength);
def bottomBand = Lowest(lowerEMADLine, bandLength);
## BAND DIRECTION (USED ONLY FOR COLORING - NOT USED FOR PLOTS)
def topBandStepDown = if topBand < topBand[1] then 1 else 0;
def topBandStepUp = if topBand > topBand[1] then 1 else 0;
def bottomBandStepDown = if bottomBand < bottomBand[1] then 1 else 0;
def bottomBandStepUp = if bottomBand > bottomBand[1] then 1 else 0;
def bothBandsDown = bottomBandStepDown and topBandStepDown;
def bothBandsUp = bottomBandStepUp and topBandStepUp;
def bullBias = (bottomBand > zeroLineData);
def bearBias = (topBand < zeroLineData);
## BOUNCES FROM TOP AND BOTTOM BANDS
def midBand = (upperBand + lowerBand) / 2;
def crossesUp = if (midBand[1] > upperEMADLine[1])and(midBand < upperEMADLine) then 1 else 0;
def crossesDown = if (upperEMADLine[1] > midBand[1])and(upperEMADLine < midBand) then 1 else 0;
def valueUp = if crossesUp then midBand else 0;
def valueDown = if crossesDown then midBand else 0;
def crossesUpline = if (valueUp - bottomBand) == 0 then 1 else 0;
def crossesDownline = if (valueDown - topBand) == 0 then 1 else 0;
def crossesUpLine_lookback = fold uu = 1 to filterBounceLines with pp do pp + crossesUpLine[uu];
def crossesDownLine_lookback = fold dd = 1 to filterBounceLines with nn do nn + crossesDownLine[dd];
def crossesUpLine_filter = if crossesUpLine and crossesUpLine_lookback then 0 else 1;
def crossesDownLine_filter = if crossesDownLine and crossesDownLine_lookback then 0 else 1;
AddVerticalLine(showbounceUpDownLines and crossesUpline and crossesUpLine_filter, "", GlobalColor("EMAD Bounce Up Line"));
AddVerticalLine(showbounceUpDownLines and crossesDownline and crossesDownLine_filter, "", GlobalColor("EMAD Bounce Down Line"));
## FIRST HL AND LH
def HL = crossesUpline == 0 and upperEMADLine crosses above lowerEMADLine;
def LH = crossesDownline == 0 and upperEMADLine crosses below lowerEMADLine;
def bounceUpOnce = crossesUpline <> crossesUpline[1];
def bounceDnOnce = crossesDownline <> crossesDownline[1];
def trackCrUp = if bounceUpOnce then 0 else if HL then 1 else trackCrUp[1];
def trackCrDn = if bounceDnOnce then 0 else if LH then 1 else trackCrDn[1];
## SECOND HL AND LH
def HLalready = if trackCrUp and !trackCrUp[1] then 1 else 0;
def LHalready = if trackCrDn and !trackCrDn[1] then 1 else 0;
def HL2 = HLalready == 0 and upperEMADLine crosses above lowerEMADLine;
def LH2 = LHalready == 0 and upperEMADLine crosses below lowerEMADLine;
def crossedUpOnce = HLalready <> HLalready[1];
def crossedDnOnce = LHalready <> LHalready[1];
def trackCrUp2 = if crossedUpOnce then 0 else if HL2 then 1 else trackCrUp2[1];
def trackCrDn2 = if crossedDnOnce then 0 else if LH2 then 1 else trackCrDn2[1];
#PLOTS
plot zeroLine = zeroLineData;
plot upperEMADLinePlot = upperEMADLine;
plot lowerEMADLinePlot = lowerEMADLine;
plot masterEMADLinePlot = (upperEMADLinePlot + lowerEMADLinePlot) / 2;
plot topBandPlot = topBand;
plot bottomBandPlot = bottomBand;
plot firstHL = if trackCrUp and !trackCrUp[1] then lowerEMADLine else double.nan;
firstHL.SetPaintingStrategy(PaintingStrategy.ARROW_UP);
firstHL.SetLineWeight(1);
firstHL.SetDefaultColor(Color.YELLOW);
firstHL.HideBubble();
firstHL.HideTitle();
plot firstLH = if trackCrDn and !trackCrDn[1] then lowerEMADLine else double.nan;
firstLH.SetPaintingStrategy(PaintingStrategy.ARROW_DOWN);
firstLH.SetLineWeight(1);
firstLH.SetDefaultColor(Color.YELLOW);
firstLH.HideBubble();
firstLH.HideTitle();
plot secondHL = if trackCrUp2 and !trackCrUp2[1] and !crossesUpLine then lowerEMADLine else double.nan;
secondHL.SetPaintingStrategy(PaintingStrategy.ARROW_UP);
secondHL.SetLineWeight(1);
secondHL.SetDefaultColor(Color.CYAN);
secondHL.HideBubble();
secondHL.HideTitle();
plot secondLH = if trackCrDn2 and !trackCrDn2[1] and !crossesDownLine then lowerEMADLine else double.nan;
secondLH.SetPaintingStrategy(PaintingStrategy.ARROW_DOWN);
secondLH.SetLineWeight(1);
secondLH.SetDefaultColor(Color.CYAN);
secondLH.HideBubble();
secondLH.HideTitle();
#FORMATTING
upperEMADLinePlot.HideTitle();
upperEMADLinePlot.HideBubble();
upperEMADLinePlot.AssignValueColor(
    if (lowerEMADLinePlot > upperEMADLinePlot) then Color.red
    else if (lowerEMADLinePlot < upperEMADLinePlot) then Color.green
    else GlobalColor("Gray")
);
lowerEMADLinePlot.HideTitle();
lowerEMADLinePlot.HideBubble();
lowerEMADLinePlot.AssignValueColor(
    if (lowerEMADLinePlot > upperEMADLinePlot) then Color.red
    else if (lowerEMADLinePlot < upperEMADLinePlot) then Color.green
    else GlobalColor("Gray")
);
masterEMADLinePlot.HideTitle();
masterEMADLinePlot.HideBubble();
masterEMADLinePlot.SetLineWeight(emadLineWeight);
masterEMADLinePlot.AssignValueColor(
    if masterEMADLinePlot > masterEMADLinePlot[2] then Color.green
    else if masterEMADLinePlot < masterEMADLinePlot[2] then Color.red
    else GlobalColor("Gray")
);
zeroLine.HideTitle();
zeroLine.HideBubble();
zeroLine.AssignValueColor(
    if (upperEMADLinePlot > zeroLine) then  Color.green
    else if (upperEMADLinePlot < zeroLine) then  Color.red
    else GlobalColor("Yellow")
);
topBandPlot.HideTitle();
topBandPlot.HideBubble();
topBandPlot.AssignValueColor(
    if bothBandsDown then Color.dark_red
    else if bothBandsUp then color.Dark_green
    else if topBandStepUp then Color.green
    else if topBandStepDown then Color.red
    else if bearBias then  Color.yellow
    else GlobalColor("Gray")
);
bottomBandPlot.HideTitle();
bottomBandPlot.HideBubble();
bottomBandPlot.AssignValueColor(
    if bothBandsDown then Color.dark_red
    else if bothBandsUp then color.Dark_green
    else if bottomBandStepUp then Color.green
    else if bottomBandStepDown then Color.red
    else if bullBias then Color.yellow
    else  GlobalColor("Gray")
);
#CLOUDS
AddCloud(if showEMACloud and (lowerEMADLinePlot > upperEMADLinePlot) then lowerEMADLinePlot else Double.NaN, upperEMADLinePlot, GlobalColor("Red"), Color.CURRENT);
AddCloud(if showEMACloud and (upperEMADLinePlot >= lowerEMADLinePlot) then upperEMADLinePlot else Double.NaN, lowerEMADLinePlot, GlobalColor("Green"), Color.CURRENT);

## TESTING
def bn = barnumber();
# Calculate Slope
def HowManyPeriodsBackForSlopeMeasure= 1;
def agg = aggregationPeriod.Day;
def SMA = masterEMADLinePlot;
def opposite = (SMA - SMA[HowManyPeriodsBackForSlopeMeasure])/SMA[HowManyPeriodsBackForSlopeMeasure];
def adjacent = HowManyPeriodsBackForSlopeMeasure * 0.5;
def tan = opposite / adjacent;
def angle = ROUND(atan(tan)* 180 / Double.Pi, 2);
# Calculate Slope
def HowManyPeriodsBackForSlopeMeasure2= 1;
def agg2 = aggregationPeriod.Day;
def SMA2 = lowerEMADLinePlot;
def opposite2 = (SMA2- SMA2[HowManyPeriodsBackForSlopeMeasure2])/SMA2[HowManyPeriodsBackForSlopeMeasure2];
def adjacent2 = HowManyPeriodsBackForSlopeMeasure2 * 0.5;
def tan2 = opposite2 / adjacent2;
def angle2 = ROUND(atan(tan2)* 180 / Double.Pi, 2);
# Calculate Slope
def HowManyPeriodsBackForSlopeMeasure3= 1;
def agg3 = aggregationPeriod.Day;
def SMA3 = uppereMADLinePlot;
def opposite3 = (SMA3 - SMA3[HowManyPeriodsBackForSlopeMeasure3])/SMA3[HowManyPeriodsBackForSlopeMeasure3];
def adjacent3 = HowManyPeriodsBackForSlopeMeasure3 * 0.5;
def tan3 = opposite3 / adjacent3;
def angle3 = ROUND(atan(tan3)* 180 / Double.Pi, 2);
def masterCondition = if (MasterEMADLineplot > MasterEMADLineplot[1]) then 1 else if (MasterEMADLineplot < MasterEMADLineplot[1]) then -1 else 0;
def topbanddown_lookback = fold uuu = 1 to topbanddownlookback with ppp do ppp + topBandStepdown[uuu];
def bottombandup_lookback = fold ddd = 1 to bottombanduplookback with nnn do nnn + bottomBandStepup[ddd];
def topbanddownmstrup_filter = if topbanddown_lookback then 1 else 0;
def bottombandupmstrdn_filter = if bottombandup_lookback then 1 else 0;
def Topdown = topBandStepDown and topbanddownmstrup_filter;
def bottomup = bottomBandStepup and bottombandupmstrdn_filter;
def EmaUpTopDnWx = topdown and mastercondition == 1;
def EmaDNBotUpWx = bottomup and mastercondition == -1;
def HLdistance = if crossesup and bearbias and !crossesUpline then absvalue((valueup - bottombandplot)) else HLdistance[1];
def LHdistance = if crossesdown and bullbias and !crossesDownline then absvalue((topbandplot - valuedown)) else LHdistance[1];
def topstepdownbn = if topbandstepdown then bn else topstepdownbn[1];
def bottomstepupbn = if bottomBandStepup then bn else bottomstepupbn[1];
def crossupbn = if crossesup then bn else crossupbn[1];
def crossdownbn = if crossesdown then bn else crossdownbn[1];
def crossupwithin = if crossupbn < bn then bn - crossupbn else crossupwithin[1];
def crossdownwithin = if crossdownbn < bn then bn - crossdownbn else crossupwithin[1];
AddLabel(yes, "HL to Bottom: "+ round(HLdistance,2), CreateColor(205,  73, 0));
AddLabel(yes, "LH to Top: "+ round(LHdistance,2), CreateColor(205,  73, 0));

#def BotupEMAdown = if
AddLabel(yes, "Cross Up within: "+crossupwithin + " Bars", color.orange);
AddLabel(yes, "Cross Down within: "+crossdownwithin + " Bars", color.orange);
AddLabel(yes, "Slope M: " + angle,if ((sign(angle) == -1) and (angle <= 5)) then color.dark_green else if ((angle >= 0) and (angle < 5)) or (angle <=0) then color.gray else if ((sign(angle) == 1) and (angle > 5)) then color.dark_red else color.black);
AddLabel(yes, "Slope L: " +  absvalue(angle2), if ((sign(angle2) == -1) and (angle2 <= 5)) then color.dark_green else if ((angle2 >= 0) and (angle2 < 5)) or (angle2 <=0) then color.gray else if ((sign(angle2) == 1) and (angle2 > 5)) then color.dark_red else color.black);
AddLabel(yes, "Slope U: " + absvalue(angle3), if ((sign(angle3) == -1) and (angle3 <= 5)) then color.dark_green else if ((angle3 >= 0) and (angle3 < 5)) or (angle3 <=0) then color.gray else if ((sign(angle3) == 1) and (angle3 > 5)) then color.dark_red else color.black);
AddLabel(yes, "Height: "+round(masterEMADLinePlot,2), color.white);
AddLabel(yes, "EMA Width: " + round(AbsValue(upperEMADLinePlot - lowerEMADLinePlot),2), color.white);
AddLabel(yes, "HL to Bottom: "+ round(HLdistance,2), CreateColor(205,  73, 0));
AddLabel(yes, "LH to Top: "+ round(LHdistance,2), CreateColor(205,  73, 0));
AddLabel(yes, "Watch for Zero Bounce" , if round(absvalue(masterEMADLinePlot),2) < .5 then color.cyan else color.dark_gray);
AddLabel(yes, "EMA's Up & Top Down: " + (topBandStepDown and EMADSUp), CreateColor(191,  61, 0));
AddLabel(yes, "EMA's Down & Top Up: " + (bottomBandStepUp and EMADSDown), CreateColor(191,  61, 0));
AddLabel(yes, "M Up-Top Down W/ x: "+ topbanddownlookback + ": " + (EmaUpTopDnWx),if EmaUpTopDnWx then color.green else CreateColor(177,  50, 0));
AddLabel(yes, "M down -Bottom up x: "+ bottombanduplookback + ": " + (EmaDNBotUpWx),if EmaDNBotUpWx then color.green else CreateColor(177,  50, 0));
AddLabel(yes, "M Up Top Down < 0 "+ topbanddownlookback + ": " + (topBandStepDown and EMADSDown),if (topBandStepDown and EMADSDown) then CreateColor(133,  24, 0) else CreateColor(165,  42, 0));
AddLabel(yes, "M Up Bottom Down > 0 "+ bottombanduplookback + ": " + (topBandStepDown and EMADSUp),if (topBandStepDown and EMADSUp) then color.green else CreateColor(165,  42, 0));


#endGood people... I give you... HorseRider Volume V3
First I modified labels to include the 30 day average (as opposed to a separate label). The 30 day average is compared to todays Volume - The original version indicates that value as a percent - 100% would mean the volume today is equal to the average volume over 30 days - this version I modified to show only the amount above or below average - the text will also change to "above" or "below" and the same concept for the 30 Bar average. I also changed the average calculations to a fold function... why not? Added user inputs for coloring the labels:
30 Day Average and 30 Bar Average label coloring:
If the percent difference > colorpercentdiff (user input) then color.green else color.gray
Buying pressure and selling pressure labels
If the selling pressure is > colorsellpercent (user input) and the volume is > Hotpercent (user input) then color.cyan
If the selling pressure is > 55 then Color.red
else color.gray
If the buying pressure is > colorbuypercent (user input) and total volume is > Hotpercent (user input) then color.cyan
If the buying pressure is > 55 then color.green
else color.gray
Dangity darn… put the percent difference for days on both labels… I’ll fix it in short order. (updated in terminal)
share link: http://tos.mx/fnho2Ql

Code:
# Horserider Volume V3 - Modified by HODL
# Volume Buy Sell Pressure with Hot Percent for ThinkorSwim
# Show total volume in gray.  Buying volume in green.  Sell Volume in red.
# Volume average is gray line.
# Specified percent over average volume is cyan triangles.
# Horserider 12/30/2019 derived from some already existing studies.
declare lower;
#Inputs
input colorsellpercent = 55;
input colorbuypercent = 55;
input colorpercdiff = 0;
input Days_Vol_Avg = 30;
input Bars_Vol_Avg = 30;
input Show30DayAvg = yes;
input ShowTodayVolume =  yes;
input ShowPercentOf30DayAvg = yes;
input UnusualVolumePercent = 200;
input Show30BarAvg = yes;
input ShowCurrentBar = yes;
input ShowPercentOf30BarAvg = yes;
input ShowSellVolumePercent = yes;
input showbuyvolumepercent = yes;
def agperiod = getAggregationPeriod();
def O = open;
def H = high;
def C = close;
def L = low;
def V = volume;
def buying = V*(C-L)/(H-L);
def selling = V*(H-C)/(H-L);
# Selling Volume
Plot SellVol = selling;
SellVol.setPaintingStrategy(PaintingStrategy.Histogram);
SellVol.SetDefaultColor(Color.Red);
SellVol.HideTitle();
SellVol.HideBubble();
SellVol.SetLineWeight(1);
# Total Volume
# Note that Selling + Buying Volume = Volume.
plot TV =  volume;
TV.SetPaintingStrategy(PaintingStrategy.HISTOGRAM);
TV.SetDefaultColor(Color.GRAY);
#TV.HideTitle();
#TV.HideBubble();
TV.SetLineWeight(1);
Plot BuyVol = buying;
BuyVol.setPaintingStrategy(PaintingStrategy.Histogram);
BuyVol.SetDefaultColor(Color.Green);
BuyVol.HideTitle();
BuyVol.HideBubble();
BuyVol.SetLineWeight(5);
Script F {
Input Length = 30;
def data = volume(period = "DAY");
def data1 =
    fold a = 1
    to Length + 1
    with K = 0
    do K + data[a];
def Vol30day_Average = data1 / length;
plot Vol = Vol30day_Average;
}
def AvgVolume30_Day = F(Days_Vol_Avg);
Script G {
Input Length = 30;
def data = volume;
def data1 =
    fold a = 1
    to Length + 1
    with k = 0
    do k + data[a];
def Vol30Bars_Average = data1 / length;
plot Vol2 = Vol30Bars_Average;
}
def AvgVolume30_Bars = G(Bars_Vol_Avg);
# Selling Volume
def today = volume(period = "DAY");
def percentOf30Day = Round((today / AvgVolume30_Day) * 100, 0);
def diffFromAvg = today - AvgVolume30_Day;
def percentDiffdays = Round((diffFromAvg / AvgVolume30_Day) * 100, 0);
def curVolume = volume;
def percentOf30Bar = Round((curVolume / AvgVolume30_Bars) * 100, 0);
def SellVolPercent = Round((Selling / Volume) * 100, 0);
def buyVolPercent = Round((Buying / Volume) * 100, 0);
def diffFromAvgBars = curVolume - AvgVolume30_Bars;
def percentDiffBars = Round((diffFromAvgBars / AvgVolume30_Bars) * 100, 0);
input length = 21;
input length2 = 21;
def Sell_StepUP = selling[1] > selling;
def Buy_StepDOWN = buying[1] < buying;
def Bear_Divergence = if (Sell_StepUP and Buy_StepDOWN) and (Sell_StepUP[1] and Buy_StepDOWN[1]) then 1 else 0;
plot VolAvg = Average(volume, length);
VolAvg.Setdefaultcolor(Color.Gray);
input type = { default SMP, EXP } ;
input length_HV = 20 ;
input HotPct = 100.0 ;
input showmarket = yes;
def MA =
if type == type.SMP then
SimpleMovingAvg(volume, length_HV)
else
MovAvgExponential(volume, length_HV);
plot HV =
if (100 * ((volume / ma) - 1) >= hotPct) then
ma
else
Double.NaN;
hv.SetDefaultColor( Color.CYAN);
hv.SetLineWeight(2) ;
hv.SetPaintingStrategy( PaintingStrategy.TRIANGLES);
def HighV = if (100 * ((volume / ma) - 1) >= hotPct) then 1 else 0;
AddLabel(ShowTodayVolume,
if percentDiffdays > colorpercdiff then "Todays Volume: " + today + " | " + absvalue(percentDiffdays) + "% Above "+ Days_Vol_Avg + " Day Average (" + Round(AvgVolume30_Day, 0)+ ")" else if percentDiffdays < -(colorpercdiff) then "Todays Volume: " + today + " | " +  absvalue(percentDiffdays) + "% Below "+ Days_Vol_Avg + " Day Average (" + Round(AvgVolume30_Day, 0)+ ")" else "Todays Volume: " + today + "%", (if percentDiffdays > colorpercdiff then Color.GREEN else Color.light_Gray));

AddLabel(ShowPercentOf30BarAvg,
if percentDiffBars > colorpercdiff then "Current Bar: " + (curVolume) + " | " +  absvalue(percentDiffBars) + "% Above " + Bars_Vol_Avg + " Bar Average (" + Round(AvgVolume30_Bars, 0)+ ")" else if percentDiffBars < -(colorpercdiff) then Bars_Vol_Avg + " Bar Average: " + Round(AvgVolume30_Bars, 0) + " | " +  absvalue(percentDiffBars) + "% Below " + Bars_Vol_Avg + " Bar Average (" + Round(AvgVolume30_Bars, 0)+ ")" else Bars_Vol_Avg + " Bar Average: " + Round(AvgVolume30_Bars, 0), (if percentDiffBars > colorpercdiff then Color.GREEN else Color.light_gray));
AddLabel(ShowSellVolumePercent, "Current Bar Sell: " + SellVolPercent + "%",
(if (sellvolpercent > Buyvolpercent) and highV then Color.cyan
  else if SellVolPercent >= Colorsellpercent then Color.RED
        else if SellVolPercent < 49 then Color.gray
             else color.orange));
AddLabel(ShowBuyVolumePercent, "Current Bar Buy: " + BuyVolPercent + "%",
    (if (BuyVolPercent > Sellvolpercent) and highV then Color.cyan
         else if BuyVolPercent >= ColorBuypercent then Color.Green
              else if buyVolPercent < 35 then Color.Gray
                   else Color.ORANGE));


#
Last edited:
lolreconlol
Active member
Hey @HODL-Lay-HE-hoo! - what sort of success have you had trading your system? Are you keeping track of wins/losses/gains? Blown away by the amount of detail on that first page.Well to be clear...
Anyway that being said I agree with you. The orange and light green are much more helpful than the white colored candle... I made that screenshot explanation because I did not realize they were showing the same information.
- The white bar is included in the updated link for the Big7 indicator (turned off by default)
- I will not be using the white bar, I added it as a visual aid
- When @Christopher84 the great coded C3_Max_Spark he replaced the C3 MF Line or Candle color code with the "previously overbought (dashed light green line) / previously oversold (dashed orange line)" lines as they represent the same levels (this of course does not account for the green and red portions of the C3 MF Line
* Also to whom it may concern: you may have noticed I now refer to the "supply demand" zones as "overbought oversold" zones which is how @Christopher84 defines them. That being said to me supply demand still makes sense so call them whatever you like. The reason I stopped calling the "supply demand" zones and started calling them "overbought oversold" zones was to avoid confusion... though I may have just caused even more confusion, but you know what I mean haha....*
@rongshu - same issue here. The 1 minute chart barely updates when I have the full setup going.
Last edited:
Good people... I also give you... C3_Big_Spark_MAX! (plus TS_V9! - signals only)
I took C3_Max_TS from the keyboard cowboy himself... @Christopher84 ... and merged The Big7 removed redundant code or just unneeded (is that a word?) code (per my use) including the profit loss code from TS_V9 which meant I would have to sacrifice the Average lines... which I shed a few tears over but it had to be done... The arrows for TS V9 can be enabled in settings. Also you will notice the consensus label has made its return indicating OBOS conditions. Other than that I changed some inputs to def so they would not appear in settings as most do not adjust them anyway including myself and I attempted to put them in an order that makes sense.
http://tos.mx/7KO43DU

Code:
   ##########################################################################################
   ##########################################################################################
   ###                                                                                    ###
   ###       #############################           #########               #########    ###
   ###     #################################         #########               #########    ###
   ###    ####################################       #########               #########    ###
   ###   ########                     #########      #########               #########    ###
   ###   ########  C3_BIG_SPARK_MAX   #########      #########               #########    ###
   ###   ########       +TSV9         #########      #########               #########    ###
   ###   ########   @Christopher84    #########      #########               #########    ###
   ###   ########                     #########      #########               #########    ###
   ###   ######################################      ##################################   ###
   ###    ####################################       ##################################   ###
   ###     #################################         ##################################   ###
   ###    ####################################       ##################################   ###
   ###   ########                     #########                              #########    ###
   ###   ########     @Horserider     #########                              #########    ###
   ###   ########  HORSERIDER VOLUME  #########                              #########    ###
   ###   ########  TRIPLE EXHAUSTION  #########                              #########    ###
   ###   ########      @chence27      #########                              #########    ###
   ###   ########                     #########                              #########    ###
   ###    ####################################                               #########    ###
   ###     ##################################                                #########    ###
   ###      ###############################                                  #########    ###
   ###                                                                                    ###
   ##########################################################################################
   ##########################################################################################


input showverticallineday = yes;
input show_ts_signals = no;
input showLabels  = yes;
input showCloud = yes;
input trailType = {default modified, unmodified};
input averagetype = AverageType.SIMPLE;
input MACD_AverageType = {SMA, default EMA};
input DMI_averageType = AverageType.WILDERS;
input AvgType = AverageType.HULL;
input length9 = 35;
input length8 = 10;
input length10 = 20;
input length_3x = 1000;
input tradeDaytimeOnly = no; #hint tradeDaytimeOnly: (IntraDay Only) Only perform trades during hours stated
input OpenTime = 0930; #hint OpenTime: Opening time of market
input CloseTime = 1600; #hint CloseTime: Closing time of market
input firstTrade = {default long, short};
input LongTrades = yes; #hint LongTrades: perform long trades
input ShortTrades = yes; #hint ShortTrades: perform short trades
input useStops = no;     #hint useStops: use stop orders
input useAlerts = no;    #hint useAlerts: use alerts on signals
input ATRPeriod = 11;
input ATRFactor = 2.2;
input ATRPeriod2 = 5;
input ATRFactor2 = 1.5;
input AtrMult = 1.0;
input HideBoxLines = no;
input HideCloud = no;
input HideLabels = no;
input Strategy_Confirmation_Factor = 4;
input Strategy_FilterWithTMO = no;
input Strategy_FilterWithTMO_arrows = yes;
input Strategy_HoldTrend = no;
input Strategy_ColoredCandlesOn = yes;
input coloredCandlesOn = yes;
input ColorPrice = yes;
input color_blst = no;
input color_3x = yes;
input color_3xt = yes;
input color_OBOS = no;
input BarsUsedForRange = 2;
input BarsRequiredToRemainInRange = 2;
input TargetMultiple = 0.5;
input trig = 20;# for Blast-off candle color
def HideTargets = no;
def HideBalance = no;

#####################################################
#TS Strategy_V9 Created by Christopher84 08/10/2021
#####################################################
Assert(ATRFactor > 0, "'atr factor' must be positive: " + ATRFactor);
def HiLo = Min(high - low, 1.5 * Average(high - low, ATRPeriod));
def HRef = if low <= high[1]
    then high - close[1]
    else (high - close[1]) - 0.5 * (low - high[1]);
def LRef = if high >= low[1]
    then close[1] - low
    else (close[1] - low) - 0.5 * (low[1] - high);
def trueRange;
switch (trailType) {
case modified:
    trueRange = Max(HiLo, Max(HRef, LRef));
case unmodified:
    trueRange = TrueRange(high, close, low);
}
def loss = ATRFactor * MovingAverage(averageType, trueRange, ATRPeriod);
def state = {default init, long, short};
def trail;
switch (state[1]) {
case init:
    if (!IsNaN(loss)) {
        switch (firstTrade) {
        case long:
            state = state.long;
            trail =  close - loss;
        case short:
            state = state.short;
            trail = close + loss;
    }
    } else {
        state = state.init;
        trail = Double.NaN;
    }
case long:
    if (close > trail[1]) {
        state = state.long;
        trail = Max(trail[1], close - loss);
    } else {
        state = state.short;
        trail = close + loss;
    }
case short:
    if (close < trail[1]) {
        state = state.short;
        trail = Min(trail[1], close + loss);
    } else {
        state = state.long;
        trail =  close - loss;
    }
}
def price = close;
def TrailingStop = trail;
def LongEnter = (price crosses above TrailingStop);
def LongExit = (price crosses below TrailingStop);
#Addorder(OrderType.BUY_AUTO, condition = LongEnter, price = open[-1], 1, tickcolor = GetColor(1), arrowcolor = Color.LIME);
#AddOrder(OrderType.SELL_AUTO, condition = LongExit, price = open[-1], 1, tickcolor = GetColor(2), arrowcolor = Color.LIME);
def upsignal = (price crosses above TrailingStop);
def downsignal = (price crosses below TrailingStop);
###############################################
##OB_OS_Levels_v5 by Christopher84 12/10/2021
###############################################
#def TrailingStop = trail;
def H = Highest(TrailingStop, 12);
def L = Lowest(TrailingStop, 12);
def BulgeLengthPrice = 100;
def SqueezeLengthPrice = 100;
def BandwidthC3 = (H - L);
#def IntermResistance2 = Highest(BandwidthC3, BulgeLengthPrice);
def IntermSupport2 = Lowest(BandwidthC3, SqueezeLengthPrice);
def sqzTrigger = BandwidthC3 <= IntermSupport2;
def sqzLevel = if !sqzTrigger[1] and sqzTrigger then hl2
               else if !sqzTrigger then Double.NaN
               else sqzLevel[1];
plot Squeeze_Alert = sqzLevel;
Squeeze_Alert.SetPaintingStrategy(PaintingStrategy.POINTS);
Squeeze_Alert.SetLineWeight(3);
Squeeze_Alert.SetDefaultColor(Color.YELLOW);
###############################################
##Yellow Candle_height (OB_OS)
###############################################
def displace = 0;
def factorK2 = 3.25;
def lengthK2 = 20;
def price1 = open;
def trueRangeAverageType = AverageType.SIMPLE;
def ATR_length = 15;
def SMA_lengthS = 6;
def HiLo2 = Min(high - low, 1.5 * Average(high - low, ATRPeriod));
def HRef2 = if low <= high[1]
    then high - close[1]
    else (high - close[1]) - 0.5 * (low - high[1]);
def LRef2 = if high >= low[1]
    then close[1] - low
    else (close[1] - low) - 0.5 * (low[1] - high);
def loss2 = ATRFactor2 * MovingAverage(averageType, trueRange, ATRPeriod2);
def multiplier_factor = 1.25;
def valS = Average(price, SMA_lengthS);
def average_true_range = Average(TrueRange(high, close, low), length = ATR_length);
def Upper_BandS = valS[-displace] + multiplier_factor * average_true_range[-displace];
def Middle_BandS = valS[-displace];
def Lower_BandS = valS[-displace] - multiplier_factor * average_true_range[-displace];
def shiftK2 = factorK2 * MovingAverage(trueRangeAverageType, TrueRange(high, close, low), lengthK2);
def averageK2 = MovingAverage(averageType, price, lengthK2);
def AvgK2 = averageK2[-displace];
def Upper_BandK2 = averageK2[-displace] + shiftK2[-displace];
def Lower_BandK2 = averageK2[-displace] - shiftK2[-displace];
def condition_BandRevDn = (Upper_BandS > Upper_BandK2);
def condition_BandRevUp = (Lower_BandS < Lower_BandK2);
def fastLength = 12;
def slowLength = 26;
def MACDLength = 9;
def fastEMA = ExpAverage(price, fastLength);
def slowEMA = ExpAverage(price, slowLength);
def Value;
def Avg;
switch (MACD_AverageType) {
case SMA:
    Value = Average(price, fastLength) - Average(price, slowLength);
    Avg = Average(Value, MACDLength);
case EMA:
    Value = fastEMA - slowEMA;
    Avg = ExpAverage(Value, MACDLength);
}
def Diff = Value - Avg;
def MACDLevel = 0.0;
def Level = MACDLevel;
def condition1 = Value[1] <= Value;
def condition1D = Value[1] > Value;
#RSI
def RSI_length = 14;
def RSI_AverageType = AverageType.WILDERS;
def RSI_OB = 70;
def RSI_OS = 30;
def NetChgAvg = MovingAverage(RSI_AverageType, price - price[1], RSI_length);
def TotChgAvg = MovingAverage(RSI_AverageType, AbsValue(price - price[1]), RSI_length);
def ChgRatio = if TotChgAvg != 0 then NetChgAvg / TotChgAvg else 0;
def RSI = 50 * (ChgRatio + 1);
def condition2 = (RSI[3] < RSI) is true or (RSI >= 80) is true;
def condition2D = (RSI[3] > RSI) is true or (RSI < 20) is true;
def conditionOB1 = RSI > RSI_OB;
def conditionOS1 = RSI < RSI_OS;
#MFI
def MFI_Length = 14;
def MFIover_Sold = 20;
def MFIover_Bought = 80;
def movingAvgLength = 1;
def MoneyFlowIndex = Average(MoneyFlow(high, close, low, volume, MFI_Length), movingAvgLength);
def MFIOverBought = MFIover_Bought;
def MFIOverSold = MFIover_Sold;

def condition3 = (MoneyFlowIndex[2] < MoneyFlowIndex) is true or (MoneyFlowIndex > 85) is true;
def condition3D = (MoneyFlowIndex[2] > MoneyFlowIndex) is true or (MoneyFlowIndex < 20) is true;
def conditionOB2 = MoneyFlowIndex > MFIover_Bought;
def conditionOS2 = MoneyFlowIndex < MFIover_Sold;
#Forecast
def na = Double.NaN;
def MidLine = 50;
def Momentum = MarketForecast().Momentum;
def NearT =  MarketForecast().NearTerm;
def Intermed = MarketForecast().Intermediate;
def FOB = 80;
def FOS = 20;
def upperLine = 110;
def condition4 = (Intermed[1] <= Intermed) or (NearT >= MidLine);
def condition4D = (Intermed[1] > Intermed) or (NearT < MidLine);
def conditionOB3 = Intermed > FOB;
def conditionOS3 = Intermed < FOS;
def conditionOB4 = NearT > FOB;
def conditionOS4 = NearT < FOS;
#Change in Price
def lengthCIP = 5;
def CIP = (price - price[1]);
def AvgCIP = ExpAverage(CIP[-displace], lengthCIP);
def CIP_UP = AvgCIP > AvgCIP[1];
def CIP_DOWN = AvgCIP < AvgCIP[1];
def condition5 = CIP_UP;
def condition5D = CIP_DOWN;
#EMA_1
def EMA_length = 8;
def AvgExp = ExpAverage(price[-displace], EMA_length);
def condition6 = (price >= AvgExp) and (AvgExp[2] <= AvgExp);
def condition6D = (price < AvgExp) and (AvgExp[2] > AvgExp);
#EMA_2
def EMA_2length = 20;
def displace2 = 0;
def AvgExp2 = ExpAverage(price[-displace2], EMA_2length);
def condition7 = (price >= AvgExp2) and (AvgExp2[2] <= AvgExp);
def condition7D = (price < AvgExp2) and (AvgExp2[2] > AvgExp);
#DMI Oscillator
def DMI_length = 5;#Typically set to 10
def diPlus = DMI(DMI_length, DMI_averageType)."DI+";
def diMinus = DMI(DMI_length, DMI_averageType)."DI-";
def Osc = diPlus - diMinus;
def Hist = Osc;
def ZeroLine = 0;
def condition8 = Osc >= ZeroLine;
def condition8D = Osc < ZeroLine;
#Trend_Periods
def TP_fastLength = 3;#Typically 7
def TP_slowLength = 4;#Typically 15
def Periods = Sign(ExpAverage(close, TP_fastLength) - ExpAverage(close, TP_slowLength));
def condition9 = Periods > 0;
def condition9D = Periods < 0;
#Polarized Fractal Efficiency
def PFE_length = 5;#Typically 10
def smoothingLength = 2.5;#Typically 5
def PFE_diff = close - close[PFE_length - 1];
def val = 100 * Sqrt(Sqr(PFE_diff) + Sqr(PFE_length)) / Sum(Sqrt(1 + Sqr(close - close[1])), PFE_length - 1);
def PFE = ExpAverage(if PFE_diff > 0 then val else -val, smoothingLength);
def UpperLevel = 50;
def LowerLevel = -50;
def condition10 = PFE > 0;
def condition10D = PFE < 0;
def conditionOB5 = PFE > UpperLevel;
def conditionOS5 = PFE < LowerLevel;
#Bollinger Bands PercentB
def BBPB_length = 20;#Typically 20
def Num_Dev_Dn = -2.0;
def Num_Dev_up = 2.0;
def BBPB_OB = 100;
def BBPB_OS = 0;
def upperBand = BollingerBands(price, displace, BBPB_length, Num_Dev_Dn, Num_Dev_up, averagetype).UpperBand;
def lowerBand = BollingerBands(price, displace, BBPB_length, Num_Dev_Dn, Num_Dev_up, averagetype).LowerBand;
def PercentB = (price - lowerBand) / (upperBand - lowerBand) * 100;
def HalfLine = 50;
def UnitLine = 100;
def condition11 = PercentB > HalfLine;
def condition11D = PercentB < HalfLine;
def conditionOB6 = PercentB > BBPB_OB;
def conditionOS6 = PercentB < BBPB_OS;
def condition12 = (Upper_BandS[1] <= Upper_BandS) and (Lower_BandS[1] <= Lower_BandS);
def condition12D = (Upper_BandS[1] > Upper_BandS) and (Lower_BandS[1] > Lower_BandS);
#Klinger Histogram
def Klinger_Length = 13;
def KVOsc = KlingerOscillator(Klinger_Length).KVOsc;
def KVOH = KVOsc - Average(KVOsc, Klinger_Length);
def condition13 = (KVOH > 0);
def condition13D = (KVOH < 0);
#Projection Oscillator
def ProjectionOsc_length = 30;#Typically 10
def MaxBound = HighestWeighted(high, ProjectionOsc_length, LinearRegressionSlope(price = high, length = ProjectionOsc_length));
def MinBound = LowestWeighted(low, ProjectionOsc_length, LinearRegressionSlope(price = low, length = ProjectionOsc_length));
def ProjectionOsc_diff = MaxBound - MinBound;
def PROSC = if ProjectionOsc_diff != 0 then 100 * (close - MinBound) / ProjectionOsc_diff else 0;
def PROSC_OB = 80;
def PROSC_OS = 20;
def condition14 = PROSC > 50;
def condition14D = PROSC < 50;
def conditionOB7 = PROSC > PROSC_OB;
def conditionOS7 = PROSC < PROSC_OS;
# AK Trend
def aktrend_input1 = 3;
def aktrend_input2 = 8;
def aktrend_price = close;
def aktrend_fastmaa = MovAvgExponential(aktrend_price, aktrend_input1);
def aktrend_fastmab = MovAvgExponential(aktrend_price, aktrend_input2);
def aktrend_bspread = (aktrend_fastmaa - aktrend_fastmab) * 1.001;
def cond1_UP = if aktrend_bspread > 0 then 1 else 0;
def cond1_DN = if aktrend_bspread <= 0 then -1 else 0;
# ZSCORE
def zscore_price = close;
def zscore_length = 20;
def zscore_ZavgLength = 20;
def zscore_oneSD = StDev(zscore_price, zscore_length);
def zscore_avgClose = SimpleMovingAvg(zscore_price, zscore_length);
def zscore_ofoneSD = zscore_oneSD * zscore_price[1];
def zscore_Zscorevalue = ((zscore_price - zscore_avgClose) / zscore_oneSD);
def zscore_avgZv = Average(zscore_Zscorevalue, 20);
def zscore_Zscore = ((zscore_price - zscore_avgClose) / zscore_oneSD);
def zscore_avgZscore = Average(zscore_Zscorevalue, zscore_ZavgLength);
def cond2_UP = if zscore_Zscore > 0 then 1 else 0;
def cond2_DN = if zscore_Zscore <= 0 then -1 else 0;
# Ehlers
def ehlers_length = 34;
def ehlers_price = (high + low) / 2;
def ehlers_coeff = ehlers_length * ehlers_price * ehlers_price - 2 * ehlers_price * Sum(ehlers_price, ehlers_length)[1] + Sum(ehlers_price * ehlers_price, ehlers_length)[1];
def ehlers_Ehlers = Sum(ehlers_coeff * ehlers_price, ehlers_length) / Sum(ehlers_coeff, ehlers_length);
def cond3_UP = if close > ehlers_Ehlers then 1 else 0;
def cond3_DN = if close <= ehlers_Ehlers then -1 else 0;
# Anchored Momentum
def amom_src = close;
def amom_MomentumPeriod = 10;
def amom_SignalPeriod = 8;
def amom_SmoothMomentum = no;
def amom_SmoothingPeriod = 7;
def amom_p = 2 * amom_MomentumPeriod + 1;
def amom_t_amom = if amom_SmoothMomentum == yes then ExpAverage(amom_src, amom_SmoothingPeriod) else amom_src;
def amom_amom = 100 * ( (amom_t_amom / ( Average(amom_src, amom_p)) - 1));
def amom_amoms = Average(amom_amom, amom_SignalPeriod);
def cond4_UP = if amom_amom > 0 then 1 else 0;
def cond4_DN = if amom_amom <= 0 then -1 else 0;
# TMO
def tmo_length = 30; #def 14
def tmo_calcLength = 6; #def 5
def tmo_smoothLength = 6; #def 3
def tmo_data = fold i = 0 to tmo_length with s do s + (if close > GetValue(open, i) then 1 else if close < GetValue(open, i) then - 1 else 0);
def tmo_EMA5 = ExpAverage(tmo_data, tmo_calcLength);
def tmo_Main = ExpAverage(tmo_EMA5, tmo_smoothLength);
def tmo_Signal = ExpAverage(tmo_Main, tmo_smoothLength);
def tmo_color = if tmo_Main > tmo_Signal then 1 else -1;
def cond5_UP = if tmo_Main <= 0 then 1 else 0;
def cond5_DN = if tmo_Main >= 0 then -1 else 0;
#Trend Confirmation Calculator
def Confirmation_Factor = 7;
#def Agreement_Level = condition1;
def Agreement_LevelOB = 12;
def Agreement_LevelOS = 2;
def factorK = 2.0;
def lengthK = 20;
def shift = factorK * MovingAverage(trueRangeAverageType, TrueRange(high, close, low), lengthK);
def averageK = MovingAverage(averageType, price, lengthK);
def AvgK = averageK[-displace];
def Upper_BandK = averageK[-displace] + shift[-displace];
def Lower_BandK = averageK[-displace] - shift[-displace];
def conditionK1UP = price >= Upper_BandK;
def conditionK2UP = (Upper_BandK[1] < Upper_BandK) and (Lower_BandK[1] < Lower_BandK);
def conditionK3DN = (Upper_BandK[1] > Upper_BandK) and (Lower_BandK[1] > Lower_BandK);
def conditionK4DN = price < Lower_BandK;
def Agreement_Level = condition1 + condition2 + condition3 + condition4
                    + condition5 + condition6 + condition7 + condition8 + condition9
                    + condition10 + condition11 + condition12 + condition13 + condition14
                    + conditionK1UP + conditionK2UP;
def Agreement_LevelD = (condition1D + condition2D + condition3D + condition4D + condition5D
                    + condition6D + condition7D + condition8D + condition9D + condition10D
                    + condition11D + condition12D + condition13D + condition14D + conditionK3DN
                    + conditionK4DN);
def Consensus_Level = Agreement_Level - Agreement_LevelD;
def UP = Consensus_Level >= 6;
def DOWN = Consensus_Level < -6;
def priceColor = if UP then 1
                 else if DOWN then -1
                 else priceColor[1];
def Consensus_Level_OB = 14;
def Consensus_Level_OS = -12;
#Super_OB/OS Signal
def OB_Level = conditionOB1 + conditionOB2 + conditionOB3 + conditionOB4 + conditionOB5 + conditionOB6 + conditionOB7;
def OS_Level = conditionOS1 + conditionOS2 + conditionOS3 + conditionOS4 + conditionOS5 + conditionOS6 + conditionOS7;
def Consensus_Line = OB_Level - OS_Level;
def Zero_Line = 0;
def Super_OB = 4;
def Super_OS = -4;
def DOWN_OB = (Agreement_Level > Agreement_LevelOB) and (Consensus_Line > Super_OB) and (Consensus_Level > Consensus_Level_OB);
def UP_OS = (Agreement_Level < Agreement_LevelOS) and (Consensus_Line < Super_OS) and (Consensus_Level < Consensus_Level_OS);
def OS_Buy = UP_OS;
def OB_Sell = DOWN_OB;
def neutral = Consensus_Line < Super_OB and Consensus_Line > Super_OS;
def use_line_limits = yes;#Yes, plots line from/to; No, plot line across entire chart
def linefrom = 100;#Hint linefrom: limits how far line plots in candle area
def lineto   = 12;#Hint lineto: limits how far into expansion the line will plot
def YHOB = if coloredCandlesOn and ((price1 > Upper_BandS) and (condition_BandRevDn)) then high else Double.NaN;
def YHOS = if coloredCandlesOn and ((price1 < Lower_BandS) and (condition_BandRevUp)) then high else Double.NaN;
def YLOB = if coloredCandlesOn and ((price1 > Upper_BandS) and (condition_BandRevDn)) then low else Double.NaN;
def YLOS = if coloredCandlesOn and ((price1 < Lower_BandS) and (condition_BandRevUp)) then low else Double.NaN;
#extend midline of yellow candle
plot YCOB = if !IsNaN(YHOB) then hl2 else Double.NaN;
YCOB.SetPaintingStrategy(PaintingStrategy.HORIZONTAL);
YCOB.SetDefaultColor(Color.GREEN);
def YHextOB = if IsNaN(YCOB) then YHextOB[1] else YCOB;
plot YHextlineOB = YHextOB;
YHextlineOB.SetPaintingStrategy(PaintingStrategy.HORIZONTAL);
YHextlineOB.SetDefaultColor(Color.ORANGE);
YHextlineOB.SetLineWeight(2);
plot YCOS = if !IsNaN(YHOS) then hl2 else Double.NaN;
YCOS.SetPaintingStrategy(PaintingStrategy.HORIZONTAL);
YCOS.SetDefaultColor(Color.GREEN);
def YHextOS = if IsNaN(YCOS) then YHextOS[1] else YCOS;
plot YHextlineOS = YHextOS;
YHextlineOS.SetPaintingStrategy(PaintingStrategy.HORIZONTAL);
YHextlineOS.SetDefaultColor(Color.LIGHT_GREEN);
YHextlineOS.SetLineWeight(2);
def YC = coloredCandlesOn and priceColor == 1 and price1 > Upper_BandS and condition_BandRevDn;
def HH = Highest(high[1], BarsUsedForRange);
def LL = Lowest(low[1], BarsUsedForRange);
def maxH = Highest(HH, BarsRequiredToRemainInRange);
def maxL = Lowest(LL, BarsRequiredToRemainInRange);
def HHn = if maxH == maxH[1] or maxL == maxL then maxH else HHn[1];
def LLn = if maxH == maxH[1] or maxL == maxL then maxL else LLn[1];
def Bh = if high <= HHn and HHn == HHn[1] then HHn else Double.NaN;
def Bl = if low >= LLn and LLn == LLn[1] then LLn else Double.NaN;
def CountH = if IsNaN(Bh) or IsNaN(Bl) then 2 else CountH[1] + 1;
def CountL = if IsNaN(Bh) or IsNaN(Bl) then 2 else CountL[1] + 1;
def ExpH = if BarNumber() == 1 then Double.NaN else
            if CountH[-BarsRequiredToRemainInRange] >= BarsRequiredToRemainInRange then HHn[-BarsRequiredToRemainInRange] else
            if high <= ExpH[1] then ExpH[1] else Double.NaN;
def ExpL = if BarNumber() == 1 then Double.NaN else
            if CountL[-BarsRequiredToRemainInRange] >= BarsRequiredToRemainInRange then LLn[-BarsRequiredToRemainInRange] else
            if low >= ExpL[1] then ExpL[1] else Double.NaN;
def BoxHigh = if ((DOWN_OB) or (Upper_BandS crosses above Upper_BandK2) or (condition_BandRevDn) and (high > high[1]) and ((price > Upper_BandK2) or (price > Upper_BandS))) then Highest(ExpH) else Double.NaN;
def BoxLow = if (DOWN_OB) or ((Upper_BandS crosses above Upper_BandK2)) then Lowest(low) else Double.NaN;
def BoxHigh2 = if ((UP_OS) or ((Lower_BandS crosses below Lower_BandK2))) then Highest(ExpH) else Double.NaN;
def BH2 = if !IsNaN(BoxHigh2) then high else Double.NaN;
def BH2ext = if IsNaN(BH2) then BH2ext[1] else BH2;
def BH2extline = BH2ext;
plot H_BH2extline = Lowest(BH2extline, 1);
H_BH2extline.SetDefaultColor(Color.GREEN);
def BoxLow2 = if ((UP_OS) or (Lower_BandS crosses below Lower_BandK2) or (condition_BandRevUp) and (low < low[1]) and ((price < Lower_BandK2) or (price < Lower_BandS))) or ((UP_OS[1]) and (low < low[1])) then Lowest(low) else Double.NaN;
def BH1 = if !IsNaN(BoxHigh) then high else Double.NaN;
def BH1ext = if IsNaN(BH1) then BH1ext[1] else BH1;
def BH1extline = BH1ext;
def BL1 = if !IsNaN(BoxLow) then low else Double.NaN;
def BL1ext = if IsNaN(BL1) then BL1ext[1] else BL1;
plot BL1extline = BL1ext;
BL1extline.SetPaintingStrategy(PaintingStrategy.HORIZONTAL);
BL1extline.SetDefaultColor(Color.RED);
BL1extline.SetLineWeight(1);
def BL2 = if !IsNaN(BoxLow2) then low else Double.NaN;
def BL2ext = if IsNaN(BL2) then BL2ext[1] else BL2;
plot BL2extline = BL2ext;
BL2extline.SetPaintingStrategy(PaintingStrategy.HORIZONTAL);
BL2extline.SetDefaultColor(Color.GREEN);
BL2extline.SetLineWeight(1);
plot H_BH1extline = Highest(BH1extline, 1);
H_BH1extline.SetDefaultColor(Color.RED);
plot L_BL1extline = Highest(BL1extline, 1);
L_BL1extline.SetDefaultColor(Color.RED);
plot L_BL2extline = Lowest(BL2extline, 1);
L_BL2extline.SetDefaultColor(Color.GREEN);
AddCloud(if !HideCloud then BH1extline else Double.NaN, BL1extline, Color.RED, Color.GRAY);
AddCloud(if !HideCloud then BH2extline else Double.NaN, BL2extline, Color.GREEN, Color.GRAY);
############################################################
##C3_MF_Line_v2 Created by Christopher84 03/06/2022
############################################################
#Keltner Channel
def BulgeLengthPrice2 = 20;
def SqueezeLengthPrice2 = 20;
def BulgeLengthPrice3 = 12;
def SqueezeLengthPrice3 = 12;
def IntermResistance = Highest(price, BulgeLengthPrice);
def IntermSupport = Lowest(price, SqueezeLengthPrice);
def NearTResistance = Highest(price, BulgeLengthPrice2);
def NearTSupport = Lowest(price, SqueezeLengthPrice2);
def NearTResistance1 = Highest(price, BulgeLengthPrice3);
def NearTSupport1 = Lowest(price, SqueezeLengthPrice3);
script WMA_Smooth {
    input price_WMA = hl2;
    plot smooth = (4 * price_WMA
+ 3 * price_WMA[1]
+ 2 * price_WMA[2]
+ price_WMA[3]) / 10;
}
script Phase_Accumulation {
# This is Ehler's Phase Accumulation code. It has a full cycle delay.
# However, it computes the correction factor to a very high degree.
    input price_WMA = hl2;
    rec Smooth;
    rec Detrender;
    rec Period;
    rec Q1;
    rec I1;
    rec I1p;
    rec Q1p;
    rec Phase1;
    rec Phase;
    rec DeltaPhase;
    rec DeltaPhase1;
    rec InstPeriod1;
    rec InstPeriod;
    def CorrectionFactor;

    if BarNumber() <= 5
    then {
        Period = 0;
        Smooth = 0;
        Detrender = 0;
        CorrectionFactor = 0;
        Q1 = 0;
        I1 = 0;
        Q1p = 0;
        I1p = 0;
        Phase = 0;
        Phase1 = 0;
        DeltaPhase1 = 0;
        DeltaPhase = 0;
        InstPeriod = 0;
        InstPeriod1 = 0;
    } else {
        CorrectionFactor = 0.075 * Period[1] + 0.54;

# Smooth and detrend my smoothed signal:

        Smooth = WMA_Smooth(price_WMA);
        Detrender = ( 0.0962 * Smooth
+ 0.5769 * Smooth[2]
- 0.5769 * Smooth[4]
- 0.0962 * Smooth[6] ) * CorrectionFactor;

# Compute Quadrature and Phase of Detrended signal:

        Q1p = ( 0.0962 * Detrender
+ 0.5769 * Detrender[2]
- 0.5769 * Detrender[4]
- 0.0962 * Detrender[6] ) * CorrectionFactor;
        I1p = Detrender[3];

# Smooth out Quadrature and Phase:

        I1 = 0.15 * I1p + 0.85 * I1p[1];
        Q1 = 0.15 * Q1p + 0.85 * Q1p[1];

# Determine Phase

        if I1 != 0
        then {

# Normally, ATAN gives results from -pi/2 to pi/2.
# We need to map this to circular coordinates 0 to 2pi

            if Q1 >= 0 and I1 > 0
            then { # Quarant 1
                Phase1 = ATan(AbsValue(Q1 / I1));
            } else if Q1 >= 0 and I1 < 0
            then { # Quadrant 2
                Phase1 = Double.Pi - ATan(AbsValue(Q1 / I1));
            } else if Q1 < 0 and I1 < 0
            then { # Quadrant 3
                Phase1 = Double.Pi + ATan(AbsValue(Q1 / I1));
            } else { # Quadrant 4
                Phase1 = 2 * Double.Pi - ATan(AbsValue(Q1 / I1));
            }
        } else if Q1 > 0
        then { # I1 == 0, Q1 is positive
            Phase1 = Double.Pi / 2;
        } else if Q1 < 0
        then { # I1 == 0, Q1 is negative
            Phase1 = 3 * Double.Pi / 2;
        } else { # I1 and Q1 == 0
            Phase1 = 0;
        }

# Convert phase to degrees

        Phase = Phase1 * 180 / Double.Pi;

        if Phase[1] < 90 and Phase > 270
        then {
# This occurs when there is a big jump from 360-0

            DeltaPhase1 = 360 + Phase[1] - Phase;
        } else {
            DeltaPhase1 = Phase[1] - Phase;
        }

# Limit our delta phases between 7 and 60

        if DeltaPhase1 < 7
        then {
            DeltaPhase = 7;
        } else if DeltaPhase1 > 60
        then {
            DeltaPhase = 60;
        } else {
            DeltaPhase = DeltaPhase1;
        }

# Determine Instantaneous period:

        InstPeriod1 =
-1 * (fold i = 0 to 40 with v=0 do
if v < 0 then
v
else if v > 360 then
-i
else
v + GetValue(DeltaPhase, i, 41));

        if InstPeriod1 <= 0
        then {
            InstPeriod = InstPeriod[1];
        } else {
            InstPeriod = InstPeriod1;
        }

        Period = 0.25 * InstPeriod + 0.75 * Period[1];
    }
    plot DC = Period;
}

script Ehler_MAMA {
    input price_WMA = hl2;
    input FastLimit = 0.5;
    input SlowLimit = 0.05;


    rec Period;
    rec Period_raw;
    rec Period_cap;
    rec Period_lim;

    rec Smooth;
    rec Detrender;
    rec I1;
    rec Q1;
    rec jI;
    rec jQ;
    rec I2;
    rec Q2;
    rec I2_raw;
    rec Q2_raw;

    rec Phase;
    rec DeltaPhase;
    rec DeltaPhase_raw;
    rec alpha;
    rec alpha_raw;

    rec Re;
    rec Im;
    rec Re_raw;
    rec Im_raw;

    rec SmoothPeriod;
    rec vmama;
    rec vfama;

    def CorrectionFactor = Phase_Accumulation(price_WMA).CorrectionFactor;

    if BarNumber() <= 5
    then {
        Smooth = 0;
        Detrender = 0;

        Period = 0;
        Period_raw = 0;
        Period_cap = 0;
        Period_lim = 0;
        I1 = 0;
        Q1 = 0;
        I2 = 0;
        Q2 = 0;
        jI = 0;
        jQ = 0;
        I2_raw = 0;
        Q2_raw = 0;
        Re = 0;
        Im = 0;
        Re_raw = 0;
        Im_raw = 0;
        SmoothPeriod = 0;
        Phase = 0;
        DeltaPhase = 0;
        DeltaPhase_raw = 0;
        alpha = 0;
        alpha_raw = 0;
        vmama = 0;
        vfama = 0;
    } else {

# Smooth and detrend my smoothed signal:

        Smooth = WMA_Smooth(price_WMA);
        Detrender = ( 0.0962 * Smooth
+ 0.5769 * Smooth[2]
- 0.5769 * Smooth[4]
- 0.0962 * Smooth[6] ) * CorrectionFactor;

        Q1 = ( 0.0962 * Detrender
+ 0.5769 * Detrender[2]
- 0.5769 * Detrender[4]
- 0.0962 * Detrender[6] ) * CorrectionFactor;
        I1 = Detrender[3];

        jI = ( 0.0962 * I1
+ 0.5769 * I1[2]
- 0.5769 * I1[4]
- 0.0962 * I1[6] ) * CorrectionFactor;

        jQ = ( 0.0962 * Q1
+ 0.5769 * Q1[2]
- 0.5769 * Q1[4]
- 0.0962 * Q1[6] ) * CorrectionFactor;

# This is the complex conjugate

        I2_raw = I1 - jQ;
        Q2_raw = Q1 + jI;

        I2 = 0.2 * I2_raw + 0.8 * I2_raw[1];
        Q2 = 0.2 * Q2_raw + 0.8 * Q2_raw[1];

        Re_raw = I2 * I2[1] + Q2 * Q2[1];
        Im_raw = I2 * Q2[1] - Q2 * I2[1];

        Re = 0.2 * Re_raw + 0.8 * Re_raw[1];
        Im = 0.2 * Im_raw + 0.8 * Im_raw[1];

# Compute the phase

        if Re != 0 and Im != 0
        then {
            Period_raw = 2 * Double.Pi / ATan(Im / Re);
        } else {
            Period_raw = 0;
        }

        if Period_raw > 1.5 * Period_raw[1]
        then {
            Period_cap = 1.5 * Period_raw[1];
        } else if Period_raw < 0.67 * Period_raw[1] {
            Period_cap = 0.67 * Period_raw[1];
        } else {
            Period_cap = Period_raw;
        }

        if Period_cap < 6
        then {
            Period_lim = 6;
        } else if Period_cap > 50
        then {
            Period_lim = 50;
        } else {
            Period_lim = Period_cap;
        }

        Period = 0.2 * Period_lim + 0.8 * Period_lim[1];
        SmoothPeriod = 0.33 * Period + 0.67 * SmoothPeriod[1];

        if I1 != 0
        then {
            Phase = ATan(Q1 / I1);
        } else if Q1 > 0
        then { # Quadrant 1:
            Phase = Double.Pi / 2;
        } else if Q1 < 0
        then { # Quadrant 4:
            Phase = -Double.Pi / 2;
        } else { # Both numerator and denominator are 0.
            Phase = 0;
        }

        DeltaPhase_raw = Phase[1] - Phase;
        if DeltaPhase_raw < 1
        then {
            DeltaPhase = 1;
        } else {
            DeltaPhase = DeltaPhase_raw;
        }

        alpha_raw = FastLimit / DeltaPhase;
        if alpha_raw < SlowLimit
        then {
            alpha = SlowLimit;
        } else {
            alpha = alpha_raw;
        }
        vmama = alpha * price_WMA + (1 - alpha) * vmama[1];
        vfama = 0.5 * alpha * vmama + (1 - 0.5 * alpha) * vfama[1];
    }

    plot MAMA = vmama;
    plot FAMA = vfama;
}
def price2 = hl2;
def FastLimit = 0.5;
def SlowLimit = 0.05;
def MAMA = Ehler_MAMA(price2, FastLimit, SlowLimit).MAMA;
def FAMA = Ehler_MAMA(price2, FastLimit, SlowLimit).FAMA;
def Crossing = Crosses((MAMA < FAMA), yes);
def Crossing1 = Crosses((MAMA > FAMA), yes);
def C3_Line_1 = if ((priceColor == 1) and (price1 > Upper_BandS) and (condition_BandRevDn)) then 1 else 0;
def C3_Line_2 = if ((priceColor == -1) and (price1 < Lower_BandS) and (condition_BandRevUp)) then 1 else 0;
def C3_Green =  ((priceColor == 1));
def C3_red =  ((priceColor == 1));
AddLabel(yes, Concat("MAMA", Concat("",
if MAMA > FAMA then "" else "")),
if MAMA > FAMA then Color.LIGHT_GREEN else Color.LIGHT_RED);
def MF_UP = FAMA < MAMA;
def MF_DN = FAMA > MAMA;
def priceColor10 = if MF_UP then 1
                 else if MF_DN then -1
                 else priceColor10[1];
###################################
##Consensus Level & Squeeze Label
###################################
def MomentumUP = Consensus_Level[1] < Consensus_Level;
def MomentumDOWN = Consensus_Level[1] > Consensus_Level;
def conditionOB = (Consensus_Level >= 12) and (Consensus_Line >= 4);
def conditionOS = (Consensus_Level <= -12) and (Consensus_Line <= -3);
###################################
##Big4 Strategy
###################################
def cond_UP = cond1_UP + cond2_UP + cond3_UP + cond4_UP;
def cond_DN = cond1_DN + cond2_DN + cond3_DN + cond4_DN;
def direction = if cond_UP >= Strategy_Confirmation_Factor and (!Strategy_FilterWithTMO or cond5_UP) then 1
else if cond_DN <= -Strategy_Confirmation_Factor and (!Strategy_FilterWithTMO or cond5_DN) then -1
    else if !Strategy_HoldTrend and direction[1] == 1 and cond_UP < Strategy_Confirmation_Factor and cond_DN > -Strategy_Confirmation_Factor then 0
        else if !Strategy_HoldTrend and direction[1] == -1 and cond_DN > -Strategy_Confirmation_Factor and cond_UP < Strategy_Confirmation_Factor then 0
            else direction[1];
def direction2 = if cond_UP >= Strategy_Confirmation_Factor and (!Strategy_FilterWithTMO_arrows or cond5_UP) then 1
    else if cond_DN <= -Strategy_Confirmation_Factor and (!Strategy_FilterWithTMO_arrows or cond5_DN) then -1
        else if !Strategy_HoldTrend and direction2[1] == 1 and cond_UP < Strategy_Confirmation_Factor and cond_DN > -Strategy_Confirmation_Factor then 0
            else if !Strategy_HoldTrend and direction2[1] == -1 and cond_DN > -Strategy_Confirmation_Factor and cond_UP < Strategy_Confirmation_Factor then 0 else direction2[1];
#Spark1
plot AvgExp8 = ExpAverage(price[-displace], length8);
def UPD = AvgExp8[1] < AvgExp8;
AvgExp8.SetStyle(Curve.SHORT_DASH);
AvgExp8.SetDefaultColor(CreateColor(255, 128, 0));  #Orange
plot AvgExp9 = ExpAverage(price[-displace], length9);
def UPW = AvgExp9[1] < AvgExp9;
AvgExp9.SetStyle(Curve.SHORT_DASH);
AvgExp9.SetDefaultColor(CreateColor(237, 106, 0));  #Orange
###################################
#SPARK#
###################################
def Below = AvgExp8 < AvgExp9;
def Spark = UPD + UPW + Below;
def UPEMA = AvgExp8[1] < AvgExp8;
def DOWNEMA = AvgExp8[1] > AvgExp8;

def BigUP = direction == 1;
def BigDN = direction == -1;
def BigNa = direction == 0;

AvgExp8.AssignValueColor(if UPEMA then Color.LIGHT_GREEN else if DOWNEMA then Color.RED else Color.YELLOW);
def UPEMA2 = AvgExp9[1] < AvgExp9;
def DOWNEMA2 = AvgExp9[1] > AvgExp9;
def UP8 = UPEMA and UPEMA2;
def DOWN8 = DOWNEMA and DOWNEMA2;
def priceColor8 = if UP8 then 1
                 else if DOWN8 then -1
                 else 0;
def UP11 = UPEMA;
def DOWN11 = DOWNEMA;
def priceColor11 = if UP11 then 1
                 else if DOWN11 then -1
                 else 0;
def UP12 = UPEMA2;
def DOWN12 = DOWNEMA2;
def priceColor12 = if UP12 then 1
                 else if DOWN12 then -1
                 else 0;
def UpCalc = (priceColor == 1) + (priceColor == 1) + (priceColor8 == 1) + (priceColor10 == 1);
def StrongUpCalc = (priceColor == 1) + (priceColor == 1)  + (priceColor10 == 1);
def CandleColor = if (priceColor == 1) and (priceColor12 == 1) and (Spark >= 2) then 1 else
                 if (priceColor == -1) and (Spark < 1) then -1 else 0;
def SparkUP = (Spark == 3) and (CandleColor == 1);
def SparkDN = (Spark == 0) and (CandleColor == -1);
def SparkUP1 = (Spark == 3) and (CandleColor == 1);
def SparkDN1 = (Spark == 0) and (CandleColor == -1);
def hide_SparkUP = if SparkUP1 and (SparkUP1[1] or SparkUP1[2] or SparkUP1[3] or SparkUP1[4] or SparkUP1[5]) then 0 else 1;
def hide_SparkDN = if SparkDN1 and (SparkDN1[1] or SparkDN1[2] or SparkDN1[3] or SparkDN1[4] or SparkDN1[5]) then 0 else 1;
def BigUPs = direction2 == 1 and direction2[1] < 1;
def BigDNs = direction2 == -1 and direction2[1] > -1;
def hide_BigUPs = if BigUPs and (BigUPs[1] or BigUPs[2] or BigUPs[3]) then 1 else 0;
def hide_BigDNs = if BigDNs and (BigDNs[1] or BigDNs[2] or BigDNs[3]) then 1 else 0;

def signal_up_price = if bigups then round(close,2) else signal_up_price[1];
def signal_dn_price = if bigdns then round(close,2) else signal_dn_price[1];
def sigmath = absvalue(signal_up_price - signal_up_price[1]);
def sig2math =  absvalue(signal_up_price - signal_dn_price[1]);
def sig3math =  absvalue(signal_dn_price - signal_dn_price[1]);
def agperiod1 = GetAggregationPeriod();
def timeframe = if agperiod1 <= aggregationperiod.DAY then aggregationperiod.DAY else agperiod1;
def Vol = volume(period = timeframe);
def at_High = high(period = timeframe);
def at_Open = open(period = timeframe);
def at_Close = close(period = timeframe);
def at_Low = low(period = timeframe);
def Vol1 = volume(period = timeframe);
def at_High1 = high(period = timeframe);
def at_Open1 = open(period = timeframe);
def at_Close1 = close(period = timeframe);
def at_Low1 = low(period = timeframe);
def Buy_Volume = RoundUp(Vol * (at_Close - at_Low) / (at_High - at_Low));
def Buy_percent = RoundUp((Buy_Volume / Vol) * 100);
def Sell_Volume = RoundDown(Vol1 * (at_High1 - at_Close1) / (at_High1 - at_Low1));
def Sell_percent = RoundUp((Sell_Volume / Vol1) * 100);
plot avg1 = ExpAverage(close(period = agperiod1), length8);
def height = avg1 - avg1[length8];
avg1.SetStyle(Curve.SHORT_DASH);
avg1.SetLineWeight(1);
def UP1 = avg1[1] < avg1;
def DOWN1 = avg1[1] > avg1;
Avg1.AssignValueColor(if UP1 then Color.LIGHT_GREEN else if DOWN1 then Color.RED else Color.gray);
plot avg2 = ExpAverage(close(period = agperiod1), length8);
def height2 = avg2 - avg2[length10];
avg2.SetStyle(Curve.SHORT_DASH);
avg2.SetLineWeight(1);
def UP2 = avg2[1] < avg2;
def DOWN2 = avg2[1] > avg2;
Avg2.AssignValueColor(if UP2 then Color.LIGHT_GREEN else if DOWN2 then Color.RED else Color.gray);
# --- TRIPLE EXHAUSTION ---
def over_bought_3x = 80;
def over_sold_3x = 20;
def KPeriod_3x = 10;
def DPeriod_3x = 10;
def priceH1 = high(period = agperiod1);
def priceL1 = low(period = agperiod1);
def priceC1 = close(period = agperiod1);
def priceO1 = close(period = agperiod1);
def priceH_3x = high;
def priceL_3x = low;
def priceC_3x = close;
# --- TRIPLE EXHAUSTION INDICATORS - StochasticSlow / MACD / MACD StDev /DMI+/-
def bn = barnumber();
def SlowK_3x = reference StochasticFull(over_bought_3x, over_sold_3x, KPeriod_3x, DPeriod_3x, priceH_3x, priceL_3x, priceC_3x, 3, averagetype).FullK;
def MACD_3x = reference MACD()."Value";
def priceMean_3x = Average(MACD_3x, length_3x);
def MACD_stdev_3x =  (MACD_3x - priceMean_3x) / StDev(MACD_3x, length_3x);
def dPlus_3x = reference DMI()."DI+";
def dMinus_3x = reference DMI()."DI-";
def sellerRegular = SlowK_3x < 20 and MACD_stdev_3x < -1 and dPlus_3x < 15;
def sellerExtreme = SlowK_3x < 20 and MACD_stdev_3x < -2 and dPlus_3x < 15;
def buyerRegular = SlowK_3x > 80 and MACD_stdev_3x > 1 and dMinus_3x < 15;
def buyerExtreme = SlowK_3x > 80 and MACD_stdev_3x > 2 and dMinus_3x < 15;
#Arrows/Triggers
def RegularBuy = if sellerRegular[1] and !sellerRegular then 1 else 0;
def RegularBuy_bn = if RegularBuy then bn else RegularBuy_bn[1];
def ExtremeBuy = if sellerExtreme[1] and !sellerExtreme then 1 else 0;
def ExtremeBuy_bn = if ExtremeBuy then bn else ExtremeBuy_bn[1];
def RegularSell = if buyerRegular[1] and !buyerRegular then 1 else 0;
def RegularSell_bn = if RegularSell then bn else RegularSell_bn[1];
def ExtremeSell = if buyerExtreme[1] and !buyerExtreme then 1 else 0;
def ExtremeSell_bn = if ExtremeSell then bn else ExtremeSell_bn[1];
def Condition1UP = avg1 > avg2;
def Condition1DN = avg1 < avg2;
def Condition2UP = Buy_percent > 50;
def Condition2DN = Buy_percent < 50;
def BullUP = Condition1UP + Condition2UP;
def BearDN = Condition1DN + Condition2DN;
def Bull_Bear = if Condition1UP==1 and Condition2UP == 1 then 1 else if Condition1DN == 1 and Condition2DN == 1 then -1 else 0;
def Condition3UP = if buyerRegular then 1 else 0;
def Condition3DN =  if sellerRegular then 1 else 0;
def Condition4UP =  if buyerExtreme then 1 else 0;
def Condition4DN =  if sellerExtreme then 1 else 0;
def priceColor1 = if ((avg1[1]<avg1) and (avg2[1]<avg2)) then 1
                 else if((avg1[1]>avg1) and (avg2[1]>avg2)) then -1
                 else priceColor[1];
def pd = 22;
def bbl = 20;
def lb = 50;
def ph = 0.85;
def pl = 1.01;
# Downtrend Criterias
def ltLB = 40;
def mtLB = 14;
def str = 3;
def AtrMult_Blst = 1.0;
def nATR_Blst = 4;
def AvgType_Blst = AverageType.HULL;
def trig_Blst = 20;
def pd_Blst = 22;
def bbl_Blst = 20;
def mult = 50;
def mult_Blst = 2.0;
def lb_Blst = 50;
def ph_Blst = 0.85;
def pl_Blst = 1.01;
def ATR = MovingAverage(AvgType, TrueRange(high, close, low), nATR_Blst);
def UP_B = HL2 + (AtrMult * ATR);
def DN = HL2 + (-AtrMult * ATR);
def ST = if close < ST[1] then UP_B else DN;
def SuperTrend = ST;
def val1 = AbsValue(close - open);
def range = high - low;
def blastOffVal = (val1 / range) * 100;
def trigger = trig;
def alert1 = blastOffVal < trig;
def col = blastOffVal < trig;
def blast_candle = blastOffVal < trig;
# Downtrend Criterias
def ltLB_Blst = 40;
def mtLB_Blst = 14;
def wvf = ((highest(close, pd) - low) / (highest(close, pd))) * 100;
def sDev = mult * stdev(wvf, bbl);
def midLine1 = SimpleMovingAvg(wvf, bbl);
def lowerBand1 = midLine1 - sDev;
def upperBand1 = midLinE1 + sDev;
def rangeHigh = (highest(wvf, lb)) * ph;
#  Filtered Bar Criteria
def upRange = low > low[1] and close > high[1];
def upRange_Aggr = close > close[1] and close > open[1];
def filtered = ((wvf[1] >= upperBand1[1] or wvf[1] >= rangeHigh[1]) and (wvf<upperBand1 and wvf<rangeHigh));
def filtered_Aggr = (wvf[1] >= upperBand1[1] or wvf[1] >= rangeHigh[1]);
# Alerts Criteria 1
def alert4 = upRange_Aggr and close > close[str] and (close < close[ltLB] or close < close[mtLB]) and filtered_Aggr;
def BulgeLengthV = 20;
def SqueezeLengthV = 20;
def BulgeLengthV2 = 20;
def SqueezeLengthV2 = 20;
###################################
##Candle Color
###################################
AssignPriceColor(if Strategy_ColoredCandlesOn then if alert4 and alert4[1] then Color.magenta
else if alert4 then Color.cyan
else if color_OBOS and (C3_LINE_1 OR C3_LINE_2) then Color.YELLOW
else if Color_3x and buyerRegular then Color.green
else if Color_3xt and buyerExtreme then Color.green
else if direction == 1 then Color.LIGHT_GREEN
else if Color_blst and close < ST and blastOffVal < trig then Color.white
else if Color_3x and sellerRegular then Color.dark_red
else if Color_3xt and sellerExtreme then Color.Dark_red
else if direction == -1 then Color.RED
else Color.GRAY
else Color.CURRENT);
###################################
##Plots
###################################
plot TS_UP = if show_ts_signals and upsignal then 1 else 0;
TS_UP.SetPaintingStrategy(PaintingStrategy.BOOLEAN_ARROW_UP);
TS_UP.AssignValueColor(color.cyan);
plot TS_DN = if show_ts_signals and downsignal then 1 else 0;
TS_DN.SetPaintingStrategy(PaintingStrategy.BOOLEAN_ARROW_DOWN);
TS_DN.AssignValueColor(Color.cyan);
plot SparkUP_1 = (SparkUP1 and hide_SparkUP);
SparkUP_1.SetPaintingStrategy(PaintingStrategy.BOOLEAN_ARROW_UP);
SparkUP_1.AssignValueColor(Color.green);
plot SparkDN_1 = (SparkDN1 and hide_SparkDN);
SparkDN_1.SetPaintingStrategy(PaintingStrategy.BOOLEAN_ARROW_DOWN);
SparkDN_1.AssignValueColor(Color.Light_red);
plot signal_up = (direction2 == 1 and direction2[1] < 1);
signal_up.SetPaintingStrategy(PaintingStrategy.BOOLEAN_ARROW_UP);
signal_up.AssignValueColor(if(direction2 == 1 and direction2[1] < 1)then color.white else color.gray);
signal_up.Hide();
signal_up.HideBubble();
signal_up.HideTitle();
plot signal_dn = (direction2 == -1 and direction2[1] > -1);
signal_dn.SetPaintingStrategy(PaintingStrategy.BOOLEAN_ARROW_DOWN);
signal_dn.AssignValueColor(if(direction2 == -1 and direction2[1] > -1) then color.white else color.gray);
signal_dn.Hide();
signal_dn.HideBubble();
signal_dn.HideTitle();
###################################
##Alerts
###################################
Alert(signal_up[1], "Buy", Alert.BAR, Sound.DING);
Alert(signal_dn[1], "Sell", Alert.BAR, Sound.DING);
###################################
##Labels
###################################
def Buy = UP_OS;
def Sell = DOWN_OB;
def conditionLTB = (conditionK2UP and (Consensus_Level < 0));
def conditionLTS = (conditionK3DN and (Consensus_Level > 0));
def conditionBO = ((Upper_BandS[1] < Upper_BandS))
              and ((Lower_BandS[1] < Lower_BandS))
              and ((Upper_BandK[1] < Upper_BandK))
              and ((Lower_BandK[1] < Lower_BandK));
def conditionBD = ((Upper_BandS[1] > Upper_BandS))
              and ((Lower_BandS[1] > Lower_BandS))
              and ((Upper_BandK[1] > Upper_BandK))
              and ((Lower_BandK[1] > Lower_BandK));
# --- C3 LABELS ---
AddLabel(yes, if conditionLTB then "BULL: Look to Buy"
         else if conditionLTS then "BEAR: Look to Sell"
         else if conditionK2UP then "TREND: BULL"
         else if conditionK3DN then "TREND: BEAR" else "TREND: CONSOLIDATION",
              if conditionLTB then Color.GREEN
         else if conditionLTS then Color.RED
         else if conditionK2UP then Color.LIGHT_GREEN
         else if conditionK3DN then Color.LIGHT_RED else Color.GRAY);
AddLabel(yes, if conditionBD then "BREAKDOWN"
         else if conditionBO then "BREAKOUT" else "NO BREAK",
              if conditionBD then Color.RED
         else if conditionBO then Color.GREEN else Color.GRAY);
def Spark_2_label = yes;
def Spark_3_label = yes;
def Spark_4_label = yes;
#Spark 1
AddLabel(showLabels, if (Spark == 3) then "SPARK: " + Round(Spark, 1)
         else if (Spark == 0) then  "SPARK: " + Round(Spark, 1) else "SPARK: " + Round(Spark, 1),
              if (Spark == 3) then Color.YELLOW
         else if (Spark == 2) then Color.GREEN
         else if (Spark == 0) then Color.RED else Color.GRAY);
#--- END ---
AddLabel(showlabels, if  Condition1UP==1 and Condition2UP == 1 and (Condition3UP == 1 or Condition4UP == 1) then "**CALLS ONLY!**"
else if Condition1UP == 1 and Condition2UP == 1 then "Very Bullish"
else if direction == 1 then "Bullish"
else if Condition1DN == 1 and Condition2DN == 1 and (Condition3DN == 1 or Condition4DN == 1) then "**PUTS ONLY!**"
else if Condition1DN == 1 and Condition2DN == 1 then "Very Bearish"
else if direction == -1 then "Bearish"
else if ((avg[1] > avg) and (avg > avg2) and (Buy_percent > 50)) then "Bullish Retracement"
                else if ((avg[1] < avg) and (avg < avg2) and (Buy_percent < 50)) then "Bearish Retracement"
                else "CHOP",
                     if Condition1UP == 1 and Condition2UP == 1 and (Condition3UP == 1 or Condition4UP == 1) then Color.cyan
                else if Condition1DN == 1 and Condition2DN == 1 and (Condition3DN == 1 or Condition4DN == 1) then Color.Magenta
                else if Condition1UP == 1 and Condition2UP == 1 then Color.GREEN
else if direction == 1 then Color.green
else if Condition1DN == 1 and Condition2DN == 1 then Color.RED
else if direction == -1 then Color.red
                else Color.orange);
AddLabel(yes, if MomentumUP then "Consensus Increasing = " + Round(Consensus_Level, 1) else if MomentumUP or MomentumDOWN and conditionOB then "Consensus OVERBOUGHT = " + Round(Consensus_Level, 1) else if MomentumDOWN then  "Consensus Decreasing = " + Round(Consensus_Level, 1) else if MomentumUP or MomentumDOWN and conditionOS then "Consensus OVERSOLD = " + Round(Consensus_Level, 1) else "Consensus = " + Round(Consensus_Level, 1), if conditionOB then Color.dark_RED else if conditionOS then Color.dark_GREEN else Color.GRAY);
AddLabel(squeeze_Alert, "SQUEEZE ALERT", if Squeeze_Alert then Color.YELLOW else Color.GRAY);
AddVerticalLine(showverticallineday and( GetDay() <> GetDay()[1]), "", Color.dark_gray, Curve.SHORT_DASH);


#
Last edited:
10,000% win rate... Jk... unfortunately I have been working nights mostly and have not been trading much... That being said when I lose, generally speaking my plan went right out the window and I buy something impulsively. The entry methods I have on page 1 are extremely safe especially when used together... there will be some more updates soon. Still working on some stuff....
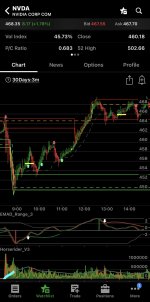
And concerning learning the 2 entry methods the are 2 and 3 steps each and line up more often than not then combine that with key levels etc... like this chart (of course not exactly the same as in real time but i can see the two entry methods lined up on the right hand side chart from a mile away.... you just gotta start sticking some lines are your chart to mark where you would have entered and exit based on the methods (if you so choose).... and though I am attempting to code the entry and exit signals for them though they are simple to use... not so simple to make the signals trustworthy / repeatable... at least not yet haha.
But something I wish I had done years ago is trading a prop firm... may cost you a few hundred dollars here and there but it can definitely help you learn how to manage your risk. Also trading futures is great come to find out. But dont get me wrong I havent quit my job and started a gauranteed 5000% return discord channel for 100/month... yet... haha but yeah for most of us simply managing your risk will go a lonnnnnng way. A very long way.

Im mean come on look at that... would ya just look at it?...


And concerning learning the 2 entry methods the are 2 and 3 steps each and line up more often than not then combine that with key levels etc... like this chart (of course not exactly the same as in real time but i can see the two entry methods lined up on the right hand side chart from a mile away.... you just gotta start sticking some lines are your chart to mark where you would have entered and exit based on the methods (if you so choose).... and though I am attempting to code the entry and exit signals for them though they are simple to use... not so simple to make the signals trustworthy / repeatable... at least not yet haha.
But something I wish I had done years ago is trading a prop firm... may cost you a few hundred dollars here and there but it can definitely help you learn how to manage your risk. Also trading futures is great come to find out. But dont get me wrong I havent quit my job and started a gauranteed 5000% return discord channel for 100/month... yet... haha but yeah for most of us simply managing your risk will go a lonnnnnng way. A very long way.

Im mean come on look at that... would ya just look at it?...


Last edited:
Goooooooood peeeeeopleeeee...
I added Horserider Volume V3 and C3 Big Spark MAX to page 1... will update the images and explanations soon... (the newest C3 Big Spark MAX study includes a "Key Level" label color coded to indicate which key level is nearby... and a "Bounce Incoming!" label that is determined by price near a key level within X of Alert4... buy more on that later...)
I added Horserider Volume V3 and C3 Big Spark MAX to page 1... will update the images and explanations soon... (the newest C3 Big Spark MAX study includes a "Key Level" label color coded to indicate which key level is nearby... and a "Bounce Incoming!" label that is determined by price near a key level within X of Alert4... buy more on that later...)
Update… had to fix the key level label calculation will update the links today.Goooooooood peeeeeopleeeee...
I added Horserider Volume V3 and C3 Big Spark MAX to page 1... will update the images and explanations soon... (the newest C3 Big Spark MAX study includes a "Key Level" label color coded to indicate which key level is nearby... and a "Bounce Incoming!" label that is determined by price near a key level within X of Alert4... buy more on that later...)
Still messing with EMAD. here is the link though still a work in progress at the moment but I like it so far... the lower high and higher low arrows are there as well you just have to turn them on in settings if you so choose. http://tos.mx/ucGYdNY
(here is the updated C3 Big Spark MAX - http://tos.mx/BWQdHdg)
Chart style: http://tos.mx/N1UAPnb
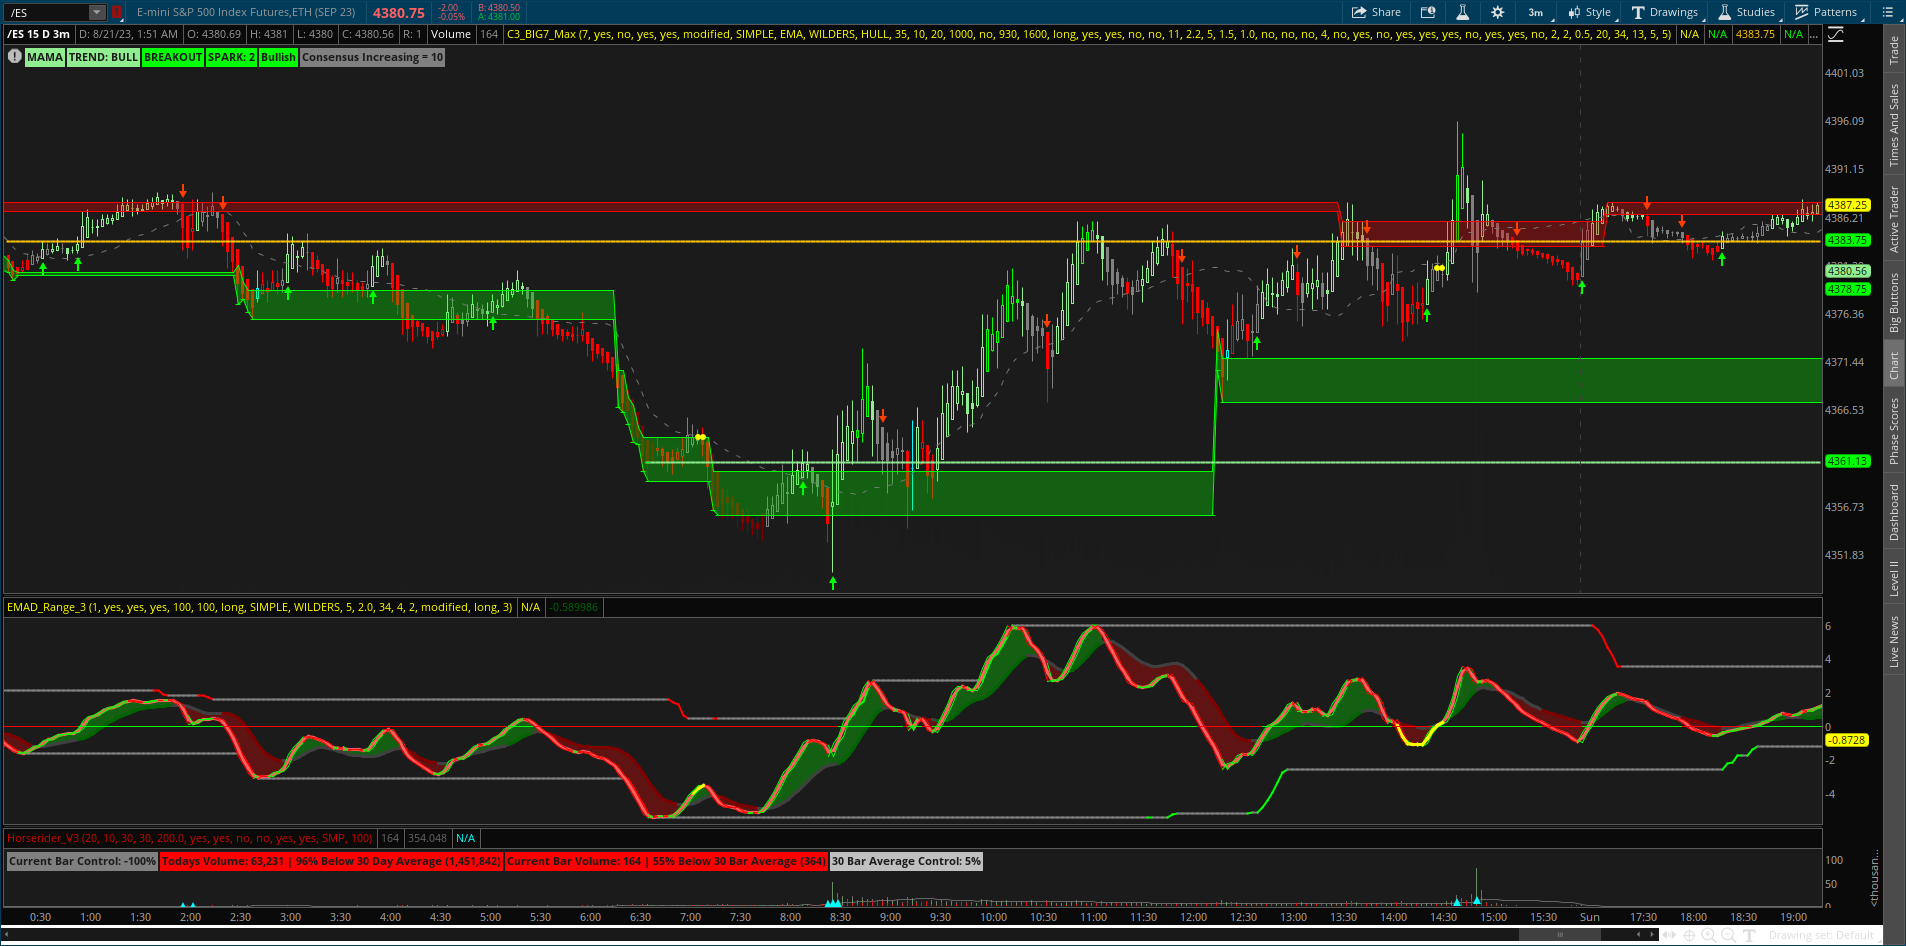
(here is the updated C3 Big Spark MAX - http://tos.mx/BWQdHdg)
Chart style: http://tos.mx/N1UAPnb

Last edited:
theblackjack
New member
Thanks so much for the Big 4 Watchlists Scanner. I'm new here and I have a very basic question. I added the Big 4 Column script onto my Study script list on TOS. Is that the way to do it? How do I run the scan on my watchlist? Thanks again.
https://usethinkscript.com/threads/how-to-use-thinkorswim-stock-hacker-scans.284/Thanks so much for the Big 4 Watchlists Scanner. I'm new here and I have a very basic question. I added the Big 4 Column script onto my Study script list on TOS. Is that the way to do it? How do I run the scan on my watchlist? Thanks again.
Good people... EMAD RANGE V1000 IS NEARLY COMPLETE!


EMAD Range V1000
Study Link - http://tos.mx/TPZlMrg

With "showtripleEx" arrows setting on: notice the arrows line up to the light green and light red lines the other exhaustion arrows are filtered out using the FirstHL and FirstLH (if you change the filterarrows number in settings it will not work for the exhaustion coloring) in the bar coloring... when those colored bars end watch for reversal or pullback.

daily:
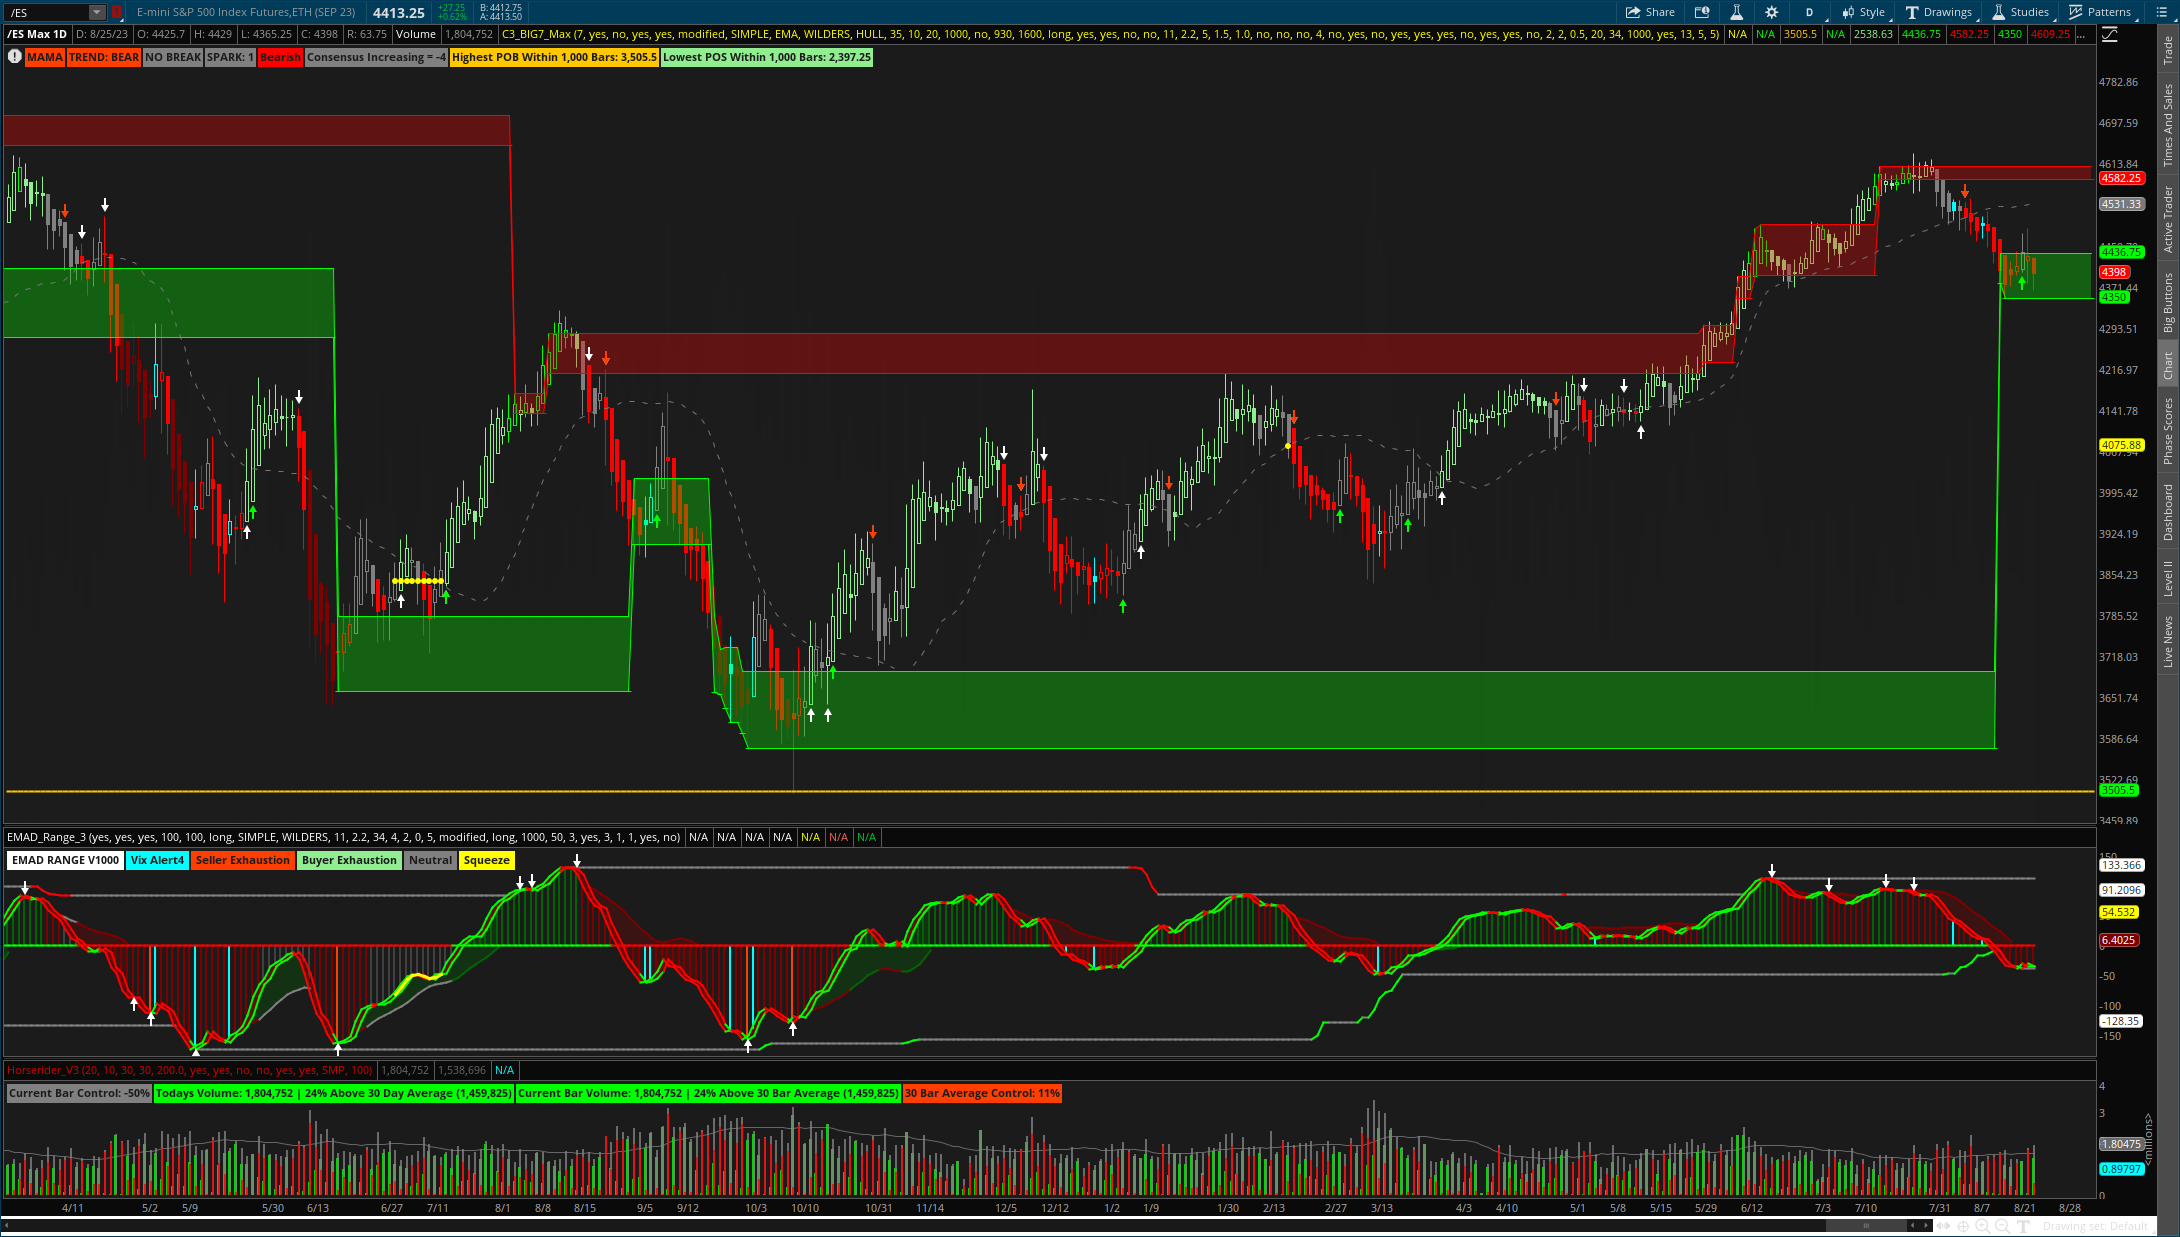
Study Link - http://tos.mx/TPZlMrg

With "showtripleEx" arrows setting on: notice the arrows line up to the light green and light red lines the other exhaustion arrows are filtered out using the FirstHL and FirstLH (if you change the filterarrows number in settings it will not work for the exhaustion coloring) in the bar coloring... when those colored bars end watch for reversal or pullback.

daily:

Last edited:
EMAD Range Variant
Updated some visual settings and added "how to" labels which can be turned off in settings.
(Updated with new calculation for arrows!) Newest study link: http://tos.mx/xBS63Tu
(will update with explanation soon)(* the arrows will only show during open and closed times in settings unless you set "tradedaytimeonly" to no*)
Chart Style (minus the ATR Dashboard): http://tos.mx/nRW2Bd9


Last edited:
This looks great, I love this indicator.Here’s what the new EMAD looks like in mobile…
I can't get the arrows to show on mobile top and bottom study, can you share your mobile settings?
Also, is there a script that the candles match the color of the EMAD Master line?
This looks great, I love this indicator.
I can't get the arrows to show on mobile top and bottom study, can you share your mobile settings?
Also, is there a script that the candles match the color of the EMAD Master line?
Attachments
Issue resolved. I needed to change the chart's appearance.Thanks for the great work on this. For some reason, the colors and green & red ranges are not showing for SPX but show for SPY and everything else. This is how it looks for SPX.
- Status
- Not open for further replies.
Similar threads
-
Volume Confirmation for a Trend System For ThinkOrSwim
- Started by GLENNOHULL
- Replies: 4
-
Confirmation Candle with Key Level and Weighted Paintbars Chart Setup For ThinkOrSwim
- Started by rip78
- Replies: 8
-
Confirmation Candles Indicator For ThinkorSwim
- Started by Christopher84
- Replies: 3K
-
DEMA Crossover with Heikin-Ashi Candle Confirmation for ThinkorSwim
- Started by theelderwand
- Replies: 67
-
Not the exact question you're looking for?
Start a new thread and receive assistance from our community.
87k+
Posts
1846
Online
Similar threads
-
Volume Confirmation for a Trend System For ThinkOrSwim
- Started by GLENNOHULL
- Replies: 4
-
Confirmation Candle with Key Level and Weighted Paintbars Chart Setup For ThinkOrSwim
- Started by rip78
- Replies: 8
-
Confirmation Candles Indicator For ThinkorSwim
- Started by Christopher84
- Replies: 3K
-
DEMA Crossover with Heikin-Ashi Candle Confirmation for ThinkorSwim
- Started by theelderwand
- Replies: 67
-
The Market Trading Game Changer
Join 2,500+ subscribers inside the useThinkScript VIP Membership Club
- Exclusive indicators
- Proven strategies & setups
- Private Discord community
- ‘Buy The Dip’ signal alerts
- Exclusive members-only content
- Add-ons and resources
- 1 full year of unlimited support
Frequently Asked Questions
What is useThinkScript?
useThinkScript is the #1 community of stock market investors using indicators and other tools to power their trading strategies. Traders of all skill levels use our forums to learn about scripting and indicators, help each other, and discover new ways to gain an edge in the markets.
How do I get started?
We get it. Our forum can be intimidating, if not overwhelming. With thousands of topics, tens of thousands of posts, our community has created an incredibly deep knowledge base for stock traders. No one can ever exhaust every resource provided on our site.
If you are new, or just looking for guidance, here are some helpful links to get you started.
- The most viewed thread:
https://usethinkscript.com/threads/repainting-trend-reversal-for-thinkorswim.183/ - Our most popular indicator:
https://usethinkscript.com/threads/buy-the-dip-indicator-for-thinkorswim.3553/ - Answers to frequently asked questions:
https://usethinkscript.com/threads/answers-to-commonly-asked-questions.6006/
What are the benefits of VIP Membership?
VIP members get exclusive access to these proven and tested premium indicators: Buy the Dip, Advanced Market Moves 2.0, Take Profit, and Volatility Trading Range. In addition, VIP members get access to over 50 VIP-only custom indicators, add-ons, and strategies, private VIP-only forums, private Discord channel to discuss trades and strategies in real-time, customer support, trade alerts, and much more. Learn all about VIP membership here.
How can I access the premium indicators?
To access the premium indicators, which are plug and play ready, sign up for VIP membership here.


