The Confirmation Trend Chart Setup | The End All Be All | For ThinkOrSwim

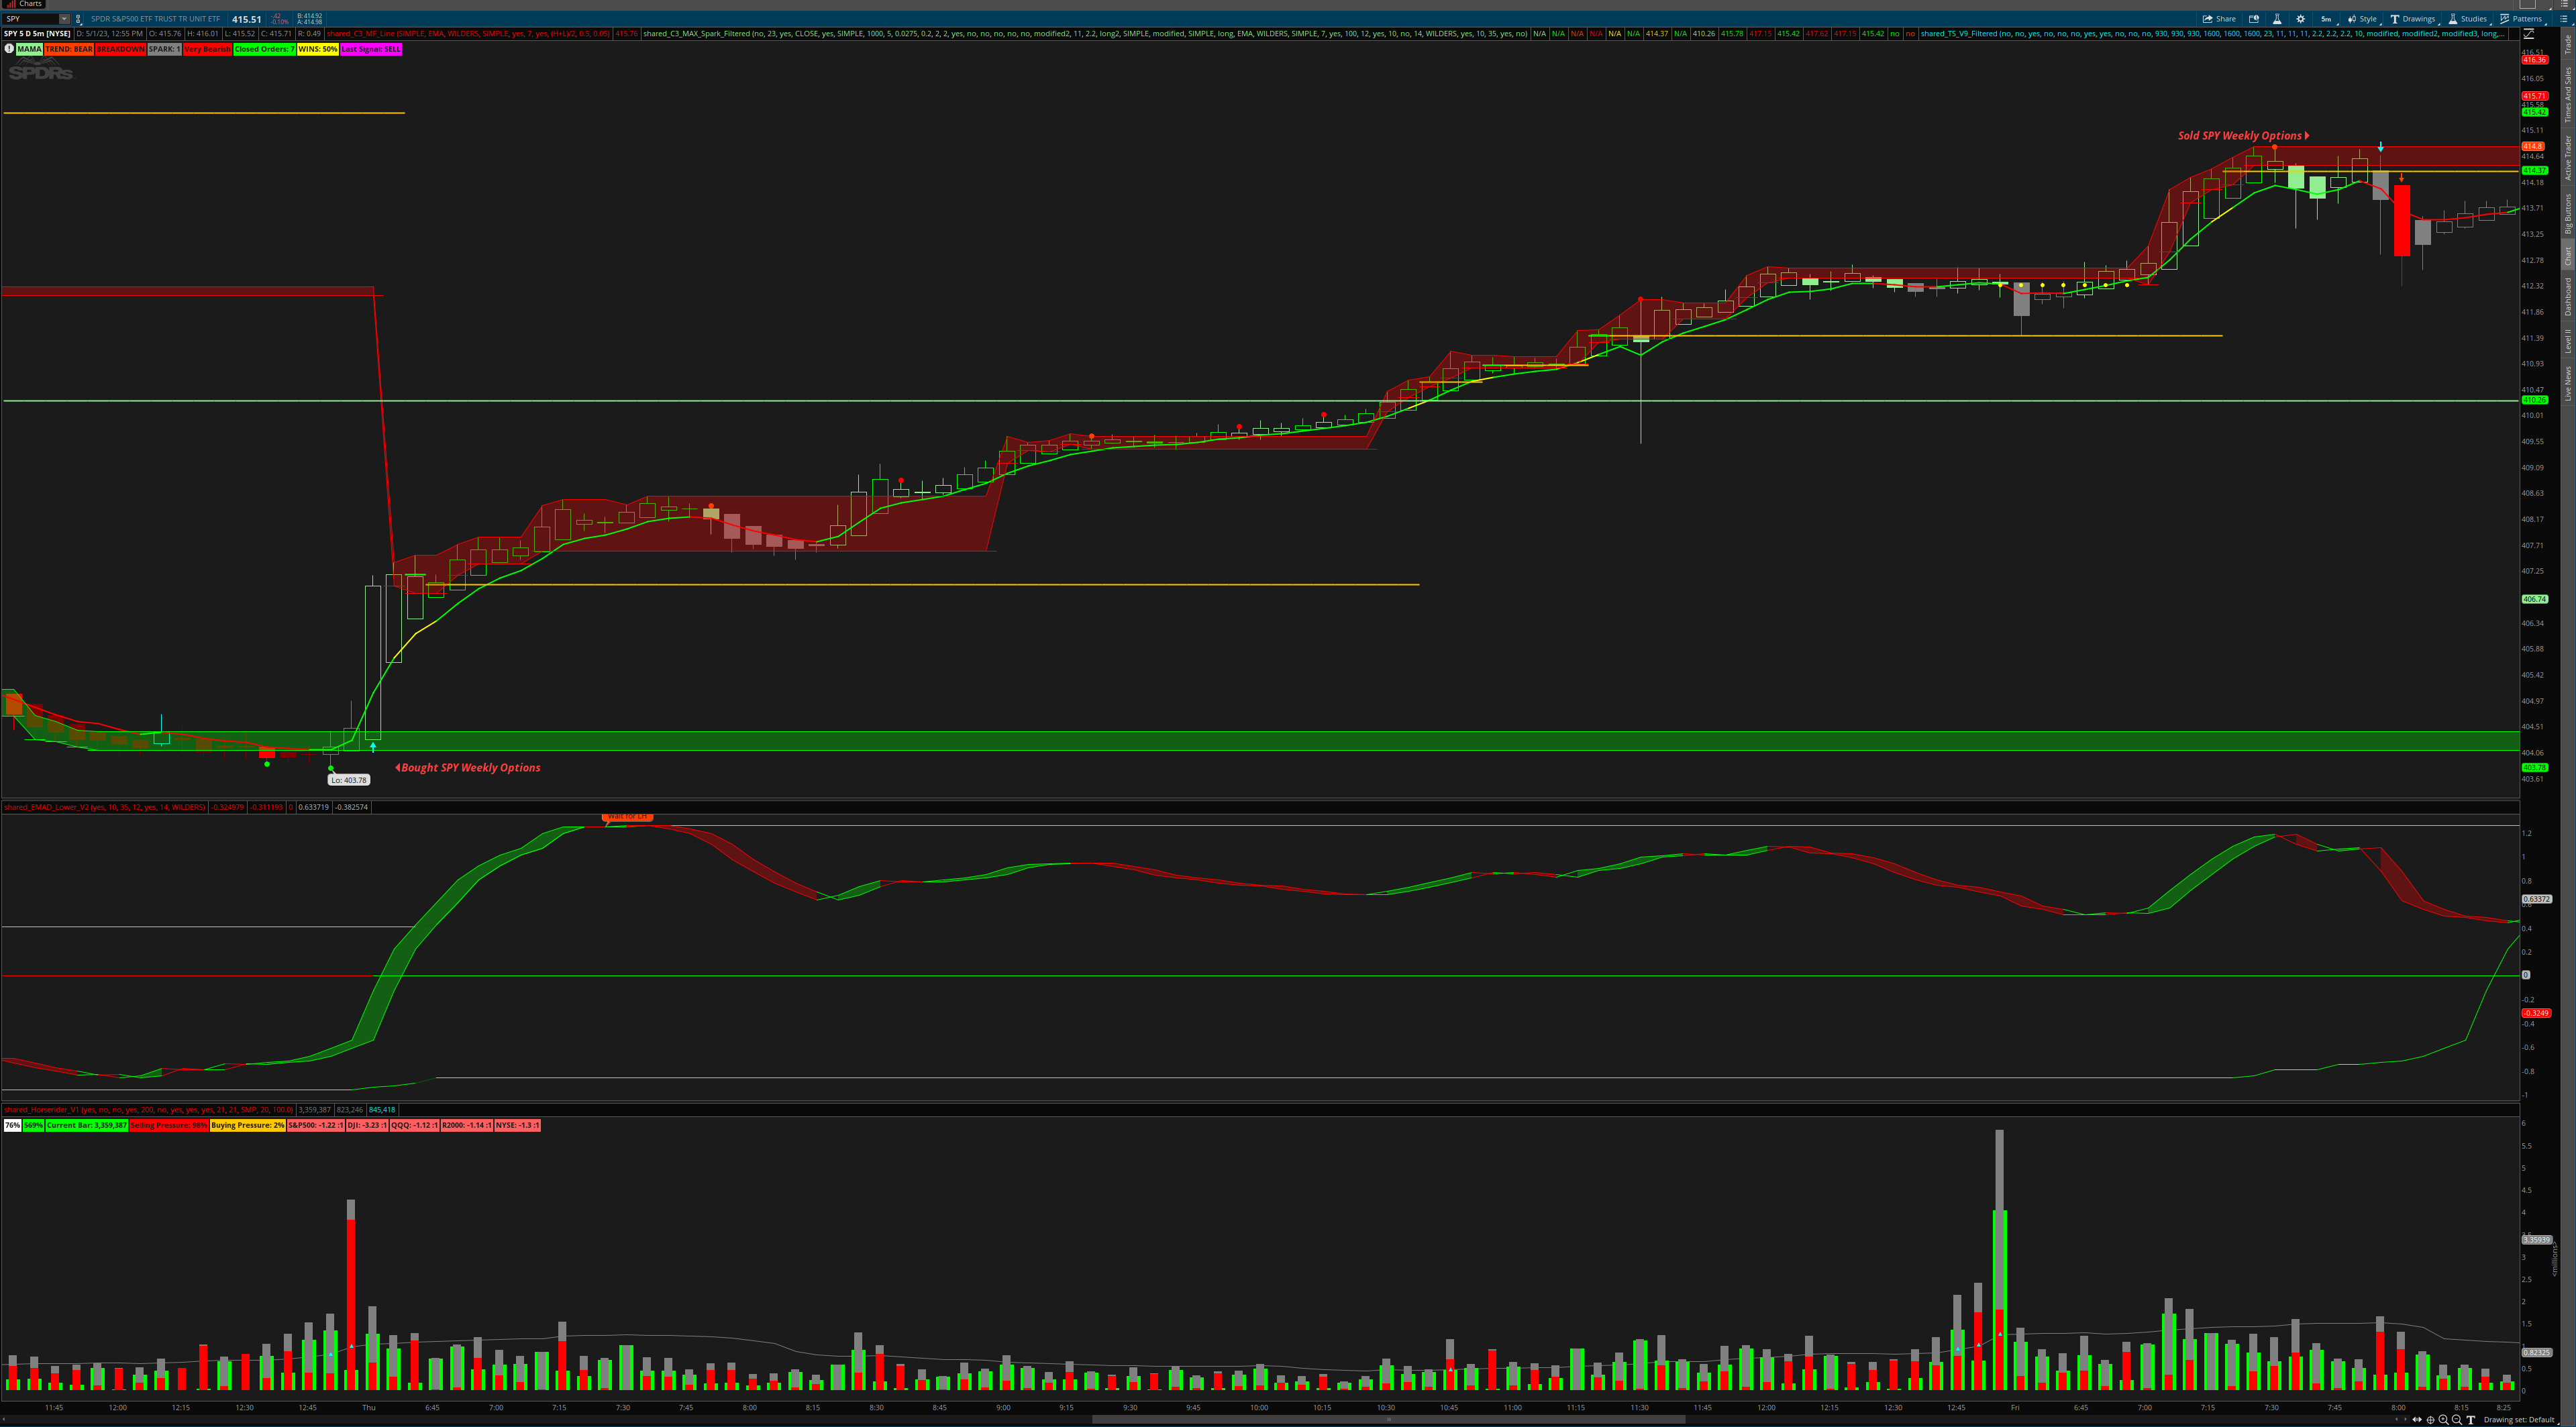
I believe patience always pays off, in this case 318% for SPY Weekly options :)

WbkFUYP.png


MC4QDl2.png

Awesome! Great to see your results...

To whom it may concern:
Some users (not all but for those that do) will see this and think that @quantum is implying that one should be patient and wait for whatever indication... which is not the case. Realize that this kind of success is 95% risk management, discipline, & patience - 5% indicators if that, as is any successful trading plan.

If possible could you use screenshots to elaborate on how you determine RR?
 
Last edited:

Join useThinkScript to post your question to a community of 21,000+ developers and traders.

To whom it may concern | Triple Exhaustion / Entry / Exit

Good people, and not good people (@METAL)…. (I’m joking geeez)(great people!) anyway… when it comes to daily type trade recap or potential entries exits etc. some of them will be from TOS Mobile as I am not always around the computer…

When things get volatile triple exhaustion is your friend… it does not repaint. When trending, as opposed to more volatile bouncing up and down, you will see more than one dot before the trend actually pulls back or reverses - which is why it is always best to use other means of confirmation as well. That being said if data from the fed or something of that nature is coming out soon along with heavy price action that generally tells me entry at exhaustion is a safe bet (with a tight stop) especially at “key levels”

The first screen shot you can see the 3 step zone entry method and on the way up there are 3 or 4 triple exhaustion dots, however the trend is steady and candles did not break below when the supply zone when the zone began to run horizontal at times until the end of the day when it broke down out of the zone then pulled back up to test re entry into the zone then market closed.

Anyway if you were to enter near step 3 (with a stoploss) you can use triple exhaustion on the way up as an indication to risk off soon. Also keep in mind the reaction to levels.

(Yellow arrows are the TS_V9_Spark_Filter version of TS_V9 single aggregation (no repaint) filtered by “Spark” - testing it out currently share link in post #13)

Screenshot 1. (2min SPY)

Screenshot 2. (5min SPY)
 
Last edited:
@HODL-Lay-HE-hoo! Here is some positive feedback on this strategy. I have been using Hamiltonian Monte Carlo for back-testing over the past few days. C3_Max_Spark worked surprisingly well on SPY Weekly options. I bought it at the first Buy signal at market open, sold it the next day and the Weeklys quadrupled in value with less than 8% drawdown. It's exceptional!

O2awl6B.png
@HODL-Lay-HE-hoo!

1. Higher ag is set to yes
2. I use trailing stop loss to exit the trades
[My risk management is overkill honestly, but I do it anyway because I learned my lesson the very very very hard way :)
--> First, I use HMC to calculate equity curves, max drawdowns and sortino ratios.
--> Then, I combine it with VIX and GEX to approximate my position sizing and risk to reward ratios
--> Finally, I use an approximate HMC-factor x ATR in my trailing stop loss to ride the trend and exit when stop loss gets hit]
3. I use MATLAB for HMC computations
Would love to see how you put all of this together per your description. I as many probably do, is FOMO out to soon. I know I do all the time. actually everyday. I have tried so many different ways to overcome this that I have forgot way more than I remember i have tried. I know videos are tough, but if you are willing to put together your process, I am sure we would all greatly appreciate it. Great job by the way.
 
Hi Everyone,

I recently stumbled across a study that was labeled "EMAD_Lower_V2_Pro" in THIS THREAD the other day. I thought I would clean it up a bit and post it here. See below for the code.
Adam


Ruby:
#DECLARATIONS
declare lower;


#USER INPUTS
## Upper and Lower EMAD Lines
input fastLength = 10;
input slowLength = 35;
input smoothLength = 12;
input smoothLength2 = 14;
input priceType = close;
input emadLineWeight = 2;
input showEMACloud = yes;
input showBubbles = yes;
input averageType = AverageType.WILDERS;


## Upper and Lower Band Lines
input bandLength = 100;
input bandLength2 = 200;


#GLOBAL COLOR DEFINITIONS
DefineGlobalColor("Green", CreateColor(0, 155, 0));
DefineGlobalColor("Red", CreateColor(225, 105, 105));
DefineGlobalColor("Gray", CreateColor(192, 192, 192));
DefineGlobalColor("Yellow", CreateColor(231, 190, 0));


#DEFINITIONS / CALCULATIONS

## UPPER EMAD LINE
def fastExpAvg = ExpAverage(priceType, fastLength);
def slowExpAvg = ExpAverage(priceType, slowLength);
def EMAD = (priceType - fastExpAvg);
def EMAD2 = (priceType - slowExpAvg);
def EMADAvg = (EMAD + EMAD2) / 2;
def upperEMADLine = ExpAverage(EMADAvg, smoothLength);

## LOWER EMAD LINE
def emadOpen = (upperEMADLine + upperEMADLine[1]) / 2;
def emadHigh = Max(upperEMADLine, upperEMADLine[1]);
def emadLow = Min(upperEMADLine, upperEMADLine[1]);
def emadClose = upperEMADLine;
def bottom = Min(emadClose[1], emadLow);
def tr = TrueRange(emadHigh, emadClose, emadLow);
def ptr = tr / (bottom + tr / 2);
def APTR = MovingAverage(averageType, ptr, smoothLength2);
def upperBand = emadClose[1] + (APTR * emadOpen);
def lowerBand = emadClose[1] - (APTR * emadOpen);
def lowerEMADLine = (upperBand + lowerBand) / 2;

## TOP AND BOTTOM BANDS
def zeroLineData = if IsNaN(close) then Double.NaN else 0;
def EMADSUp = upperEMADLine > zeroLineData;
def EMADSDown = upperEMADLine < zeroLineData;
def EMADdown = (lowerEMADLine > upperEMADLine);
def EMADup = (upperEMADLine >= lowerEMADLine);
def topBand = Highest(lowerEMADLine, bandLength);
def bottomBand = Lowest(lowerEMADLine, bandLength);


## BAND DIRECTION (USED ONLY FOR COLORING - NOT USED FOR PLOTS)
def topBandStepDown = if topBand < topBand[1] then 1 else 0;
def topBandStepUp = if topBand > topBand[1] then 1 else 0;
def bottomBandStepDown = if bottomBand < bottomBand[1] then 1 else 0;
def bottomBandStepUp = if bottomBand > bottomBand[1] then 1 else 0;
def bothBandsDown = bottomBandStepDown and topBandStepDown;
def bothBandsUp = bottomBandStepUp and topBandStepUp;
def bullBias = (bottomBand > zeroLineData);
def bearBias = (topBand < zeroLineData);


## BUBBLE CALCULATIONS (USED ONLY FOR BUBBLES)
def midBand = (upperBand + lowerBand) / 2;
def crossesUp = if (midBand[1] > upperEMADLine[1])and(midBand < upperEMADLine) then 1 else 0;
def crossesDown = if (upperEMADLine[1] > midBand[1])and(upperEMADLine < midBand) then 1 else 0;
def valueUp = if crossesUp then midBand else 0;
def valueDown = if crossesDown then midBand else 0;
def crossesUpline = if (valueUp - bottomBand) == 0 then 1 else 0;
def crossesDownline = if (valueDown - topBand) == 0 then 1 else 0;
def crossesUpline_filter = if crossesUpline and (crossesUpline[1] or crossesUpline[2]  or crossesUpline[3]   or crossesUpline[4])then 0 else 1;
def crossesDownline_filter = if crossesDownline and (crossesDownline[1] or crossesDownline[2]  or crossesDownline[3]   or crossesDownline[4])then 0 else 1;


#PLOTS
plot zeroLine = zeroLineData;
plot upperEMADLinePlot = upperEMADLine;
plot lowerEMADLinePlot = lowerEMADLine;
plot masterEMADLinePlot = (upperEMADLinePlot + lowerEMADLinePlot) / 2;
plot topBandPlot = topBand;
plot bottomBandPlot = bottomBand;


#FORMATTING
upperEMADLinePlot.HideTitle();
upperEMADLinePlot.HideBubble();
upperEMADLinePlot.AssignValueColor(
    if (lowerEMADLinePlot > upperEMADLinePlot) then GlobalColor("Red")
    else if (lowerEMADLinePlot < upperEMADLinePlot) then GlobalColor("Green")
    else GlobalColor("Gray")
);
lowerEMADLinePlot.HideTitle();
lowerEMADLinePlot.HideBubble();
lowerEMADLinePlot.AssignValueColor(
    if (lowerEMADLinePlot > upperEMADLinePlot) then GlobalColor("Red")
    else if (lowerEMADLinePlot < upperEMADLinePlot) then GlobalColor("Green")
    else GlobalColor("Gray")
);
masterEMADLinePlot.HideTitle();
masterEMADLinePlot.HideBubble();
masterEMADLinePlot.SetLineWeight(emadLineWeight);
masterEMADLinePlot.AssignValueColor(
    if masterEMADLinePlot > masterEMADLinePlot[2] then GlobalColor("Green")
    else if masterEMADLinePlot < masterEMADLinePlot[2] then GlobalColor("Red")
    else GlobalColor("Gray")
);
zeroLine.HideTitle();
zeroLine.HideBubble();
zeroLine.AssignValueColor(
    if (upperEMADLinePlot > zeroLine) then GlobalColor("Green")
    else if (upperEMADLinePlot < zeroLine) then GlobalColor("Red")
    else GlobalColor("Yellow")
);
topBandPlot.HideTitle();
topBandPlot.HideBubble();
topBandPlot.AssignValueColor(
    if bothBandsDown then Color.dark_red
    else if bothBandsUp then color.Dark_green
    else if topBandStepUp then GlobalColor("Green")
    else if topBandStepDown then GlobalColor("Red")
    else if bearBias then GlobalColor("Yellow")
    else GlobalColor("Gray")
);
bottomBandPlot.HideTitle();
bottomBandPlot.HideBubble();
bottomBandPlot.AssignValueColor(
    if bothBandsDown then Color.dark_red
    else if bothBandsUp then color.Dark_green
    else if bottomBandStepUp then GlobalColor("Green")
    else if bottomBandStepDown then GlobalColor("Red")
    else if bullBias then GlobalColor("Yellow")
    else  GlobalColor("Gray")
);


#CLOUDS
AddCloud(if showEMACloud and (lowerEMADLinePlot > upperEMADLinePlot) then lowerEMADLinePlot else Double.NaN, upperEMADLinePlot, GlobalColor("Red"), Color.CURRENT);
AddCloud(if showEMACloud and (upperEMADLinePlot >= lowerEMADLinePlot) then upperEMADLinePlot else Double.NaN, lowerEMADLinePlot, GlobalColor("Green"), Color.CURRENT);


#BUBBLES
AddChartBubble(showBubbles and crossesUpline and crossesUpline_filter, midBand, "Wait for HL", GlobalColor("Green"), no);
AddChartBubble(showBubbles and crossesDownline and crossesDownline_filter, midBand,"Wait for LH" , GlobalColor("Red"), yes);
 
Last edited by a moderator:
Hi Everyone,

I recently stumbled across a study that was labeled "EMAD_Lower_V2_Pro" in THIS THREAD the other day. I thought I would clean it up a bit and post it here. See below for the code.
Adam


Ruby:
#DECLARATIONS
declare lower;


#USER INPUTS
## Upper and Lower EMAD Lines
input fastLength = 10;
input slowLength = 35;
input smoothLength = 12;
input smoothLength2 = 14;
input priceType = close;
input emadLineWeight = 2;
input showEMACloud = yes;
input showBubbles = yes;
input averageType = AverageType.WILDERS;


## Upper and Lower Band Lines
input bandLength = 100;
input bandLength2 = 200;


#GLOBAL COLOR DEFINITIONS
DefineGlobalColor("Green", CreateColor(0, 155, 0));
DefineGlobalColor("Red", CreateColor(225, 105, 105));
DefineGlobalColor("Gray", CreateColor(192, 192, 192));
DefineGlobalColor("Yellow", CreateColor(231, 190, 0));


#DEFINITIONS / CALCULATIONS

## UPPER EMAD LINE
def fastExpAvg = ExpAverage(priceType, fastLength);
def slowExpAvg = ExpAverage(priceType, slowLength);
def EMAD = (priceType - fastExpAvg);
def EMAD2 = (priceType - slowExpAvg);
def EMADAvg = (EMAD + EMAD2) / 2;
def upperEMADLine = ExpAverage(EMADAvg, smoothLength);

## LOWER EMAD LINE
def emadOpen = (upperEMADLine + upperEMADLine[1]) / 2;
def emadHigh = Max(upperEMADLine, upperEMADLine[1]);
def emadLow = Min(upperEMADLine, upperEMADLine[1]);
def emadClose = upperEMADLine;
def bottom = Min(emadClose[1], emadLow);
def tr = TrueRange(emadHigh, emadClose, emadLow);
def ptr = tr / (bottom + tr / 2);
def APTR = MovingAverage(averageType, ptr, smoothLength2);
def upperBand = emadClose[1] + (APTR * emadOpen);
def lowerBand = emadClose[1] - (APTR * emadOpen);
def lowerEMADLine = (upperBand + lowerBand) / 2;

## TOP AND BOTTOM BANDS
def zeroLineData = if IsNaN(close) then Double.NaN else 0;
def EMADSUp = upperEMADLine > zeroLineData;
def EMADSDown = upperEMADLine < zeroLineData;
def EMADdown = (lowerEMADLine > upperEMADLine);
def EMADup = (upperEMADLine >= lowerEMADLine);
def topBand = Highest(lowerEMADLine, bandLength);
def bottomBand = Lowest(lowerEMADLine, bandLength);


## BAND DIRECTION (USED ONLY FOR COLORING - NOT USED FOR PLOTS)
def topBandStepDown = if topBand < topBand[1] then 1 else 0;
def topBandStepUp = if topBand > topBand[1] then 1 else 0;
def bottomBandStepDown = if bottomBand < bottomBand[1] then 1 else 0;
def bottomBandStepUp = if bottomBand > bottomBand[1] then 1 else 0;
def bothBandsDown = bottomBandStepDown and topBandStepDown;
def bothBandsUp = bottomBandStepUp and topBandStepUp;
def bullBias = (bottomBand > zeroLineData);
def bearBias = (topBand < zeroLineData);


## BUBBLE CALCULATIONS (USED ONLY FOR BUBBLES)
def midBand = (upperBand + lowerBand) / 2;
def crossesUp = if (midBand[1] > upperEMADLine[1])and(midBand < upperEMADLine) then 1 else 0;
def crossesDown = if (upperEMADLine[1] > midBand[1])and(upperEMADLine < midBand) then 1 else 0;
def valueUp = if crossesUp then midBand else 0;
def valueDown = if crossesDown then midBand else 0;
def crossesUpline = if (valueUp - bottomBand) == 0 then 1 else 0;
def crossesDownline = if (valueDown - topBand) == 0 then 1 else 0;
def crossesUpline_filter = if crossesUpline and (crossesUpline[1] or crossesUpline[2]  or crossesUpline[3]   or crossesUpline[4])then 0 else 1;
def crossesDownline_filter = if crossesDownline and (crossesDownline[1] or crossesDownline[2]  or crossesDownline[3]   or crossesDownline[4])then 0 else 1;


#PLOTS
plot zeroLine = zeroLineData;
plot upperEMADLinePlot = upperEMADLine;
plot lowerEMADLinePlot = lowerEMADLine;
plot masterEMADLinePlot = (upperEMADLinePlot + lowerEMADLinePlot) / 2;
plot topBandPlot = topBand;
plot bottomBandPlot = bottomBand;


#FORMATTING
upperEMADLinePlot.HideTitle();
upperEMADLinePlot.HideBubble();
upperEMADLinePlot.AssignValueColor(
    if (lowerEMADLinePlot > upperEMADLinePlot) then GlobalColor("Red")
    else if (lowerEMADLinePlot < upperEMADLinePlot) then GlobalColor("Green")
    else GlobalColor("Gray")
);
lowerEMADLinePlot.HideTitle();
lowerEMADLinePlot.HideBubble();
lowerEMADLinePlot.AssignValueColor(
    if (lowerEMADLinePlot > upperEMADLinePlot) then GlobalColor("Red")
    else if (lowerEMADLinePlot < upperEMADLinePlot) then GlobalColor("Green")
    else GlobalColor("Gray")
);
masterEMADLinePlot.HideTitle();
masterEMADLinePlot.HideBubble();
masterEMADLinePlot.SetLineWeight(emadLineWeight);
masterEMADLinePlot.AssignValueColor(
    if masterEMADLinePlot > masterEMADLinePlot[2] then GlobalColor("Green")
    else if masterEMADLinePlot < masterEMADLinePlot[2] then GlobalColor("Red")
    else GlobalColor("Gray")
);
zeroLine.HideTitle();
zeroLine.HideBubble();
zeroLine.AssignValueColor(
    if (upperEMADLinePlot > zeroLine) then GlobalColor("Green")
    else if (upperEMADLinePlot < zeroLine) then GlobalColor("Red")
    else GlobalColor("Yellow")
);
topBandPlot.HideTitle();
topBandPlot.HideBubble();
topBandPlot.AssignValueColor(
    if bothBandsDown then Color.dark_red
    else if bothBandsUp then color.Dark_green
    else if topBandStepUp then GlobalColor("Green")
    else if topBandStepDown then GlobalColor("Red")
    else if bearBias then GlobalColor("Yellow")
    else GlobalColor("Gray")
);
bottomBandPlot.HideTitle();
bottomBandPlot.HideBubble();
bottomBandPlot.AssignValueColor(
    if bothBandsDown then Color.dark_red
    else if bothBandsUp then color.Dark_green
    else if bottomBandStepUp then GlobalColor("Green")
    else if bottomBandStepDown then GlobalColor("Red")
    else if bullBias then GlobalColor("Yellow")
    else  GlobalColor("Gray")
);


#CLOUDS
AddCloud(if showEMACloud and (lowerEMADLinePlot > upperEMADLinePlot) then lowerEMADLinePlot else Double.NaN, upperEMADLinePlot, GlobalColor("Red"), Color.CURRENT);
AddCloud(if showEMACloud and (upperEMADLinePlot >= lowerEMADLinePlot) then upperEMADLinePlot else Double.NaN, lowerEMADLinePlot, GlobalColor("Green"), Color.CURRENT);


#BUBBLES
AddChartBubble(showBubbles and crossesUpline and crossesUpline_filter, midBand, "Wait for HL", GlobalColor("Green"), no);
AddChartBubble(showBubbles and crossesDownline and crossesDownline_filter, midBand,"Wait for LH" , GlobalColor("Red"), yes);
Very nice. My goodness… I need to learn to write code efficiently… beautiful. Thank you!
 
Last edited:
@HODL-Lay-HE-hoo!
Hi, is there a quick way to display C3_Max_Spark_Filtered like yours on pg1? I pasted the script but there are about 7-9 moving avg lines on the chart. Is there a quick way to turn those off in the settings besides going to each AvgExp... item individually and turning off its "show" setting at the bottom of the config settings? Thanks in advance, really like your mods and appreciate all your coding time and effort!!!
 
All the explanations of charts on this thread are explaining the End all Be All all studies Correct? Is the latest version of End All Be All Confirmation Trend | The End All Be All | Chart Style (with stiffness clouds) - http://tos.mx/Sy7Cnm9 (Link posted 5/18/23)?
 
All the explanations of charts on this thread are explaining the End all Be All all studies Correct? Is the latest version of End All Be All Confirmation Trend | The End All Be All | Chart Style (with stiffness clouds) - http://tos.mx/Sy7Cnm9 (Link posted 5/18/23)?
The post called "General Information" is information regarding the style with all studies... the subsequent posts explain each study individually that are in the style.
 
Last edited:
The indications do not always work well on the chart for the contracts... the one min SPX has a few indications on my end.
Hey Hod, May be a dumb question but when you say wait for LH or HL in the EMAD, Do you mean in the EMAD or on the chart, look for at the LH/HL?
 

Not the exact question you're looking for?

Start a new thread and receive assistance from our community.

87k+ Posts
155 Online
Create Post

The Market Trading Game Changer

Join 2,500+ subscribers inside the useThinkScript VIP Membership Club
  • Exclusive indicators
  • Proven strategies & setups
  • Private Discord community
  • ‘Buy The Dip’ signal alerts
  • Exclusive members-only content
  • Add-ons and resources
  • 1 full year of unlimited support

Frequently Asked Questions

What is useThinkScript?

useThinkScript is the #1 community of stock market investors using indicators and other tools to power their trading strategies. Traders of all skill levels use our forums to learn about scripting and indicators, help each other, and discover new ways to gain an edge in the markets.

How do I get started?

We get it. Our forum can be intimidating, if not overwhelming. With thousands of topics, tens of thousands of posts, our community has created an incredibly deep knowledge base for stock traders. No one can ever exhaust every resource provided on our site.

If you are new, or just looking for guidance, here are some helpful links to get you started.

What are the benefits of VIP Membership?
VIP members get exclusive access to these proven and tested premium indicators: Buy the Dip, Advanced Market Moves 2.0, Take Profit, and Volatility Trading Range. In addition, VIP members get access to over 50 VIP-only custom indicators, add-ons, and strategies, private VIP-only forums, private Discord channel to discuss trades and strategies in real-time, customer support, trade alerts, and much more. Learn all about VIP membership here.
How can I access the premium indicators?
To access the premium indicators, which are plug and play ready, sign up for VIP membership here.
Back
Top