axlerod
Member
I dont use the rv1 for premarket. I have a scanner that identifies gap up or high momentum stocks before the bell. It works better than anything TOS has to offer but there is sometimes too much to sort through and the moves are fast and furious in pre market. I agree with waiting after the bell to get in. Too much going on at that time.
Also the biggest factor in determining a mover is news associated with it. twitter is a good source. Every stock can pop but the ones that go ballistic are the ones that have a catalyst.
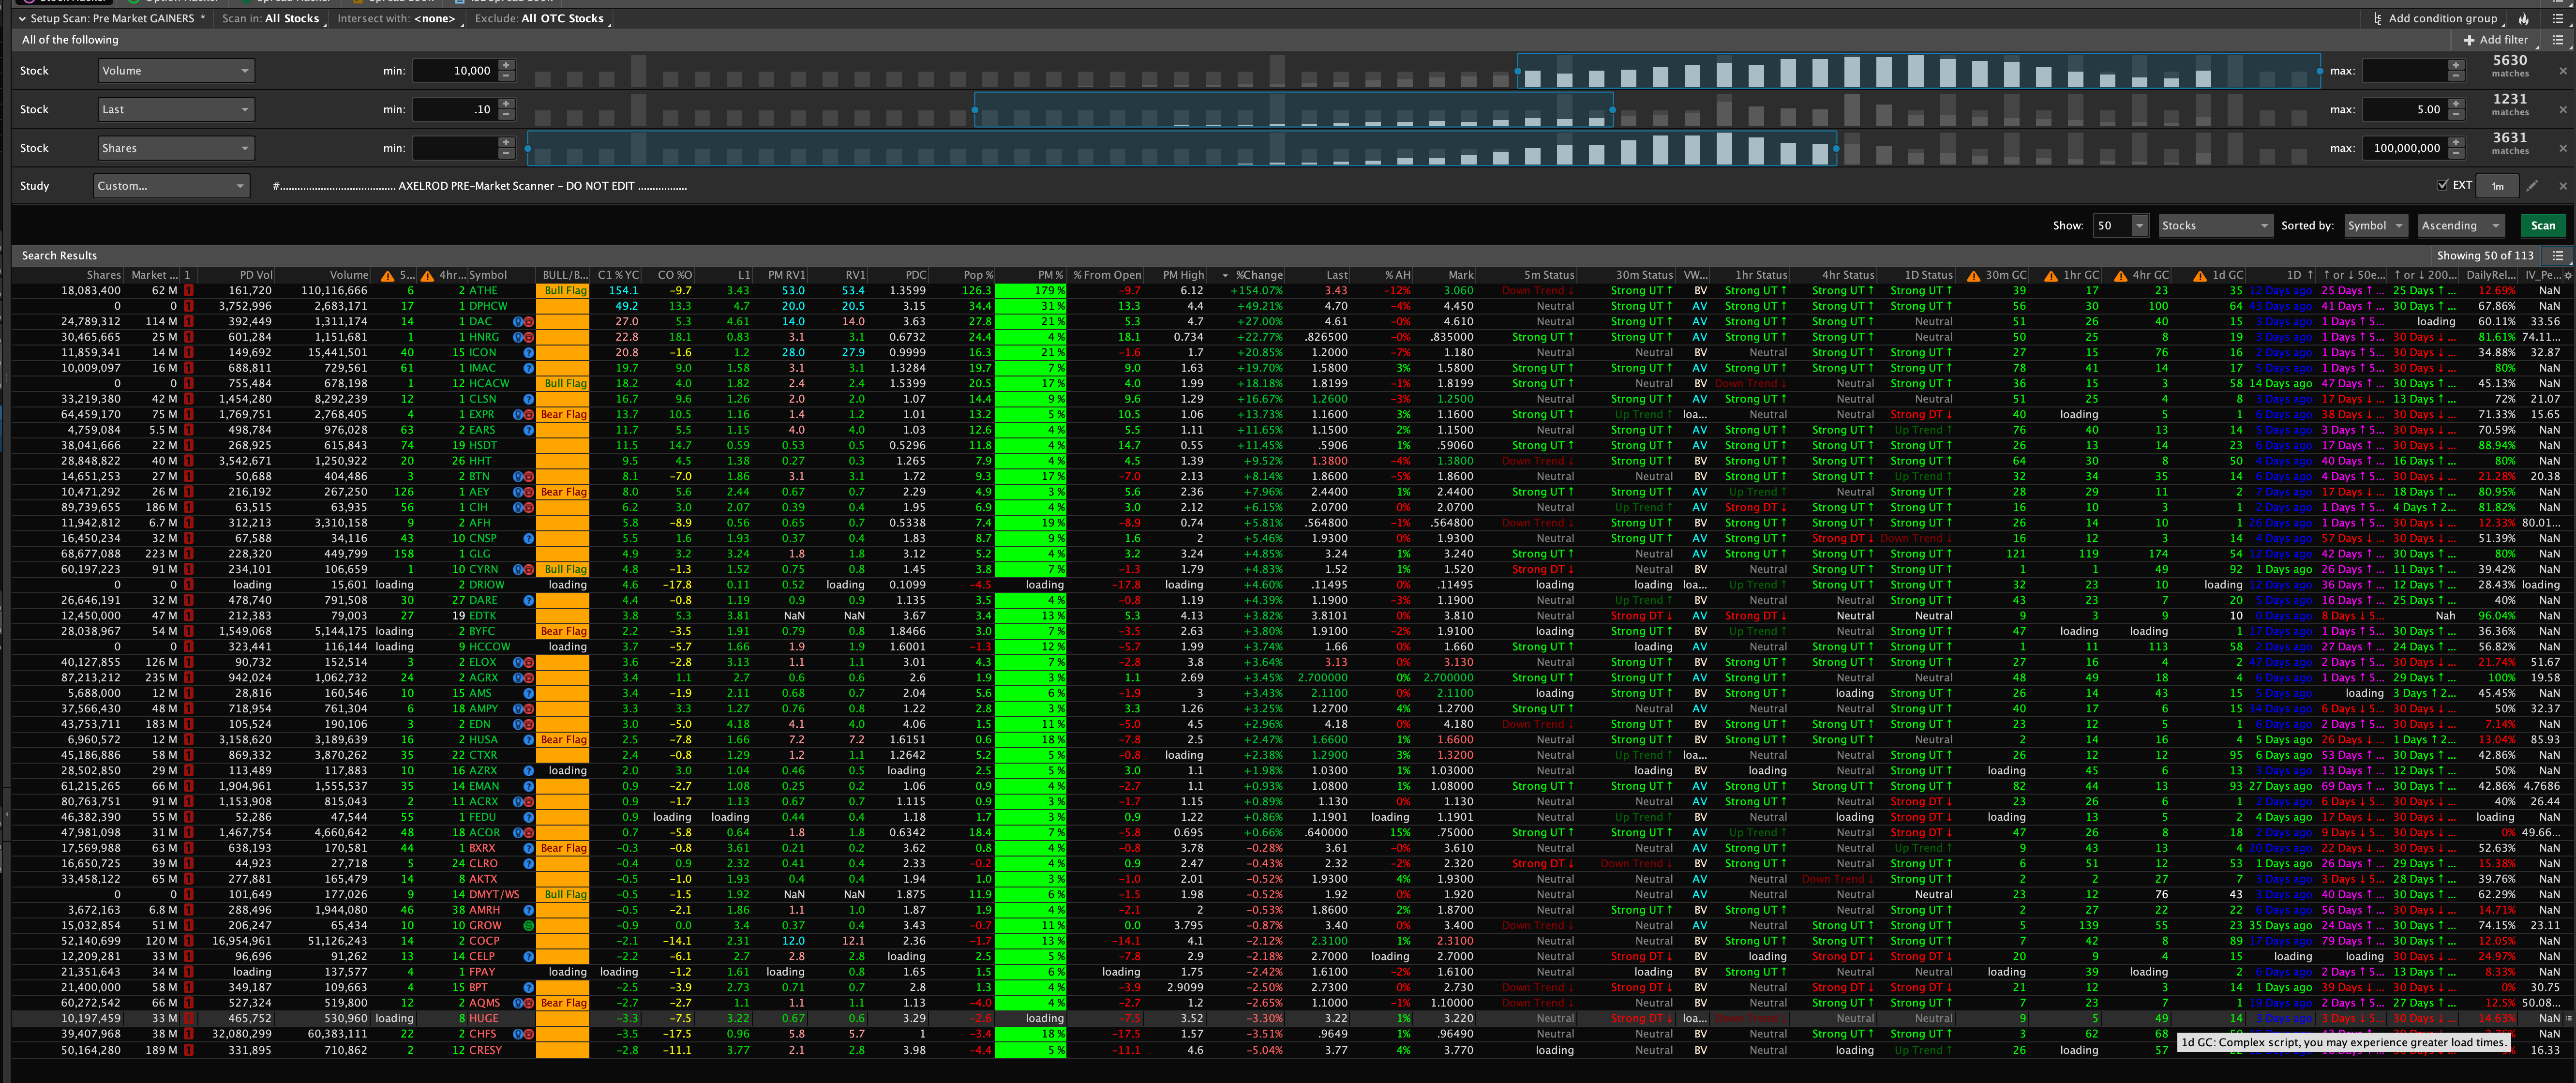
Try this may help as this gives a nice view of everything my pre-market scan
CURRENT PIC is today at 10pm so showing all the stocks it would of picked up but at 8am -9:30 am there are only 3-10 options on it.
From there I add different custom studies I have done or variables to narrow it down from volume change to average volume or golden cross recently etc.
here is what it looks like
Scan Link - http://tos.mx/wH4xQQH
Column Links
- Previous Day Close - http://tos.mx/FmJ7h5a
- Pre Makret % Change - http://tos.mx/jOD8vHl
- After Hours % Change - http://tos.mx/QZzK6wU
Too much code to paste each snippet sorry but can do if people will like. Figure link be easier.