UpTwoBucks
EDUCATOR
To Install: Copy link below, Click Setup Top right, Open Shared Item, "CTRL V" to paste, Preview, Import. Move it over to your chart if not there.
Updated Version 2 Pull Back Indicator: https://tos.mx/eZnhche
Custom Volume Label: https://tos.mx/4vIM0Zz
Bid Ask Spread: https://tos.mx/Hz4C0iC
My Desk Top: https://tos.mx/ysvL8jE
1 Min Pull Back Scan: https://tos.mx/Mri5Hvh
5 Min Pull Back Scan; https://tos.mx/Xcb7QSw
15 Min Pull Back Scan; https://tos.mx/q2C8jaS
If you imported the links above, you do not need to copy and paste the code below.
Ruby:
#Pull Back Indicator. created by Ricky Gaspard 4/2/2023
#Pull Back Arrows V2
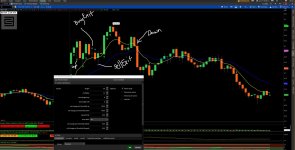
# Green Arrow = Possible Buy
# Yellow Arrow = Possible Sell
# Red Arrow Possible Short
input length = 50;
input multiplier = 1.5;
input emaLength = 8;
input emaLengthSell = 8;
def ma = MovingAverage(AverageType.SIMPLE, close, length);
def pullbackValue = ma - multiplier * Average(TrueRange(high, close, low), length);
def isPullback = close < pullbackValue;
def ema = ExpAverage(close, emaLength);
def isFirstGreenCandle = !isPullback and close > open and close[1] <= open[1] and close > ema;
def isFirstRedCandle = isPullback and close < open and close[1] >= open[1];
def isFirstGreenAfterRed = Sum(isFirstGreenCandle, 1) == 1;
def isFirstRedAfterGreen = Sum(isFirstRedCandle, 1) == 1;
def priceCrossesBelowEMA = close crosses below ExpAverage(close, emaLengthSell);
plot PullbackIndicator = isFirstGreenAfterRed;
PullbackIndicator.SetPaintingStrategy(PaintingStrategy.BOOLEAN_ARROW_UP);
PullbackIndicator.SetLineWeight(2);
PullbackIndicator.SetDefaultColor(Color.GREEN);
plot PullbackRedIndicator = isFirstRedAfterGreen;
PullbackRedIndicator.SetPaintingStrategy(PaintingStrategy.BOOLEAN_ARROW_DOWN);
PullbackRedIndicator.SetLineWeight(2);
PullbackRedIndicator.SetDefaultColor(Color.RED);
#Volume Spike
# Set the percentage threshold for the spike
def spike_percentage_threshold = 0.0;
# Calculate the relative volume for the current bar
def rel_vol = volume / Average(volume, 50);
# Calculate the percentage change in volume relative to the average volume
def vol_change_pct = (rel_vol - 1.0) * 100.0;
# Determine if the current bar has a volume spike
def is_spike = vol_change_pct >= spike_percentage_threshold;
# Define the label value as the percentage change in volume if it is a spike, otherwise NaN
def label_value = if is_spike then vol_change_pct else Double.NaN;
# Determine if the current bar is bullish or bearish based on the close price
def is_bullish = close > open;
def is_bearish = close < open;
plot arrowDown = if priceCrossesBelowEMA then low else Double.NaN;
arrowDown.SetPaintingStrategy(PaintingStrategy.BOOLEAN_ARROW_DOWN);
arrowDown.SetLineWeight(1);
arrowDown.SetDefaultColor(Color.YELLOW);
# Add the label to the watch list
AddLabel(yes,
if is_spike and is_bullish then Concat(AsPercent(vol_change_pct / 10000.0), " - BULLISH SPIKE" + " ")
else if is_spike and is_bearish then Concat(AsPercent(vol_change_pct / 10000.0), " - BEARISH SPIKE" + " ")
else "",
if is_spike and is_bullish then Color.GREEN
else if is_spike and is_bearish then Color.LIGHT_RED
else Color.BLACK);
### End Code ###
Last edited: