Relative Volume Spike Buy Sell Chart Setup For ThinkOrSwim

UpTwoBucks

EDUCATOR
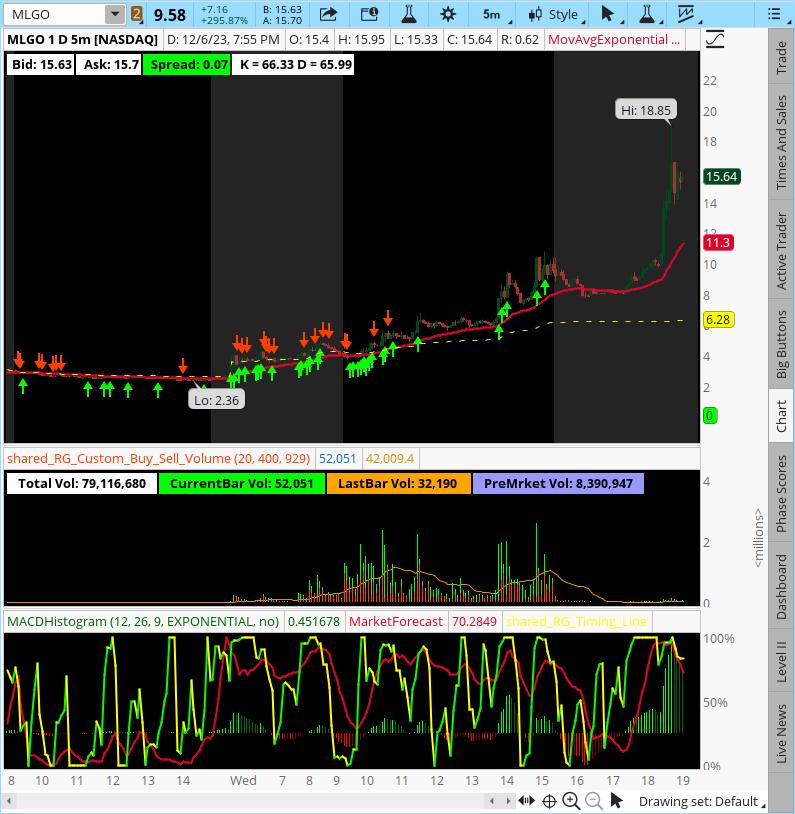
VSpike Buy and Sell Arrows

I have recently seen an indicator that's being built to predict future movement of the next candles. I wish them the best. While we wait around for that to happen, here's an indicator that will let you watch the future being built right before your eyes.

Instructions: Load these indicators first.

To load these indicators, copy the link below, click setup (Top Right), Load Shared Item, paste the link (CTRL V), Preview, Then Import. Click Studies, Edit Studies, Find the indicator, Move it from the left column to the right if not already loaded.

Bid Ask Spread Label: http://tos.mx/xcA9Z51

Slow Stochastics Label: https://tos.mx/vphjMQP

VSpike Scalping Arrows: https://tos.mx/yEty1c2

Custom Buy Sell Volume: https://tos.mx/zyXNPcw

Timing Indicator: https://tos.mx/AyyqZAL

The Market Forecast Indicator will load as it is a ToS Indicator

Once you have loaded the indicators, load my shared desktop. https://tos.mx/OD7JfpG

Code:
#####Copy Code Below#####

#Created By Ricky Gaspard 5/01/2023
# Set the percentage threshold for the bullish spike
input bullish_spike_percentage_threshold = 100.0;

# Set the percentage threshold for the bearish spike
input bearish_spike_percentage_threshold = 100.0;

# Calculate the relative volume for the current bar
def rel_vol = volume / Average(volume, 50);

# Calculate the percentage change in volume relative to the average volume
def vol_change_pct = (rel_vol - 1.0) * 100.0;

# Determine if the current bar has a bullish volume spike
def is_bullish_spike = vol_change_pct >= bullish_spike_percentage_threshold and close > open;

# Determine if the current bar has a bearish volume spike
def is_bearish_spike = vol_change_pct >= bearish_spike_percentage_threshold and close < open;

# Define the label value as the percentage change in volume if it is a spike, otherwise NaN
def label_value = if is_bullish_spike or is_bearish_spike then vol_change_pct else Double.NaN;

# Define the label
AddLabel(yes,
         if is_bullish_spike then "BUY NOW"
         else if is_bearish_spike then "SELL NOW"
         else "",
         if is_bullish_spike then Color.GREEN
         else if is_bearish_spike then Color.LIGHT_RED
         else Color.BLACK);

# Add a boolean arrow
plot bullish_arrow = is_bullish_spike;
plot bearish_arrow = is_bearish_spike;
bullish_arrow.SetPaintingStrategy(PaintingStrategy.BOOLEAN_ARROW_UP);
bearish_arrow.SetPaintingStrategy(PaintingStrategy.BOOLEAN_ARROW_DOWN);
bullish_arrow.SetDefaultColor(Color.GREEN);
bearish_arrow.SetDefaultColor(Color.LIGHT_RED);

#####End Code#####

 
Last edited:
Wow, thank you for sharing your wisdom and knowledge regarding this setup and indicators! I watched your YouTube video tutorial on how to use this setup. Phenomenal! I'm new here. Trying to navigate the information available, and I was interested in volume trading which your setup populated. Awesome! Have a bless day! Again, thank you @uptwobucks
Your Welcome. God Bless.
 
Thanks for sharing! I watched all of your youtube videos.

Can you please explain how and what to look for when you use your Market_Forecast and the RG Timing_Line indicator?

Do you just look for the green or red arrow to pull the trigger or do you use it in correlation with the Market_Forecast and RG Timing_Line indicator?

I was confused on the video because you had said in one part that you like when the Market_Forecast and the RG Timing_Line were close together going in the same direction but do you also need that and also green on the histogram?

Thanks in advance.
 
Is there anyway I can get a watchlist column script that displays the first 5 minutes volume 9.30 to 9.35 green and red separate and after 9.35 to 9.40 other column so we can watch 100 stocks on our watchlists and take decision which stock buy volume more and sell volume more...
 
My first trade NVDA with this volume spike indicator was a winner - Very intrigued with this since I mainly use trendlines and fibs but especially in scalping situations this looks promising! Well done to UpTwoBucks! Honestly would expect more traction to this thread but if you are just seeing this for the first time highly encourage you to play with it - if you are new to trading use caution and don't follow the signals blindly as the author said let the market settle and watch and learn the nuances from the video before taking risk.
 
Is there anyway I can get a watchlist column script that displays the first 5 minutes volume 9.30 to 9.35 green and red separate and after 9.35 to 9.40 other column so we can watch 100 stocks on our watchlists and take decision which stock buy volume more and sell volume more...
Install this in your watch list:
Volume Spike Shared Link: https://tos.mx/WY8iqLI
 
Your Welcome, Glad I could help.
Hi Ricky: I sincerely appreciate your help and support, great indicator, started using it.
Just wanted to know if this code is eliminating any stocks outside US because I noticed a stock which almost doubled in a hour but this code did not pick that ticker "MLGO".

Stock almost moved 100% - $9.58 to $15.63.

I am not sure why it was not picked or may be I am doing something wrong. Looking forward for your advise. I was using VolumeSpike Indicator.
 

Attachments

  • MLGO.png
    MLGO.png
    161.5 KB · Views: 90
Hi Ricky: I sincerely appreciate your help and support, great indicator, started using it.
Just wanted to know if this code is eliminating any stocks outside US because I noticed a stock which almost doubled in a hour but this code did not pick that ticker "MLGO".

Stock almost moved 100% - $9.58 to $15.63.

I am not sure why it was not picked or may be I am doing something wrong. Looking forward for your advise. I was using VolumeSpike Indicator.
It does not block symbols but we are experiencing issues with the migration. I'm not getting some stocks in my watch list, my personal watch list disappeared. Etc.
 
Thanks for your quick response. Does this mean that the indicator is not working as expected.
Migration: did you mean when I ran the link in ThinkorSWIM, the code was not migrated properly? Apologies for the bother.

I was so excited that your code was saving $190/month subscription of Benzinga Pro.
@UpTwoBucks is referring to those clients, who got migrated to the Schwab ToS app.
For some of them, their custom studies did not transfer over.
It was required for them to contact support to re-gain their setups.

But no, there is nothing wrong with you using the link on either the TDA or Schwab ToS apps.

The chart shows that $MLGO triggered multiple times from 2:15 to 3:40.
You will notice there was no significant volume after hours accompanying the after hours spike in price so no, there were no additional alerts after hours.

If you have additional questions. You will need to explain in more detail to @UpTwoBucks, what you are looking for, before he can help you.

shared chart link: http://tos.mx/nG4nDk6 Click here for --> Easiest way to load shared links
PFCpOjb.png
 
Last edited:

Join useThinkScript to post your question to a community of 21,000+ developers and traders.

The Market Trading Game Changer

Join 2,500+ subscribers inside the useThinkScript VIP Membership Club
  • Exclusive indicators
  • Proven strategies & setups
  • Private Discord community
  • ‘Buy The Dip’ signal alerts
  • Exclusive members-only content
  • Add-ons and resources
  • 1 full year of unlimited support

Frequently Asked Questions

What is useThinkScript?

useThinkScript is the #1 community of stock market investors using indicators and other tools to power their trading strategies. Traders of all skill levels use our forums to learn about scripting and indicators, help each other, and discover new ways to gain an edge in the markets.

How do I get started?

We get it. Our forum can be intimidating, if not overwhelming. With thousands of topics, tens of thousands of posts, our community has created an incredibly deep knowledge base for stock traders. No one can ever exhaust every resource provided on our site.

If you are new, or just looking for guidance, here are some helpful links to get you started.

What are the benefits of VIP Membership?
VIP members get exclusive access to these proven and tested premium indicators: Buy the Dip, Advanced Market Moves 2.0, Take Profit, and Volatility Trading Range. In addition, VIP members get access to over 50 VIP-only custom indicators, add-ons, and strategies, private VIP-only forums, private Discord channel to discuss trades and strategies in real-time, customer support, trade alerts, and much more. Learn all about VIP membership here.
How can I access the premium indicators?
To access the premium indicators, which are plug and play ready, sign up for VIP membership here.
Back
Top